USDCZK SellCurrently the pair is in downtrend. I think before starting a uptrend it will make a dip , trying to approach to bottom line. In 4H timeframe we can see a head-shoulder pattern. The risk ratio reward is almost 1 to 3.5 , a good setup worth of taking in consideration.
Usdshort

DX - USD Index Longterm Outlook Indicates Further DeclineThis long-term chart shows how the USD Index is trading within the boundaries of the Median Line set.
We see the lower extreme, solid support around the Center Line, and the upper extreme acting as resistance.
What’s next?
Well—if it’s not heading higher, it’s likely heading lower—and the rejection at the Upper Median Line (U-MLH) supports that view.
If we revisit the Center Line, my experience tells me it won’t hold—we’ll break through and head even lower.
Buckle up. It’s going to be a rough ride.

Dollar Bounce to 103 Incoming or Straight to 96?Will the Dollar Keep Tumbling, or Are We About to Bounce Back to 103 in May?
Checking out the monthly charts, April finally delivered a close under that critical 100 level, breaking a floor that held firm for years:
Zooming into the weekly chart, we’ve retraced back to test the 100 level from below. It’s now acting as resistance—so, is another big drop coming?
Long term, my bias is clear: the dollar looks set to keep sliding lower after breaking the crucial 100 mark. But if we flip to the daily charts, we can clearly see signs of a short-term bounce brewing. It looks like price might want to squeeze back inside the range, aiming for that juicy sell zone around the 103 mark—the very origin of the leg down that initially broke 100:
This 103 area is a prime spot for short-term bulls, and an even better opportunity to start loading up on shorts for a move down towards the Monthly buy zone around 96.
Personally, I won’t trade USDX directly to the upside—I'll instead use this analysis to play setups on pairs like EURUSD and AUDUSD, as they're approaching key resistance areas right now.
My game plan: wait patiently for price to reach around 103, then start hunting for sell signals. But first, we’ll need a solid daily close back above 100, something I think we could see happen this week.
Don’t forget—we’ve got the Fed’s interest rate decision coming up, which might trigger some volatility. We could easily rally up to 103 ahead of the decision and then see a sell-off afterward. Of course, if the Fed throws us a curveball, the dollar might never get back above 100, and just continue dropping straight away.
Right now, the 100 level is crucial—so watch closely.
What’s your take? Drop your thoughts below! 😊

EURUSD 15 March Next Week IdeaEuro is still strong . Last day of a week 15 March Friday , it got a good pump. I am looking for buying opportunities for EURUSD pair.
The price closed above 50 percent of previous day.
Stands strong.
USD is crashing.
Best Regards
dzhvush

US Dollar Bearish Trend: Key Insights Analyzed**Is the US Dollar Heading for a Bearish Turn? Key Insights to Watch**
The US dollar has been a hot topic lately, and for good reason. With Donald Trump back in office and the motto being *AMERICA FIRST*, the currency’s trajectory is under scrutiny. As many of you know, the Trump administration has historically favored a weaker US dollar and lower interest rates. The rationale? A weaker dollar can boost exports, while lower rates are seen as a way to stimulate economic growth. This approach was a hallmark of Trump’s first term, and it looks like we might see a repeat.
Another key factor to consider is Trump’s focus on increasing crude oil and natural gas production. Higher energy output could lead to lower energy prices, which would further support economic growth. However, this could also weigh on the dollar, as lower energy prices often correlate with a weaker currency.
Looking back to 2016–2017, when Trump first took office, the US dollar initially surged but then reversed sharply in January 2017, marking the start of a prolonged bearish trend. Fast forward to today, and we’re seeing similar patterns emerge. The wedge formation on the Dollar Index suggests limited upside potential, and a break below key support levels—specifically 108 and 107.58—could confirm that a bearish trend is underway. If those levels fail to hold, the next area to watch would be the 107 to 106 demand zones.
This scenario aligns with what we’ve been discussing over the past few weeks. If the Dollar Index breaks below these critical levels, it could signal the completion of the wedge pattern and the beginning of a new bearish phase for the US dollar.
What does this mean for traders and investors? Keep a close eye on the Dollar Index and watch for those key support levels. A break below them could present significant opportunities, but it’s also a reminder to stay cautious and informed.
What are your thoughts on the US dollar’s trajectory? Do you think history will repeat itself, or are there other factors at play? Let’s discuss in the comments!
#USD #Forex #Trading #Economy #Trump #DollarIndex #Investing #Markets

USDJPY: My Trading Perspective (setup)FX:USDJPY : Key Indices Supporting My Trading Perspective
Index and Volume Analysis:
- For this trade, the TVC:DXY (U.S. Dollar Index) plays a critical role. It’s showing continued signs of softening, which aligns with my sell setup for USD/JPY.
- Broader risk sentiment in equity markets is also mixed, with the S&P 500 holding up but without strong upward momentum, which supports the yen’s safe-haven appeal in my analysis.
Key Companies and Influencing Factors:
- The performance of U.S. equities, particularly tech and consumer sectors, signals cautious optimism, but not enough to offset the dollar’s broader weakness.
- On the Japanese side, the SMI reflects stable conditions, giving me confidence that external forces (e.g., global risk sentiment) will favour this trade direction.
Possible Market Impacts:
- My sell setup aligns well with the current environment. A move toward **TP1 (149.057)** is likely if equities fail to gain strong traction and the DXY continues to weaken.
- A push toward **TP2 (148.534)** could occur if risk-off sentiment strengthens globally, amplifying demand for the yen.
- My stop loss at **150.796** is in place to manage risk in case of unexpected dollar rebounds or lack of yen strengthening.
Entry, SL, and TPs:
- Entry: 150.345
- Stop Loss (SL): 150.796
- Take Profit 1 (TP1): 149.057
- Take Profit 2 (TP2): 148.534
*“When the Market’s Call, We Stand Tall. Bull or Bear, Just Ride the Wave!”*
**Disclaimer:**
*Disclaimer: This analysis is for informational purposes only and does not constitute financial advice. Traders should conduct their own due diligence before making investment decisions.*

dont follow the fomo!With the positive news about the US dollar, I am still in my opinion to sell strongly!
tp1 (0.83350) With 540 pips
sl (0.90520)

Will the US Dollar Index Collapse Below 100? Or Back To 105?The big day has arrived: the first Fed rate cut. The burning question is, will it be 0.25% or 0.5%?
In recent days, the markets have been leaning toward a 0.50% cut. Could this be the catalyst for a breakdown below the critical 100 level in the USDX? Let’s break down the charts and find out.
Looking at the weekly charts, the 100 level has been a solid support zone for several years, briefly dipping below last year in what turned out to be a false breakout within the 100 - 107 range.
I’ve highlighted some key levels on the charts: last year’s low at 99.47, and just below that, the 0.99 mark, which is a key Monthly 0.618% fib level and a strong former resistance turned support (see image below).
Below this level is a significant BUY zone, where the massive 2022 rally began, breaking through 100 and eventually driving the price up to nearly 115.
Considering these key areas, I do suspect we may see a breakdown through the 100 level, but it will likely be met with strong buying pressure at the areas mentioned. This is why, for now, I’m leaning toward the upside for the US dollar.
Zooming into the daily charts, an M pattern is forming at this key support, suggesting that price is gearing up to break through the 100 level.
Additionally, there’s a divergence emerging on the MACD, indicating that although a break below 100 might occur, it could be short-lived. This is why we should be looking for buy setups as the price dips under this level.
Zooming in further to the 6-hour charts, we can see the divergence even more clearly, with the MACD on the verge of a crossover to the upside.
With all of this in mind, a whipsaw move could be on the cards today after the rate decision. I’ll be turning on my TRFX indicator and watching for buy setups on dips under 100 and toward 0.99.
Although the USDX may weaken in the longer term, I fully expect a strong reaction at the levels mentioned, with the price likely to run back up toward the 103-104 area before selling off again.
Let me know your thoughts in the comments below!

USDCHF SHORT OPPORTUNITYHey everyone so im looking for a short pullback to 0.85100 as a target we had a nice 15 min shift from the h1 order block we are still trending down , plus we have 2 candle close in high resistance from the 0.85600 level , confirming the rejection of this level ( FOR NOW). We all know that equal highs are like magnet.

DXY is heading to 103.7 maybe lower(07/31/2024)In our last analysis, our predicted zone for DXY correction played well, the DXY corrected from 103.7 to 104.8 and crashed after hitting the last resistance.
We are expecting DXY to retest the 103.7 zone again at least until NFP data.
Our technical view has been shown in the chart.
If you like it then Support us by liking, Following, and Sharing.
Thanks For Reading
Team Fortuna
-RC
(Disclaimer: Published ideas and other Contents on this page are for educational purposes and do not include a financial recommendation. Trading is Risky, so before any action do your research.)

Possible correction waiting for DXY(7/16/2024)DXY faced strong bearish momentum after CPI data. In the last few days TVC:DXY made a minor correction but the sentiment around USD is still bearish.
We believe DXY continue its downward momentum until it reaches the 13.8 area.
This area has a lot of liquidity, so maybe push the price to a little correction.
Our technical view has been shown in the chart.
If you like it then Support us by Like, Following, and Sharing.
Thanks For Reading
Team Fortuna
-RC
(Disclaimer: Published ideas and other Contents on this page are for educational purposes and do not include a financial recommendation. Trading is Risky, so before any action do your research.)

DXY mini wave upward(5/7/2024)After the NFP and unemployment data, The DXY TVC:DXY faced a big correction.
In this week, we believe this week is going to be calm because USD has no game-changing data.
there is a possibility that the DXY is going to make some retracements in an upward direction.
Our technical view has been shown in the chart.
If you like it then Support us by Like, Following, and Sharing.
Thanks For Reading
Team Fortuna
-RC
(Disclaimer: Published ideas and other Contents on this page are for educational purposes and do not include a financial recommendation. Trading is Risky, so before any action do your research.)

USDCAD Bearish Momentum USDCAD on daily TF shows large volume of bearish candles. The daily support is broken and it looks like it will test downward support and trend line. Will it work? What do you think?

USDJPY to 136?After Covid-19 USD pumped like crazy now it is time to chill down and do some pullbacks. As you can see beautiful Double Top formed and neck is around 128. Here is my idea of how it will go and where I am gonna take profits.

XAGUSD - USD Continues To Get Weaker?Analysis:
Upwards trend (bullish confluence factor)
Break & retest of previous area of resistance for support (bullish confluence factor)
38.2% fib retracement level touch (bullish confluence factor)
Upwards trendline close by (bullish confluence factor)
6K long position decrease for the USD (bullish confluence factor)
Stay Safe - The JPI Team
Please feel free to leave any comments you have and like this idea if you agree with us. Any feedback or comments will be read and responded to. We any comments at all so thank you!
Disclaimer:
This does not constitute as financial advise. We are not responsible for any monetary loss that you endure. Trading is hard to be profitable with and we take losses just like everyone else does too. Our ideas won't always be correct which is why we urge you to always do your own analysis first before entering into the market but please feel free to use our analysis to assist you with yours.

USDCAD SHORThello my friends.well in this setup we have CHOCH in daily and a bearish candle closed under the last low in 4hr,so we have CHOCH in 4 too.
now we wait for reason in smaller time frame to open short position.
just a point,i see this demand area(around 1.31300) and maybe we have reaction on it,but i think the power of high time frame for short is more. good luck.
“”your follows and boosts encourage me to publish more analysis””

NZDUSD - The USD Will Continue To Fall!Analysis:
Upwards trend (bullish confluence factor)
Retest of an old support level (bullish confluence factor)
61.8% fib retracement level (bullish confluence factor)
Upwards trendline touch (bullish confluence factor)
NZD is the 5th strongest major currency whereas the USD is the 3rd strongest major currency (bearish confluence factor)
2K short position increase for the NZD (bearish confluence factor)
8K short position increase for the USD (bullish confluence factor)
Comments:
Despite the strength of the US, the USD has been pretty bearish for a while now and it looks as if this could continue. We're pulling back into a strong area which we expect to hold as resistance for the DXY, meaning that we could then see a continuation to the downside which in turn would favour our idea on NZDUSD. Whilst we don't have all of the confluences pointing to bullishness, we still have the majority showing bullish signs. With the confluences we have on NZDUSD along with the technicals we have on the DXY we expect to see the USD continue its bearish move to the downside, pushing price higher on NZDUSD. This is what gives us our bullish bias.
Stay Safe - The JPI Team
Please feel free to leave any comments you have and like this idea if you agree with us. Any feedback or comments will be read and responded to. We any comments at all so thank you!
Disclaimer:
This does not constitute as financial advise. We are not responsible for any monetary loss that you endure. Trading is hard to be profitable with and we take losses just like everyone else does too. Our ideas won't always be correct which is why we urge you to always do your own analysis first before entering into the market but please feel free to use our analysis to assist you with yours.

DXY - USD Approaching Last Resort Of SupportSounds dramatic, I know. :-)
We see where price got rejected near the Centerline (white).
We see that price broke the little (blue) shelf which inflects with the orange Centerline. So, orange Centerline is broken too.
According to the rules of the Medianlines, we can expect a pullback to it. And it would be a little Gift to enter Short, or load up the boat.
However, the last support before a massive breakdown is the white Lower Medianline Parallel. If we break through this level, the new target is huge, down at the L-MLH of the orange Medianline (Target Zone).
To me, this would also open other opportunities. For example a Bold Long in Crude Oil.

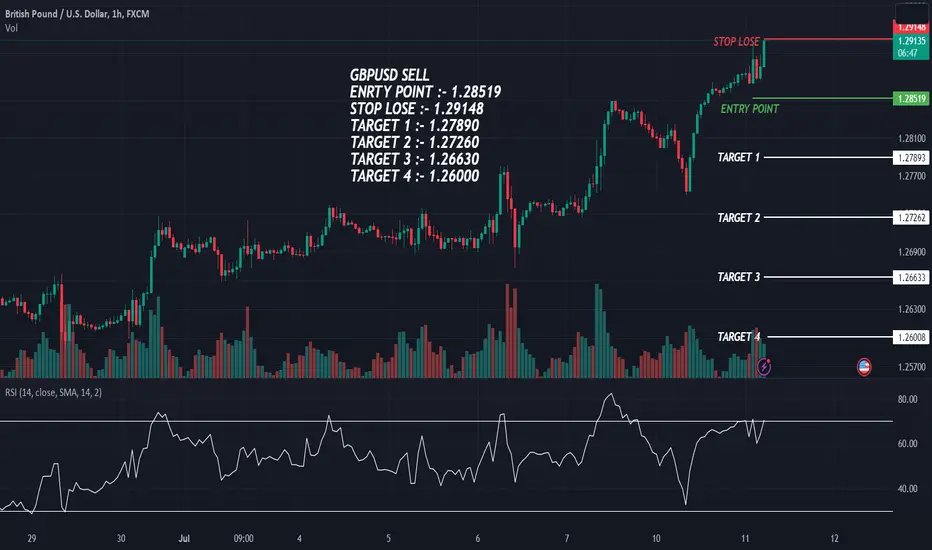
GBPUSD SELLGBPUSD SELL
Entry Point :- 1.28519
Stop Lose :- 1.29148
Target 1 :- 1.27890
Target 2 :- 1.27260
Target 3 :- 1.26630
Target 4 :- 1.26000
GBPUSD - Pullback Before A Continuation Higher!Analysis:
Looking at the charts we're clearly able to see that price is in an upwards trend. We've been forming higher highs and higher lows which shows us the trend we're in so knowing this we're only looking for long setups on this pair. We also have a key level which we've marked out where we've previously seen a strong rejection from but we've since broken higher and we're currently retesting this previous level of resistance for support. As we know resistance very often becomes support which is what we're expecting to happen now. To further add to our idea and why we think price will head to the upside from this level, we also have the 38.2% fib retracement level. Whilst this isn't the strongest level we still do often see this area hold and with this fib retracement level being at our area of support we expect that it will hold and we'll see buyers step in, pushing price higher. Another confluence factor that we have is the upwards trendline that is present. When this trendline has been tagged before we've seen buyers step in and push price higher. This trendline also lines up with our area so we have a really strong level of support which is why we think this is a good place to enter. The fundamentals as well favour our idea. Currently the USD is the strongest major currency whilst the GBP is the 3rds strongest major currency. Whilst this doesn't go in our favour, if we dig a little deeper we can see why we are actually fundamentally bullish on the GBP over the USD. As of the most recent report for institutional positioning we saw a decrease in both long and short positions for the USD so this is neutral whereas for the GBP this is an entirely different story. As of the most recent report for institutional positioning on the GBP we saw a massive increase in long positions whilst also seeing a massive decrease in short positions so this is very bullish for the GBP and this looks like to us, early signs of possible bullishness to come for the GBP. With the technicals and fundamentals both pointing to buy the GBPUSD we get a bullish outlook for this pair. This position will also help to hedge our USD positions as we are heavily involved in the USD currently and with this position we're able to make money if the USD goes up or down because we're hedged. At JPI we like to hedge certain positions when we're exposed as this allows us to better manage our risk and with such a bullish setup on GBPUSD this seems like a perfect pair to hedge positions against.
Please feel free to leave any comments you have and like this idea if you agree with us. Any feedback or comments will be read and responded to. We any comments at all so thank you!
Stay Safe - The JPI Team
Disclaimer:
This does not constitute as financial advise. We are not responsible for any monetary loss that you endure. Trading is hard to be profitable with and we take losses just like everyone else does too. Our ideas won't always be correct which is why we urge you to always do your own analysis first before entering into the market but please feel free to use our analysis to assist you with yours.

AUDUSD - Are The Bulls Getting Ready To Push Price Higher?Analysis:
When we look at price action we've recently seen a strong rejection off of an area and price is making a move back down however we see this as a buying opportunity. If we look at price action before this rejection we can see that price did indeed form a higher high and a higher low showing us that we're in an upwards trend. This higher low hasn't yet been broken so we're still in that upwards trend. At the start of June there was some real strong momentum on the AUDUSD for the bulls and it looks as if they are currently taking a break before we see a continuation higher. This position will also hedge our other USD long positions so if we are incorrect about the USD strength we expect then we will still be able to profit. As a professional trader you need to remember that your job isn't to make a million percent in a year. It's to make a consistent profit whilst managing your risk. If you can't manage risk then you won't make it as a trader and that's the harsh truth. Hedging allows you to diversify your risk which is why we like to do it here at JPI. Were price is currently is an interesting area to us because if we look left on the chart we can see price has held this zone multiple times as support previously and we expect that this will happen again as very often we see this. For more confluence we saw slowing down momentum for the bears at the start of the week as the candles were very small and were indicating a possible reversal. This was also where the 50% fib retracement level was so there was even more confluence that price was going to reverse there, however we were more interested in level slightly below. Early this morning we had some worse then expected news for the AUD so we saw price push down and tag the 61.8% fib retracement level which is often classed as the strongest fib level and we expect that this is were buyers will be sat at wanting to push price higher. With the slowing bearish momentum that we saw this week around the 50% fib retracement level and with the 61.8% fib retracement level being tagged this "golden zone" which is just the area between the 50% fib retracement level and the 61.8% fib retracement level looks like a great place to enter long from especially from our area which is also in this "golden zone". For more confluence we also have an upwards trendline. This trendline is better seen on the weekly timeframe. When this level has been touched before we've seen bulls step in and push the market higher so we'd expect this to happen again. This trendline is below our entry but above our stop loss so if we we're to go into drawdown then there would be a strong level where we'd expect buyers to step in so this gives us more confidence in our setup. Why don't we enter at this trendline then? Well where price is at currently looks like a stronger area for possible reversals and we don't want to miss this trade as it's a good setup. The upwards trendline is just another confluence to add to our bullish thesis. Fundamentally as of the most recent report on institutional positioning the USD is the strongest major currency whereas the AUD is the 6th strongest major currency so this doesn't go in our favour. However if we dig a little deeper you can see why we currently prefer the AUD over the USD. As of the most recent report on institutional positioning we saw a decrease in both short and long positions on the USD so this is pretty neutral but on the AUD in regards to the most recent report for institutional positioning we actually saw an increase in long positions and a decrease in short positions which is very bullish. This could be early signs that we could see some bullishness for the AUD in coming weeks. Although the AUD news this morning wasn't positive we still have loads of confluence factors pointing to bullishness on the AUD which is why we have an overall bullish view on AUDUSD.
Please feel free to leave any comments you have and like this idea if you agree with us. Any feedback or comments will be read and responded to. We any comments at all so thank you!
Stay Safe - The JPI Team
Disclaimer:
This does not constitute as financial advise. We are not responsible for any monetary loss that you endure. Trading is hard to be profitable with and we take losses just like everyone else does too. Our ideas won't always be correct which is why we urge you to always do your own analysis first before entering into the market but please feel free to use our analysis to assist you with yours.

GBP/USD Swing TradingShakeout Absorption
Confirmative Comeback to the zone
Stop loss below support area
Take Profit on the other edge
3.63 r/r

USDJPY FVG 15.05.23 INTRADAYFair value Gap Intraday Bearish USD. waited for price to respect the Fair value gap left after a bearish run - short traders have now taken profits and are willing to short
