BTCUSDT — Bearish Structure Intact, Watching for BreakdownHello everyone, here is my breakdown of the current Bitcoin setup.
Market Analysis
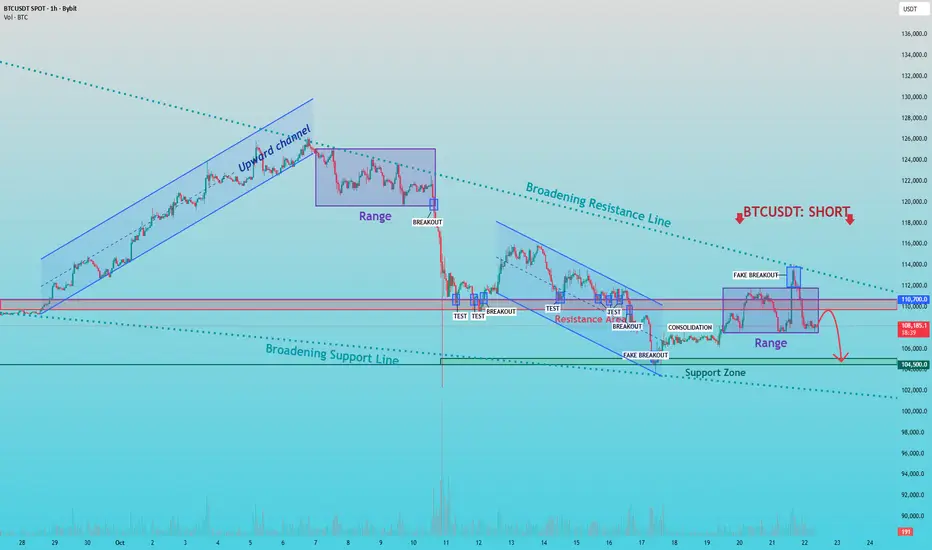
From a broader perspective, BTCUSDT has been trading inside a broadening formation, marked by expanding highs and lows — a typical sign of increasing volatility and market uncertainty. After a strong upward move within an ascending channel, the structure broke down, shifting the market momentum from bullish to bearish.
Following the breakdown, price entered a period of range-bound consolidation and multiple tests of resistance, each confirming that sellers remain in control. The most recent fake breakout above the 114,000 zone served as a strong rejection signal — a clear sign that buying momentum is fading and that the market could be preparing for another leg down.
My Scenario & Strategy
My scenario is based on the idea that the current movement is a corrective rebound within a larger bearish structure. As the price approaches the resistance area around 110,700, I expect selling pressure to increase once again. The plan is to watch how the price reacts around this resistance zone. A confirmed rejection or failure to break above this level would validate the short scenario, potentially leading to a continuation move toward the 104,500 support zone, which aligns with the lower boundary of the broadening formation.
That's the setup I'm tracking. Thank you for your attention, and always manage your risk.
USDT-D
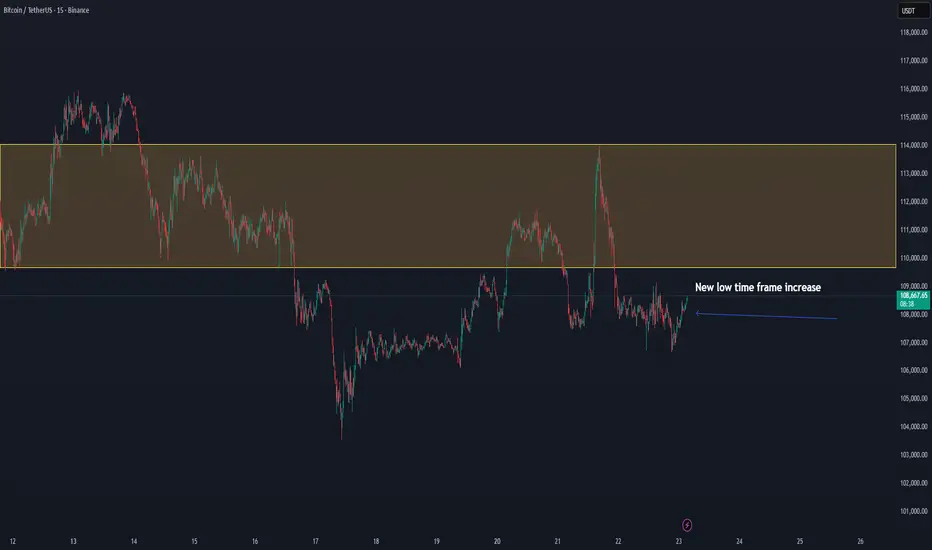
BTC/USDT — New Low-Timeframe Expansion Forming, Potential 114k+Bitcoin is beginning to show strength in the new low-timeframe structure, reclaiming the $108K zone with rising momentum. This confirms a short-term bullish shift after the recent consolidation.
The key resistance range between $110K–$114K remains the main obstacle, but if BTC maintains higher lows and continues to push within this structure, a move toward $118K becomes likely.
📊 Technical Overview:
Support: $106K–$108K
Range Resistance: $110K–$114K
Next Upside Target: $118K
Bias: Bullish on low-timeframe momentum
BTC’s ability to sustain above the $108K region suggests growing buyer confidence — confirmation above $110K could trigger continuation toward the upper range.
📈 Outlook: Low-timeframe expansion
🎯 Targets: $110K → $114K → $118K
BTCUSDT: Short Setup Active Below $110,700Hello everyone, here is my breakdown of the current Bitcoin setup.
Market Analysis
On the 1H timeframe, Bitcoin continues to move inside a descending channel, maintaining a clear bearish structure.
After multiple tests and breakouts, the price is still unable to break through the Resistance Area around $110,700, which remains a strong supply zone.
Recently, we saw a fake breakout, followed by a return below the resistance area — confirming that buyers are losing strength. Currently, the price is forming a range near the Support Zone ($104,500–$105,000), which indicates a short-term consolidation phase before a possible next move.
My Scenario & Strategy
I expect that after the range is broken to the downside, BTC will continue its decline toward the Support Zone ($104,500). If this level fails to hold, the next potential target will be the lower boundary of the descending channel around $102,300.
However, a breakout and close above $110,700 would invalidate the bearish scenario and could indicate a shift in market structure.
That's the setup I'm tracking. Thank you for your attention, and always manage your risk.

Market Sentiment Shifts: Fear & Greed, Liquidity & Next Cycle🌍 A truly global look at the market!
😱 The Fear & Greed Index has been sitting at 29 for the second day in a row, after recovering from 22–23 — even though the market has been trying to bounce for two days
That means all euphoria is dead — no more 10–15 random spikes a day.
📉 Short-term — not great.
📈 Long-term — that’s actually good.
⚠️ The index trying “get the bottom,” but historically major trend reversals happened around 10–15 points — keep that in mind.
💰 Meanwhile, index USDT.D looks ready for another big downward wave, which usually means stablecoins start flowing back into crypto 🐸
(Which ones? That’s the mystery for all, will see soon 😉)
🪙 A short bullish phase might last until spring 2026, or, if the cycle stretches, even until late 2026 – early 2027 😉
⁉️ But here’s the key question — where will the new money come from?
Because liquidating traders for $30–50B and then handing out “cashbacks” of $400–500M… that’s laughable 🐔
And expecting a March 2020-style buyback again? Unrealistic.
👉 Back then, people were locked at home, got freshly printed $, and instantly sent them to exchanges 💵
That was a real injection of fresh blood into the market — hundreds of billions.
Now? Nothing like that… or not yet 😉
🤔 What do you think — will a new wave of liquidity appear soon, or does the market still need more pain before the next leg up?
______________
◆ Follow us ❤️ for daily crypto insights & updates!
🚀 Don’t miss out on important market moves
🧠 DYOR | This is not financial advice, just thinking out loud

THE RETURN OF BTC TO 110K ON WAY..There is high chance in the coming time we can see a BTC breakout return to 110K in the coming time. Today Sunday, can be an important day before the start of the weekly chart.
106K can become an important secure zone for the next increase in volume

ICP Big Oppotunity Don't Miss Out!Hey Guys!
Wether you're an early investor of ICP or not, the current situation is different!
As you know ICP has been going on a downtrend since the day it has been launched and a lot of early investors lost their money betting on a real project like ICP thinking it will be the next $Eth.
But with Tragedy comes opportunity ! ICP's Price is about to touch down on the monthly lower Bollinger Bandat 0.6$ which is a historical event in my opinion and with it should come a big reaction by the devs or the investor's community.
I expect a big volume candle followed by a bullish news to breakout from the accumilation zone which will finally end the downtrend for ICP that lasted for years now.
Either way don't be greedy and keep in mind that ICP has an unlimited supply at this time (might change if the project community vote on it) but do the math and don't risk it.
I'm looking forward to hear your thoughts on this and feel free to leave a comment.

Can USDT.D break its high ? | USDT.D 4H Analysis🥳 Hey everyone! Hope you’re doing great! Welcome to SatoshiFrame channel .
✨ Today we’re diving into the 4-Hour Ethereum analysis. Stay tuned and follow along!
💵 Can USDT.D break its high & cause crypto drop again ? Tether Dominance is hovering near the 5% zone after the Trump tariff rumors — a key resistance that perfectly aligns with the crypto market’s bottom. A breakout here could trigger another leg down across altcoins.
👀 4-hour timeframe of Tether Dominance and we can see that after breaking the 4.6% area, it gave us a confirmation for an uptrend, and in this area, it also formed a higher low compared to its previous low. It easily broke through several resistance levels and reached its top at the 5.16% area, where it is now rejected. Since we are in the holiday period, we have faced weak downward momentum, and now several breakout triggers have formed on the Tether dominance chart which, with Tether volume passing through these areas, the market can start its next move. Note that this top that has currently formed is the same as the bottom of the altcoins that we see on various charts, so breaking this top will not be easy.
🧮 The RSI oscillator can be a great help to us in this analysis, as it allows us to better identify the tops and bottoms of Tether dominance. If the oscillation passes through those desired areas, we can take positions on coins contrary to the direct supply and demand of the chart itself. The 74 oscillation zone is slightly above the overbought boundary, and crossing this area can increase the oscillation volume of Tether buy trades and cause the crypto market to lose its bottom. The next important area is the 50 zone, where a reaction to this area or passing the oscillation limit from this area can form a lower top for Tether dominance and then give us confirmation to start a bullish leg in the market.
🕯 The size of the Tether dominance candles during the rise was significantly smaller but closed with more strength, while during reactions and pullbacks, the size and number of candles increased, which informs us of the weakness of the Tether sellers' trend. A noteworthy point for Tether dominance is the rejection it received from the top and then moved downward, facing weak upward momentum. If the market bottom is in this area and the Tether dominance top is also in this area and this top does not break, the market can soon tend toward a trend change and a drop in dominance may occur.
❤️ Disclaimer : This analysis is purely based on my personal opinion and I only trade if the stated triggers are activated .

ADA 5% DROP AHEAD!Theres a chance we get one more push up to test the supply zone ahead before moving down but if not and we move lower from here, it's a 5% drop to the nearest support level.
Just sit back and enjoy the ride.
Calculate Your Risk/Reward so you don't lose more than 1% of your account per trade.
Every day the charts provide new information. You have to adjust or get REKT.
Love it or hate it, hit that thumbs up and share your thoughts below!
This is not financial advice. This is for educational purposes only.

USDT ; there is still hopeOne of the nastiest charts in the cycle that intends to destroy everything is usdt.d , it’s in a crucial point declining from a multi year channel, if it goes down from here it can also break the triangle downward, it will definitely be lovely to see this one breaks down , they will try to inject more to balance the chart so it would be difficult to say any target but let’s hope it goes as planned.
Have a blessed day

Can USDT.D break the Taker Seller Zone ? | USDT.D 1H Analysis👋 Hey everyone! Hope you’re doing great! - ❤️ Welcome to Satoshi Frame .
📅 Today we’re diving into the 1-hour Bitcoin analysis. Stay tuned and follow along!
👀 On the 1-hour timeframe of USDT.D, we can see that after the news of Trump imposing tariffs on China, USDT.D experienced an extremely sharp pump — rising from below 4.3% to near 5%. After that, it formed a trading-range box in this zone. The top of this box lies around 4.89%, overlapping with a “taker-seller” resistance zone where Tether’s market share is currently capped. There’s a key midline at 4.74% and a bottom at 4.59%, completing this trading-range pattern. Price has tested the top three times but failed to break it, meaning USDT.D remains trapped below resistance. A 15-minute multi-timeframe Low has also formed at 4.83%, creating a new structure that, if broken, could trigger Tether selling.
🧮 Looking at the RSI oscillator, since October 12 it has tried three times to enter its 1-hour OverBuy zone but failed each time. Each rejection from around the 70 level led to selling pressure and movement back toward its 50 support zone. This 50 level is a very important static resistance — a breakout above it could push USDT.D toward higher resistance levels. The 50 RSI zone also overlaps with the 4.83% price level, meaning if that area is lost, selling pressure and volume decline could begin.
🕯 The size and volume of recent USDT.D candles show weakness every time it reaches the 4.89% top. Breaking the taker-seller zone will require a large “whale” candle — a strong, high-volume bullish move that can fully absorb the sell orders placed there. In short, breaking this level needs a strong price surge and maximum buying pressure.
🧠 To manage or open new positions using USDT.D as a guide, we can consider these scenarios:
🟢 Breakout of the taker-seller zone: This breakout could be triggered by news or even a Trump tweet :) From a technical standpoint, this area needs a massive, high-volume “whale” candle so that all sell orders in this zone get filled instantly. Once price surges and holds above it, the next resistance would be around 5.1%.
🔴 Break of the 15-minute multi-timeframe Low: This Low sits at 4.83%. A confirmed close below it could signal the start of selling and volume decline. In this scenario, the next support for USDT.D would likely be the box midline — around 4.74%.
❤️ Disclaimer : This analysis is purely based on my personal opinion and I only trade if the stated triggers are activated .

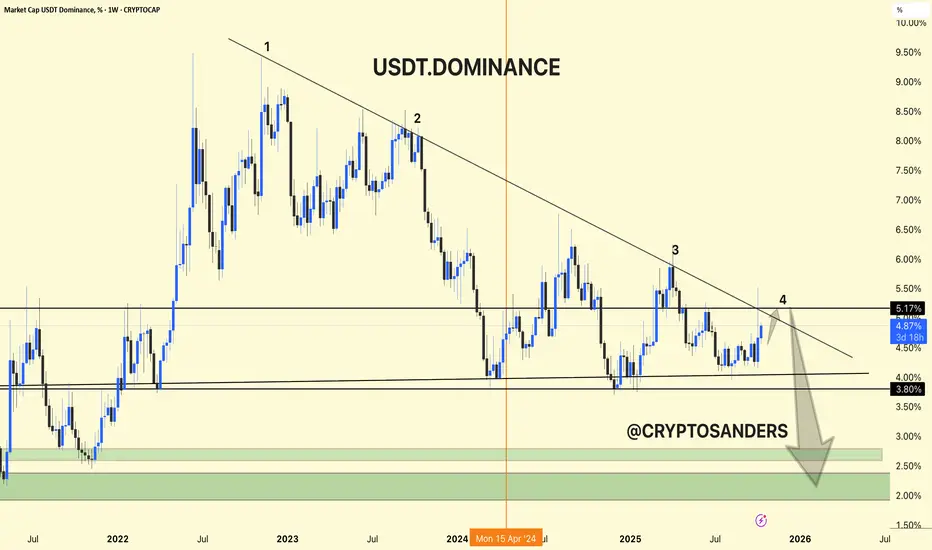
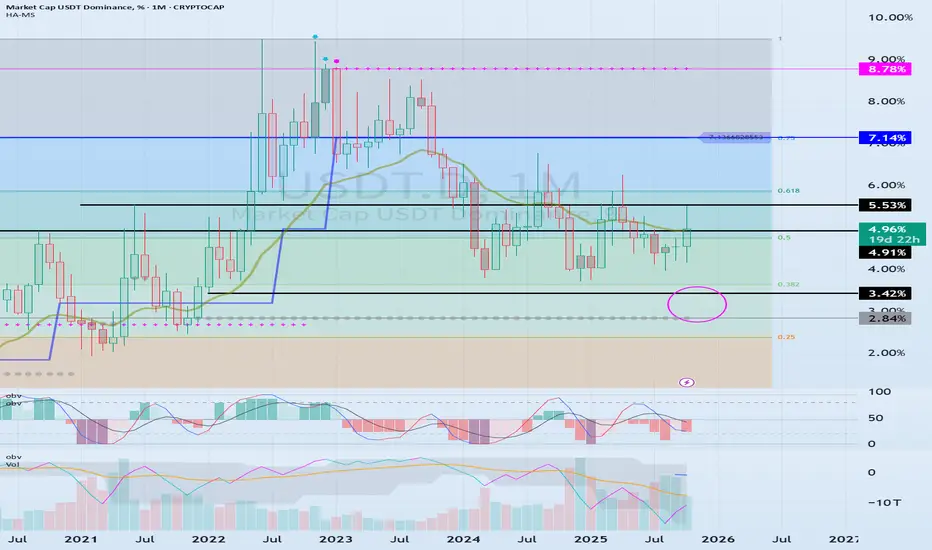
USDT Dominance - Weekly Chart Overview !!USDT Dominance - Weekly Chart Overview
Current Level: 4.88%
Trend Structure: The chart clearly forms an aspect ratio pattern, consisting of a series of lower highs and lower lows since mid-2022.
Ascending Telgero/Declining Channel - Continuous pressure is being displayed from the ascending Telgero.
1. Key Resistance Area (5.0%–5.2%)
USDT Dominant is currently undergoing a restart test of the ascending critical line, which has acted as strong resistance several times in the past.
Every time the price retests this trend line, it corrects – indicating a shift of funds from stablecoins to crypto assets.
If the price does not close above 5.2%, it could trigger the next bearish move to the downside.
2. Support Levels
First Support: Around 3.8% – a key chocolate demand area.
Key support zone: Between 2.0%-2.5% (green zone applied).
This level is typical of the Initial Petroleum Model and historically marks major crypto bull runs.
3. Uptrend Outlook
The large downward arrow on the chart indicates a continuation of the slope.
If dominance is below 3.8%, it could move towards the 2-2.5% zone, which indicates that traders are shifting investments from USDT to BTC and altcoins – a bullish trend for the crypto market.
This means that traders are selling crypto and holding stablecoins → risk-off, fear in the market.
When USDT dominance falls:
It means that money is flowing from stablecoins to BTC and altcoins → risk-off sentiment, confidence is returning.
DYOR | NFA
Plasma: A Fundamental and Technical Bet on Stablecoin PotentialToday we’re talking about Plasma, in my opinion the most interesting project in recent years. From a fundamental analysis perspective, it’s a must-have bet considering the potential of stablecoins in the near future and Tether’s involvement in the project. That said, from a technical analysis viewpoint, the price has bounced off the support created by Binance’s perpetual listing. I’d expect a quick acceleration toward $1.6, which is currently the most significant reversal point. At that moment, it will be crucial to see if the market is strong enough to break the all-time high and continue rising, or if the price will be rejected and fall back to the established support. In any case, the project has enormous potential, and at a $1 billion market cap, I believe it’s a great bet. Thanks to everyone for your attention.

ETH 2025 Price TargetBased on the chart structure and historical behavior, if we continue to move within a within a narrowing triangle, a strong breakout toward the 6K level seems very likely. You could even say it’s almost inevitable, but only if the Fed doesn’t inject new negative catalysts and capital doesn’t start exiting positions. Thanks to institutional investors steady accumulation, the 6K target remains highly probable.
Not financial advice.

USDT.DUSDT Dominance (4H) Analysis
After a strong upward move, USDT dominance is currently retracing from its recent high. The market shows signs of short-term correction, and I expect price to reach the following potential support levels:
4.71% – minor support, possible reaction zone.
4.60% – key short-term level; if broken, further downside likely.
4.50% – next significant support area.
4.43% – deeper correction target if bearish momentum continues.
If dominance holds above 4.60% and forms a bullish structure, we might see another leg up. Otherwise, continuation toward the lower levels seems likely.

Understanding the Money Flow in the Coin Market
Hello, fellow traders!
Follow me to get the latest information quickly.
Have a great day!
-------------------------------------
(USDT 1D Chart)
(USDC 1D Chart)
I believe that USDT and USDC show a gap up trend when funds flow into the coin market, and a gap down trend when funds flow out.
Therefore, unless the gap turns into a downtrend, the coin market is expected to maintain its upward trend.
-
(USDT.D 1D Chart)
(1M Chart)
As funds flow into and out of the coin market through USDT and USDC, USDT dominance is likely to ultimately rise.
However, I believe that the funds (USDT, USDC) flowing into the coin market will change dominance through trading.
In other words, if USDT dominance declines, the coin market is likely to trend upward.
This is because coins (tokens) are being purchased with USDT.
If USDT dominance remains below 4.91 or declines, the coin market is likely to trend upward.
Therefore, if USDT dominance rises without any evidence of fund outflows through USDT or USDC, it can be interpreted as a temporary increase in selling pressure.
If USDT or USDC gaps downward in this situation, the price will fail to defend, leading to a downward trend in the coin market.
Therefore, it's best to look at the USDT and USDT.D charts to understand the general flow of funds.
-
(BTC.D 1D chart)
(1M chart)
I believe BTC dominance reflects the relationship with altcoins, rather than the rise or fall of the coin market or the rise and fall of BTC itself.
In other words, rising BTC dominance indicates a concentration of funds toward BTC, increasing the likelihood that altcoins will gradually move sideways or experience a downward trend.
Therefore, for an altcoin bull market to begin, it must remain below 55.01-62.47 or show a downward trend.
Therefore, it is recommended to check BTC dominance before trading altcoins and develop a trading strategy.
--------------------------------------------------
Summary of the above:
For the coin market to continue its bull market,
1. USDT and USDC must maintain a gaping upward trend.
2. USDT dominance should decline below 4.91.
3. BTC dominance should decline below 55.01.
-
Thank you for reading.
I wish you successful trading.
--------------------------------------------------
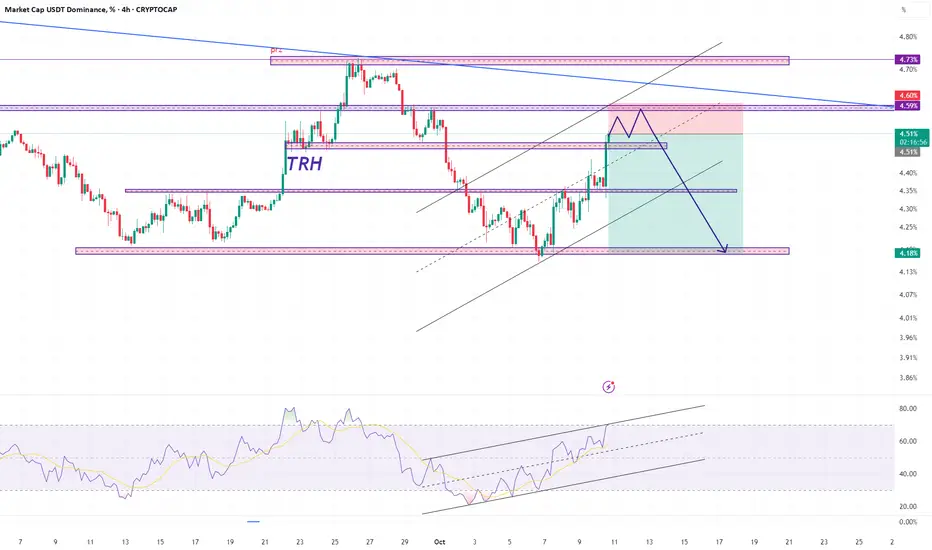
usdt.d 4hHello friends, I am Mehdi.
Given the area, we expect a price correction from this area trh.
Reasons:
We are in the area trh.
There is a possibility of approaching the channel ceiling and then correcting the price.
The resistance at 4.60 is a good place to buy.
I would like to thank you for supporting me by liking and commenting.
And please state your desired currency for analysis.
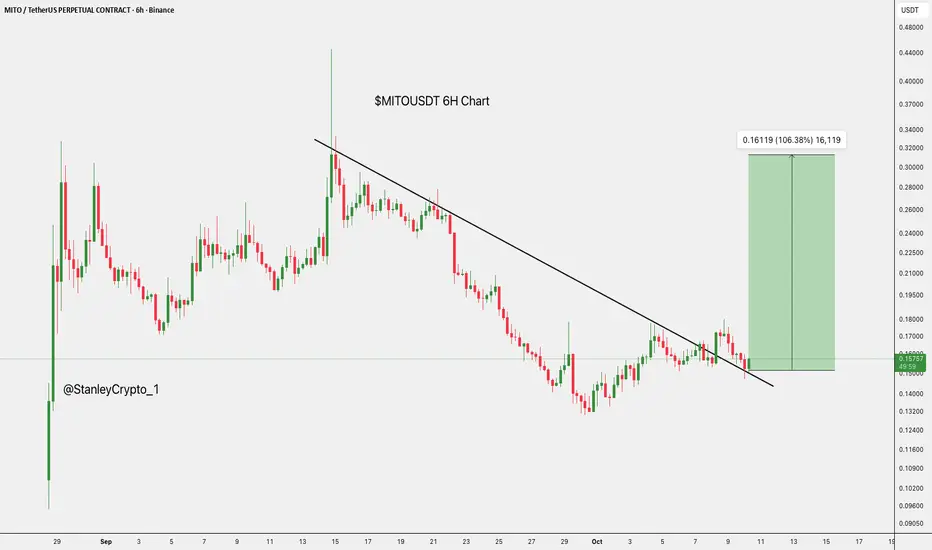
$MITO Breakout Alert: Bullish Reversal in Play.$MITO/USDT has broken above its downtrend line, hinting at a possible bullish reversal.
With momentum building, the price could target around $0.32654, a potential 100%+ gain from current levels near $0.15766.
DYOR, NFA
NEIRO Update📊 NEIRO Update
NEIRO is testing the red resistance zone 🔴
If it breaks out, the first target will be the green line level 🟢

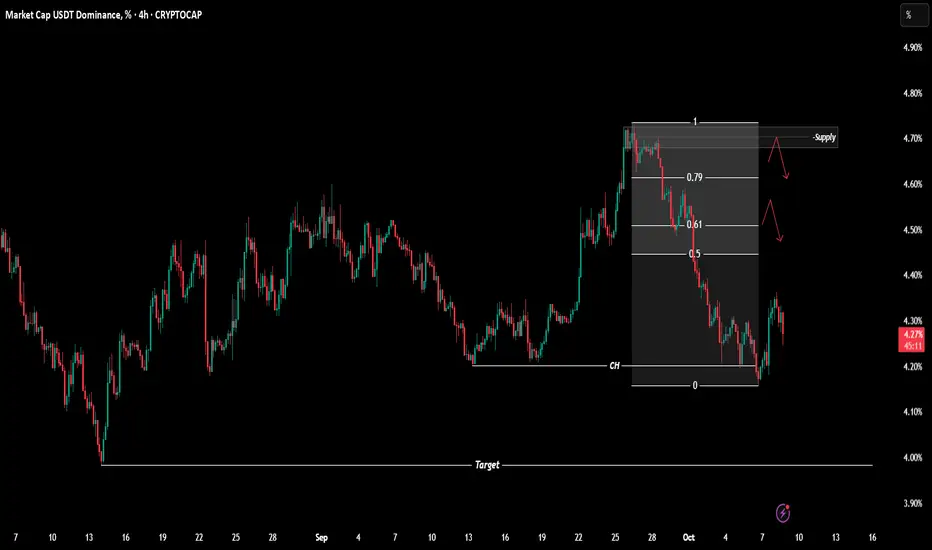
$USDT.D Analysis - Oct 8 | 4H Time FrameCRYPTOCAP:USDT.D Analysis - 4H
Hello and welcome to another analysis from the Satoshi Frame team!
I’m Abolfazl, and today we’re going to analyze Bitcoin on the 4-hour timeframe.
USDT dominance has shown a trend reversal on the 4-hour timeframe and has turned bearish.
The OTE zone and the marked supply area could act as potential rejection zones if dominance makes a short-term pullback upward.
On the other hand, we could also see another drop from the current level, moving toward the lower support area near the recent low.
The main target (4%) is already marked on the chart.
See you in the next analyses!
Stay tuned with the Satoshi Frame team...
THE LAST ALV CHART: Binance + Burning the Key — 2025 Will Be ...ALV/USDT Final Chart — The Golden Setup for 2025
After consistent daily updates, this could be the final and most powerful ALV chart leading into 2025.
There’s a strong probability that ALV will target $0.50 on its way toward a $1.70 high in 2025.
As long as the price remains well above the secure zone around $0.11, ALV stays technically bullish and positioned for another breakout — whether early or late in the next cycle. The setup is now confirmed for a solid swing trade into 2025.
There’s also growing speculation that Binance may list ALV, especially following the surge in Binance Alpha volume. Combined with the potential for the team to burn more token supply, the technicals and fundamentals align perfectly — making ALV one of the most promising breakout candidates for 2025.
🔥 ALV could truly be the golden chart of the year.

$SUSDT Breakout Alert: Bullish Reversal in Play.$S just broke out of a long falling wedge, signalling a possible bullish reversal.
MACD is turning positive, adding momentum to the move.
If price holds above the breakout zone, it could rally toward $0.8808, nearly 195% higher than current levels.
DYOR, NFA

USDT.D 4H Analysis - Key Triggers Ahead☃️ Welcome to the cryptos winter , I hope you’ve started your day well.
⏰ We’re analyzing USDT Dominance on the 4-Hour timeframe .
👀 On the 4-hour timeframe, USDT Dominance has started to recover after its recent drop, bouncing from the support zone at 4.17% and now moving upward, forming a reaction to the previous bearish leg. The structure shows a steep descending trendline, and once broken and confirmed above, dominance could move toward its next resistance zones and enter a correction phase relative to its previous leg. The key resistance levels to watch are 4.33% and 4.38%.
🧮 The RSI oscillator currently faces a static resistance around 45. If volatility pushes above this level and holds, it would confirm bullish momentum and act as a signal for correction continuation.
🕯 The recent candles on Tether Dominance have shown range-bound behavior with weakening bearish pressure, while the 4.17% support has attracted buyers — causing an increase in bullish candles and momentum toward upper resistance zones. A breakout above the descending trendline could confirm a corrective move upward, which seems quite plausible given the current 4H candle structure.
🧠 For profit-taking strategies, you may consider securing partial profits from your open long positions, or moving your stop-losses into profit to protect gains. Meanwhile, start refreshing your watchlist and identifying new price triggers so that you can re-enter positions after reaction or breakout confirmations from upcoming setups.
❤️ Disclaimer : This analysis is purely based on my personal opinion and I only trade if the stated triggers are activated .

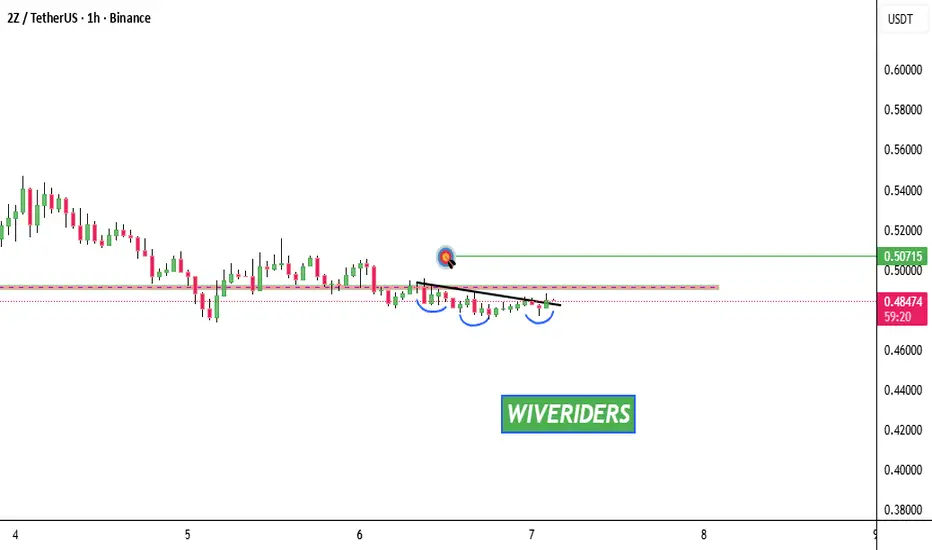
2Z Update📊 $2Z Update
$2Z is testing the red resistance zone 🔴
If it breaks out, the first target will be the green line level ✅