USDT Dominance USDT Dominance
Still trading inside a long-term descending channel
Price is at the upper trendline resistance (~6.3%)
Key support: 4.8–5.0%
Rejection from here → Liquidity rotates into BTC & Alts (Bullish)
Break & hold above resistance → Risk-off, alt pressure
👉 Watch rejection vs acceptance at this level
Patience over prediction 📊
DYOR | NFA
USDTRY

USDT Dominance (4H) Update. 📊 USDT Dominance (4H) Update.
Current Zone: ~6.30%
Key Resistance: 6.55% – 6.65%
Price is moving inside a descending channel, now reacting near the upper trendline.
Rejection from resistance ➝ USDT.D likely drops → Bullish for crypto / altcoins
Clean breakout & hold above 6.65% ➝ USDT.D strength → Risk-off / downside pressure on alts
At resistance + trendline = decision zone.
Wait for clear rejection or breakout confirmation.
⚠️ Manage risk. No prediction — only reaction.

DXY FRGNT WEEKLY CHART ANALYSIS - DXY Q3 W38 Y25🌍FRGNT WEEKLY CHART ANALYSIS - DXY Q3 W38 Y25
📊 DXY FRGNT Breakdown + Impact on GBP, EUR, and Cross Pairs
1. Higher Timeframe Context (Weekly)
Trend: Bearish → clear lower highs & lower lows since mid-summer.
Unmitigated Imbalance (IMB): 99–101 zone above current price → acts as a long-term liquidity magnet but not yet tested.
Bias: Weakness dominates until price proves otherwise.
2. Daily Timeframe
Supply Zone: 98.200–98.500 (aligns with Daily 50 EMA).
Demand Zone: 96.800–97.000 (next liquidity draw).
Expectation: Retrace into 98.2 supply, then continuation lower toward 97.0 demand.
3. Intraday (4H)
Supply Overlap: 97.800–98.200 (Daily + 4H confluence).
Structure: Still bearish, repeated rejections from the 50 EMA.
Projection: Price likely taps 98.0 area, then drives into 97.0 demand.
Summary
Bias: Bearish.
Watch for liquidity sweep above 98.0 → rejection → sell setups toward 97.0 demand.
🌍 Impact on GBP, EUR, and Cross Pairs
GBPUSD
Effect: Dollar weakness supports bullish setups.
Expect retrace into 1.2670–1.2720 demand before price extends higher.
Targets: 1.2800–1.2850, with potential stretch toward 1.2950.
Narrative: As long as DXY stays capped under 98.2, GBPUSD should continue higher.
EURUSD
Effect: Also benefits from USD weakness, though less aggressively than GBP.
Look for longs around 1.0850–1.0880 demand.
Targets: 1.0950–1.1000.
Narrative: Similar structure to GBPUSD, but GBP is likely to outperform EUR.
EURGBP
Effect: GBP stronger than EUR → bearish bias.
Shorts valid below 0.8520, aiming for liquidity under 0.8430–0.8450.
Narrative: Even if both EUR and GBP rise against USD, GBP is leading.
Other USD Cross Pairs
USDJPY: Likely to weaken, targeting 144.50–145.00 liquidity.
USDCAD: Bearish pressure, could reach 1.3600 demand.
USDCHF: Lower toward 0.8850–0.8900 demand.
✅ Overall Picture
DXY Bearish = Favor longs on GBPUSD & EURUSD.
GBP stronger than EUR = EURGBP shorts are attractive.
JPY & CHF weak = Pairs like GBPJPY and EURJPY can push higher.
👉 In short: DXY’s weakness is the engine, driving GBPUSD and EURUSD higher. The Pound has the edge, making EURGBP a sell candidate while GBPJPY becomes a standout buy.
TVC:DXY
FRGNT

Global IPO & SME IPO TrendsIntroduction
Initial Public Offerings (IPOs) have always been a symbol of ambition, growth, and transformation. They represent the moment when a company decides to move beyond private ownership and open its doors to the public capital markets. IPOs not only provide companies with capital for expansion but also give investors an opportunity to participate in wealth creation.
Over the last few decades, IPOs have evolved significantly, shaped by globalization, technological change, regulatory reforms, and shifting investor behavior. In addition to traditional large-cap IPOs, the rise of Small and Medium Enterprise (SME) IPOs has been a defining trend in recent years, especially in developing markets like India, Southeast Asia, and parts of Africa.
This paper explores global IPO trends and SME IPO dynamics, examining how the landscape has transformed, the challenges and opportunities it presents, and what the future holds.
Part I: The Global IPO Landscape
1. Historical Overview
Early IPOs: The concept of public share issuance dates back to the 1600s with the Dutch East India Company, which allowed investors to buy shares in overseas trade.
20th Century Boom: IPOs became mainstream in the U.S. and Europe during the industrial boom, with companies in oil, steel, and manufacturing driving listings.
Dot-Com Bubble (1990s-2000s): Technology IPOs surged in the late 1990s, many without strong fundamentals, leading to the dot-com crash in 2000.
Post-2008 Era: After the global financial crisis, IPO markets slowed but revived with technology giants like Facebook, Alibaba, and Uber entering the public space.
2. Regional IPO Hotspots
United States: Still the largest IPO market by value. Nasdaq and NYSE dominate global tech and unicorn listings.
China & Hong Kong: Became global leaders in IPO volumes, especially in technology, fintech, and manufacturing. Hong Kong has been a preferred listing destination for Chinese firms.
Europe: More selective, with strong activity in London, Frankfurt, and Amsterdam.
India: A rising star, with both large-cap IPOs and booming SME IPOs. Retail participation is strong.
Middle East: Saudi Arabia’s Aramco IPO (2019) became the world’s largest, showing the region’s growing importance.
3. Global IPO Trends in Numbers
IPO activity tends to move in cycles, often tied to macroeconomic conditions, liquidity availability, and investor sentiment.
2020-2021: Record IPO activity, fueled by low interest rates, stimulus-driven liquidity, and tech growth during COVID-19.
2022-2023: IPO slowdown due to inflation, interest rate hikes, and geopolitical tensions (Ukraine war, US-China rivalry).
2024-2025: Signs of revival, with AI, EV, renewable energy, and fintech companies leading the pipeline.
Part II: Factors Shaping IPO Markets
1. Macroeconomic Environment
Interest Rates: Low rates encourage risk-taking and IPOs; high rates deter them.
Liquidity: Abundant global liquidity fuels IPO demand.
Geopolitics: Wars, trade disputes, and regulatory crackdowns influence cross-border IPOs.
2. Sectoral Trends
Technology: AI, semiconductors, SaaS, and fintech dominate listings.
Green Energy: EVs, solar, wind, and hydrogen IPOs attract ESG-focused investors.
Healthcare & Biotech: Rising due to pandemic learnings and aging populations.
Consumer & Retail: Still strong, but facing disruptions from e-commerce.
3. Regulatory Environment
The U.S. SEC, Europe’s ESMA, and Asian regulators have tightened disclosure norms.
China has restricted overseas listings of sensitive tech companies.
India’s SEBI has become stricter but supportive of SME and tech listings.
Part III: Rise of SME IPOs
1. Why SME IPOs Matter
SMEs are the backbone of most economies, contributing 30–60% of GDP in many countries.
Access to capital markets allows SMEs to reduce dependence on banks and private equity.
SME IPOs democratize wealth creation by involving retail investors.
2. India as a Case Study
India has emerged as a global leader in SME IPOs.
Platforms like NSE Emerge and BSE SME Exchange have hosted hundreds of SME listings.
Retail investors flock to SME IPOs due to small ticket sizes and potential for multi-bagger returns.
In 2023–2025, SME IPOs in India often delivered stronger short-term gains than large IPOs.
3. Global SME IPO Landscape
China: Has STAR Market for tech-driven SMEs.
Europe: AIM (Alternative Investment Market) in London supports SME listings.
U.S.: Nasdaq SmallCap and OTC markets exist, but venture capital dominates.
Africa & Middle East: Nascent SME IPO frameworks are being developed.
4. Key Challenges
Liquidity Issues: SME IPOs often face thin trading volumes.
Governance: Risk of weak disclosure and manipulation.
Investor Education: Retail investors sometimes underestimate risks.
Part IV: Investor Behavior & Market Psychology
1. Institutional vs Retail Investors
Institutional investors dominate large-cap IPOs.
Retail investors are increasingly active in SME IPOs.
Behavioral biases — such as FOMO (Fear of Missing Out) — drive oversubscriptions.
2. IPO Pricing & Valuation Dynamics
Companies often price aggressively, leading to mixed post-listing performance.
The “listing pop” culture attracts traders seeking quick gains.
3. The Role of Anchor Investors
Anchor investors provide credibility to IPOs and influence demand.
Part V: Risks and Challenges in IPO Markets
Volatility: IPOs are highly sensitive to market sentiment.
Regulatory Crackdowns: Sudden changes (like China’s tech crackdown) disrupt IPO pipelines.
Post-IPO Underperformance: Many IPOs fail to sustain valuations beyond the first year.
Speculative Bubbles: Retail-driven hype can inflate SME valuations unsustainably.
Part VI: The Future of IPOs & SME IPOs
1. Technology’s Role
Digital Platforms: E-IPO applications and online brokerages increase retail participation.
Blockchain & Tokenized IPOs: A possible future trend where companies raise funds via tokenized shares.
AI in Valuation: Algorithms now play a role in IPO pricing and demand analysis.
2. ESG & Sustainable Finance
Investors increasingly prefer companies with Environmental, Social, and Governance (ESG) credentials.
Green IPOs (renewable energy, EV, sustainability tech) will dominate.
3. Globalization vs Protectionism
While globalization pushes for cross-border listings, geopolitics may encourage companies to list domestically.
India, China, and Middle East will become more self-reliant IPO hubs.
4. SME IPOs Outlook
SME IPOs will expand rapidly in Asia and Africa, where small businesses dominate.
Regulatory reforms and investor education will decide sustainability.
Conclusion
The global IPO market is a mirror of the world economy, reflecting growth cycles, technological revolutions, and investor sentiment. While traditional large-cap IPOs continue to capture headlines, the rise of SME IPOs represents a deeper democratization of finance.
SMEs, once constrained by limited access to capital, are now using public markets to scale up, attract visibility, and create wealth for investors. Markets like India, China, and the Middle East are emerging as epicenters of SME IPO growth, while the U.S. and Europe remain leaders in large-cap listings.
Going forward, IPO trends will be shaped by AI, ESG, fintech innovations, and shifting geopolitics. Investors and regulators must balance opportunity with caution, especially in SME IPOs where risks are higher but so are the rewards.
In short, IPOs — both global and SME-focused — will continue to remain a critical engine of capital formation, innovation funding, and wealth creation in the evolving global economy.
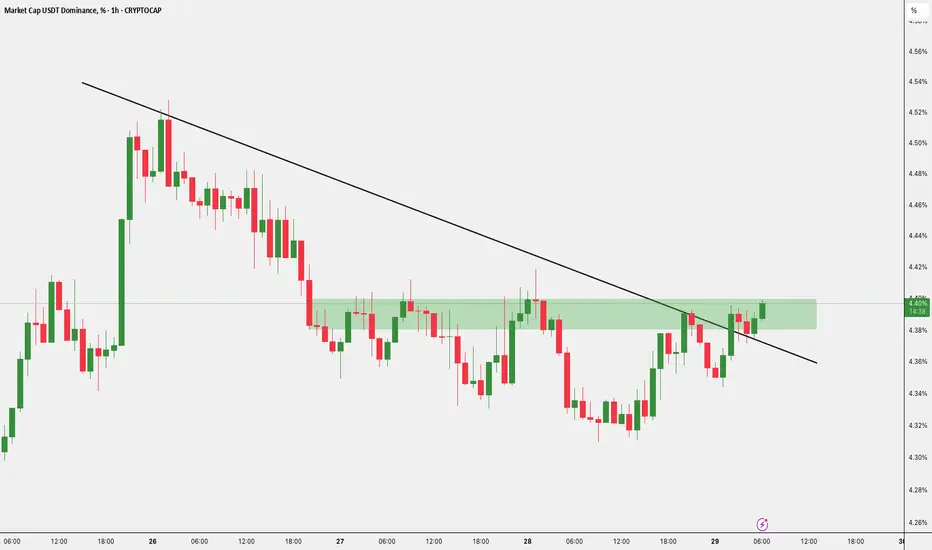
$USDT Dominance Is Knocking Breakout or Rejection Ahead?CRYPTOCAP:USDT 👀 dominance is knocking on the 4.40% level. If it breaks through, alts might feel some pressure.
But if it gets rejected, we could see a nice relief bounce for altcoins.
DYOR, NFA
US Federal Reserve & Central Bank Policies1. Introduction
Every economy in the world runs on money – but money is not just about paper notes or coins. Behind every financial system stands a central authority that manages the flow of money, credit, and liquidity. In the United States, that authority is the Federal Reserve System, commonly known as “The Fed.”
The Federal Reserve doesn’t just print money – it plays a much bigger role. It manages interest rates, regulates banks, provides stability during crises, and sets the overall monetary policy that affects the stock market, bond market, inflation, employment, housing, and even global trade.
To truly understand the global economy, traders, investors, and policymakers must understand how the Federal Reserve works and what central bank policies mean.
2. The Birth of the Federal Reserve
Before the Fed was established in 1913, the U.S. economy was chaotic. The country suffered repeated banking panics in the late 1800s and early 1900s. Banks failed often, depositors lost money, and there was no central authority to stabilize markets during crises.
The panic of 1907 became the turning point. With no central bank, private financiers like J.P. Morgan personally organized rescues for failing banks. This made it clear that America needed a central institution.
Thus, in December 1913, Congress passed the Federal Reserve Act, creating the Federal Reserve System. Its goals were:
Provide stability to the banking system
Act as a “lender of last resort”
Manage monetary policy to prevent panics
Support sustainable economic growth
3. Structure of the Federal Reserve
The Fed is not a single building or a single person. It’s a networked system designed to balance independence with government oversight.
The Main Parts:
Board of Governors – Based in Washington D.C., made up of 7 members appointed by the U.S. President. They guide overall policy.
Federal Reserve Banks – 12 regional banks across major U.S. cities (like New York, Chicago, San Francisco). They implement policies and interact with commercial banks.
Federal Open Market Committee (FOMC) – The most important decision-making body for monetary policy, particularly interest rates.
Member Banks – Thousands of commercial banks that hold reserves with the Fed and borrow when needed.
This system ensures checks and balances: the Fed is independent in decision-making but still accountable to Congress and the public.
4. Objectives of the Federal Reserve (Dual Mandate)
Unlike many central banks that focus only on inflation, the Federal Reserve has a dual mandate:
Price Stability – Keep inflation under control (not too high, not too low).
Maximum Employment – Ensure that as many people as possible have jobs in a healthy economy.
Additionally, financial stability and moderate long-term interest rates are also implicit goals.
5. Tools of the Federal Reserve
The Fed has several powerful tools to shape the economy:
(A) Monetary Policy Tools
Open Market Operations (OMO) – Buying and selling U.S. government securities (like Treasury bonds) to control money supply.
Buying securities → injects money → lowers interest rates → boosts growth.
Selling securities → absorbs money → raises interest rates → slows inflation.
Federal Funds Rate (Interest Rate Policy)
The Fed sets a target for the rate banks charge each other for overnight loans.
Lowering rates → cheaper borrowing → more spending & investing.
Raising rates → expensive borrowing → cooling the economy.
Reserve Requirements
The percentage of deposits banks must keep as reserves. Lower requirements → more lending. Higher requirements → less lending.
Rarely used today, as OMO and interest rates are more effective.
Discount Rate
The interest rate charged when commercial banks borrow directly from the Fed.
(B) Unconventional Tools (Used in Crises)
Quantitative Easing (QE) – Large-scale purchase of government bonds or mortgage-backed securities to inject liquidity (used after the 2008 crisis and COVID-19).
Forward Guidance – Communicating future policy intentions to influence market expectations.
Emergency Lending Programs – Special facilities to rescue banks, companies, or markets (example: COVID-19 corporate bond buying programs).
6. How Fed Policies Influence the Economy
The chain of influence looks like this:
Fed Actions → Interest Rates & Liquidity → Consumer & Business Borrowing → Investment & Spending → Employment & Inflation → Stock & Bond Markets → Overall Economy
Example:
If inflation is too high, the Fed raises rates → mortgages, car loans, business loans become expensive → spending falls → demand cools → inflation comes down.
If unemployment is high, the Fed cuts rates → cheaper credit → businesses expand → jobs increase.
7. Historical Policy Examples
(A) Great Depression (1930s)
The Fed failed to act aggressively, allowing banks to collapse.
Lesson: Central banks must act as lenders of last resort in crises.
(B) 1970s Inflation
Inflation reached double digits due to oil shocks and loose policy.
Fed Chair Paul Volcker (1979–1987) raised interest rates dramatically, even up to 20%, to crush inflation.
Short-term pain but long-term stability.
(C) 2008 Financial Crisis
Housing bubble burst, banks collapsed (Lehman Brothers).
Fed slashed rates to near 0%, launched QE worth trillions, and bailed out the system.
Critics said it encouraged risk-taking, but it prevented a depression.
(D) COVID-19 Pandemic (2020)
Fed cut rates to 0%, launched unlimited QE, provided emergency loans, and stabilized global dollar liquidity.
Prevented a financial collapse during lockdowns.
8. Impact on Global Markets
The Federal Reserve’s policies don’t just affect the U.S.—they impact the entire world because:
The U.S. dollar is the global reserve currency.
Most international trade, commodities (like oil), and debt are priced in dollars.
When the Fed raises rates, capital flows back to the U.S., causing emerging markets to suffer currency weakness and capital outflows.
When the Fed cuts rates, global liquidity rises, and risk assets (stocks, crypto, real estate) boom worldwide.
This is why traders globally watch every FOMC meeting, speech, and policy announcement.
9. Criticisms & Challenges of the Fed
While the Fed is powerful, it faces criticism:
Too much influence on markets – Investors often say markets are addicted to “easy money.”
Delay in action – Policies work with a time lag, so the Fed sometimes reacts late.
Political pressures – Even though independent, Presidents often criticize Fed decisions.
Income inequality – QE and asset purchases often benefit wealthy investors more than ordinary citizens.
Global ripple effects – Rate hikes in the U.S. can trigger crises in developing nations.
10. The Future of Central Bank Policies
As economies evolve, central banks face new challenges:
Digital Currencies (CBDCs) – The Fed is studying a “digital dollar.”
Climate Risks – Some argue central banks should consider environmental stability.
Geopolitical Pressures – Sanctions, trade wars, and global fragmentation may test Fed policy.
Technology & AI – Data-driven finance could change how monetary policy is transmitted.
Conclusion
The U.S. Federal Reserve is not just an American institution – it’s a global financial powerhouse. Its policies affect inflation, jobs, housing, stock markets, currencies, and even geopolitics.
Understanding the Fed means understanding how money moves, how economies grow or shrink, and how financial markets react.
For traders and investors, following Fed decisions is as important as tracking company earnings or global news. Every rate hike, cut, or policy signal from the Fed sends ripples across the world’s financial oceans.
In short, the Federal Reserve is like the captain of the world’s financial ship – sometimes steering smoothly, sometimes making hard turns, but always holding the power to influence the course of global markets.

THE RESULTTHE RESULT
Follow for more Simple And accurate swing analysis on Indices, Currency, Commodities.

USDTRY Cooling After Spike – Where to Next? The Turkish Lira story continues—this time through the lens of USDTRY , which has been rising relentlessly and just recently showed signs of exhaustion after tagging highs near 38.95 .
🧭 As seen on the chart, after months of controlled climbing within a broad ascending channel, the pair is now pausing. We may finally be witnessing the beginning of a retracement. Key downside targets have now emerged:
• 33.77 – First area of interest
• 27.99 – Mid-level retracement
• 22.65 – Deep support within the channel
These aren't random numbers—they align beautifully with the multi-year channel and prior volatility zones.
📌 Let's not forget, this journey began with a “New Volatility Alert” back in late 2021, and ever since, the USDTRY has mostly respected structural moves. With the Euro pair also showing signs of topping , this could be the dollar’s turn to cool off against the Lira.
📰 Contextual Fuel:
• Turkey’s central bank raised rates to 46% in April—one of the most aggressive tightening moves globally.
• Over $25B in FX reserves have been used to stabilize the Lira, as inflation forecasts surge past 29.75% for year-end 2025.
• Political volatility and macro risks remain, but short-term speculative flows could now reverse.
🚨 Takeaway:
Just like EURTRY, the USDTRY may have finally found its ceiling for now. Traders should monitor price action near 38–39 for possible bearish continuation signs.
There’s a decent chance that the Lira gains ground in the short to medium term—technical and macro forces now point to consolidation or reversal.
One Love,
The FXPROFESSOR 💙
EURTRY Chart:

USDTRY: 6.8 | SHORT 5k Pips | LONG 38k Pipsbuilding a SHORT position for the SHAKEDOWN
and BASE BUILDING towards 10.0 levels
-
#LongShort
===
Fundamentals:
it takes 20years to settle debt or unfinished obligations by a company country and aliens...
til then.. its currency be it fiat land or spirit is devalued as form of compensation
in layman; a person heavily in debt lacks BARGAINING POWER over MAJOR folks
-
see Germany's recovery

Is Erdogan’s Gambit Destabilizing Turkey’s Future?Erdogan’s administration continues to engage in high-stakes geopolitical maneuvers by maintaining direct and indirect ties with groups designated as terrorist organizations. His government’s strategic alliances, notably with Hayat Tahrir al-Sham (HTS), serve immediate military and political goals in Syria, despite significant international controversy and longstanding terrorist designations by the U.S. and other global actors.
This risky strategy has had a pronounced impact on the Turkish economy. Investors have increasingly shifted their capital from the Turkish Lira to the U.S. dollar, leading to a notable rise in the USD/TRY rate. Fears of further economic isolation and the looming threat of sanctions—which could cut off Turkey from critical European banking and trade services—have only intensified market instability.
The growing strains within NATO and shifting regional alliances are compounding these economic challenges. Erdogan’s pragmatic yet contentious foreign policy raises serious questions about Turkey’s future role within the alliance, as Western partners deliberate potential sanctions and other measures. Meanwhile, evolving dynamics with regional powers such as Russia and Iran add further uncertainty to Turkey’s strategic position and economic prospects.

USDT.D 3DUSDT.D ~ 3D Analysis
#USDT.D The movement we expect,. There is still an opportunity for further increase for Crypto, if USDT.D starts down. The dominance of the USDT dropped, meaning that more USDT was exchanged for Crypto.

USDT Dominance Weekly Chart Analysis !!The chart shows USDTDominance in the Ukrainian market for several years, indicating distinct trends and patterns.
Trend Line Support:
A visible upward significant line has been established since 2021. This suggests a fundamental base level from which USDT dominance has historically bounced back.
Heads & Shoulders Pattern:
The chart item includes the Heads & Shoulders number, indicating a bearish reversal pattern. This means the upward momentum may slow down, and a downward shift may occur.
Current Dominance Level:
The current level of around 4.53% is significant. A break below this level and a decline may occur, possibly targeting the projected supported area around 2.00% in the long term.
Take a look at the support and resistance separation on the chart. The interaction between Trend Travelers and Heads & Shoulders Trend Travelers will be important in predicting the future of USDT dominance. Anticipating a downward movement may be prudent,
If you found this analysis helpful, hit the Like button and share your thoughts or questions in the comments below. Your feedback matters!
Thanks for your support!
DYOR. NFA

USDTDOMINANCE CHART UPDATE !The chart highlights USDT dominance (USDT.D), which is used to measure market sentiment and money flow into or out of stablecoins such as USDT
The chart shows a completed “head and shoulders” pattern, which is often considered bearish in technical analysis.
The neckline has been broken, indicating the possibility of further declines.
The price appears to be testing a descending triangle, which could indicate a continuation of the decline.
The green area below (possibly around 2.5%-3%) could act as a crucial support if dominance continues to decline.
The 50-day (red) and 200-day (green) moving averages are plotted.
Dominance is trading below both moving averages, which reinforces bearish momentum.
A breakdown of the current triangle could lead to further declines towards the marked support area.
If you found this analysis helpful, hit the Like button and share your thoughts or questions in the comments below. Your feedback matters!
Thanks for your support!
DYOR. NFA

Can Turkey's Lira Dance with the Dollar?Turkey stands at a pivotal moment in its economic journey, navigating through the complexities of fiscal management and monetary policy to stabilize the Turkish Lira against the US Dollar. The nation has embarked on a strategic pivot towards domestic funding, significantly increasing the issuance of Turkish Government Bonds to manage soaring inflation and debt service costs. This approach, while stabilizing in relative terms, challenges Turkey to balance between stimulating growth and controlling inflation, a dance that requires both precision and foresight.
The Central Bank of Turkey's decision to cut rates amidst rising inflation paints a picture of calculated risk and strategic optimism. The bank is threading a needle between fostering economic activity and maintaining price stability by targeting a reduction in inflation over the medium term while allowing short-term increases. This policy shift, coupled with a focus on local funding, not only aims to reduce external vulnerabilities but also tests the resilience of Turkey's economy against global economic currents, including the impact of international political changes like the US election.
Globally, the economic landscape is fraught with uncertainties, and Turkey's strategy of maintaining a stable credit rating while forecasting a decrease in inflation sets an intriguing stage. The country's ability to attract investment while managing its debt profile, especially in light of global monetary policy shifts by major players like the Federal Reserve and the ECB, will be a testament to its economic stewardship. This narrative invites readers to delve deeper into how Turkey might leverage its economic policies to not only survive but thrive in a fluctuating global market.
The enigma of the USD/TRY exchange rate thus becomes a compelling study of economic strategy, where every policy decision is a move in a larger game of financial chess. Turkey's attempt to balance its books while dancing with the dollar challenges conventional economic wisdom and invites observers to ponder: Can a nation truly master its currency's fate in the global marketplace?

USDT.D Update. USDT dominance (USDT.D) appears to form a descending triangle or wedge pattern, with two converging trendlines indicating a potential breakdown.
The upper trendline is descending, indicating consecutive lower highs.
The lower trendline is relatively flat, but rising slightly.
USDT.D is approaching the lower trendline, indicating potential support.
The path drawn indicates a potential breakdown below the lower trendline.
Downward continuation is anticipated in the orange zone (3.40%–3.10%).
Resistance: ~4.20%
Support: ~3.90% and orange zone around 3.40%–3.10%
If USDT dominance falls, it usually suggests that traders move capital from stablecoins (USDT) to riskier assets like Bitcoin or altcoins, indicating a potential bullish sentiment in the broader crypto market.
Let me know if you’d like further assistance or adjustments!
DYOR. NFA

USDT MOON- Do you know what happens when something push too much ? it reverses and goes down.
- Sir Fibonacci said one day :
" When u launch a coin to the sky, it takes speed, then it stops, then it goes down more fast than it went up "
- if USDT grab more Dominance on Cryptos Markets, it would mean we are rolling back in the "Old Financial system" i hope everyone understand that.
- That's not gonna happens.
- i won't comments much on this analysis, but it speaks by itself. ( everything is in the graphic )
- i won't also speak about what happened recently to UST in Luna Ecosystem because it's sad for the peoples.
- Stay in BTC and pray TheKing.
Happy Tr4ding !

When Do Breaking ATMs Signal More Than Just Technical Failure?In a fascinating twist of economic irony, Turkey's banking system faces a crisis not from a shortage of money, but from an overwhelming abundance of near-worthless banknotes. This peculiar situation, where ATMs physically break down from dispensing too many low-value bills, serves as a powerful metaphor for the broader economic challenges facing emerging markets in an era of hyperinflation.
The numbers tell an extraordinary tale: a 700% currency depreciation since 2018, 80% of circulating notes being the highest denomination available, and a stark disparity between official inflation rates of 49% and independent estimates of 89%. Yet perhaps most intriguing is the government's reluctance to print larger denominations – a psychological barrier rooted in the traumatic memory of million-lira notes from the 1990s. This resistance to adaptation, despite the obvious operational strain on the banking system, raises profound questions about the role of political psychology in economic policy-making.
What emerges is a complex narrative about the intersection of technological capacity, monetary policy, and human psychology. As Turkish banks spend entire days counting money for simple transactions and regulators continuously delay implementing hyperinflationary accounting standards, we witness a unique case study of how modern financial systems can be overwhelmed not by sophisticated cyber threats or market crashes, but by the sheer physical weight of devalued currency. This situation challenges our traditional understanding of banking crises and forces us to reconsider the practical limits of monetary policy in an increasingly digital age.

USDTRY Approaching the top of the Channel Up.The USDTRY pair has been trading within a 6-month Channel Up and the price is now very close to the pattern's top (Higher Highs trend-line). Technically this is were a rejection should take place to reset the market at the pattern's bottom (Higher Lows trend-line), below the 1D MA50 (blue trend-line). Our Target is 33.4000, which is just above the 0.5 Fibonacci retracement level, where the last correction bottomed.
-------------------------------------------------------------------------------
** Please LIKE 👍, FOLLOW ✅, SHARE 🙌 and COMMENT ✍ if you enjoy this idea! Also share your ideas and charts in the comments section below! This is best way to keep it relevant, support us, keep the content here free and allow the idea to reach as many people as possible. **
-------------------------------------------------------------------------------
💸💸💸💸💸💸
👇 👇 👇 👇 👇 👇

Shift in Carry Trades: Hedge Funds Embrace USDTRYA Shift in Carry Trades: Hedge Funds Embrace the US Dollar
The once-dominant Japanese yen has historically been the preferred currency for carry trade strategies, where investors borrow low-interest-rate currencies to invest in higher-yielding ones. However, a significant shift is underway, as hedge funds increasingly turn to the US dollar as their borrowing currency. This strategic change is driven by a confluence of factors, including the US Federal Reserve's monetary policy stance, the weakening Japanese yen, and the allure of emerging-market currencies.
The Allure of Emerging-Market Currencies
Emerging-market currencies have long been a focal point for carry trade strategies, offering the potential for substantial returns. The relatively high interest rates in these economies, coupled with their often-growing economies, make them attractive investment destinations. However, the choice of borrowing currency plays a crucial role in determining the overall risk-reward profile of such trades.
The Yen's Diminishing Appeal
The Japanese yen has traditionally been a popular choice for carry trades due to its historically low interest rates. However, a combination of factors has eroded its appeal in recent years. The Bank of Japan's ultra-loose monetary policy, aimed at stimulating the economy, has kept interest rates exceptionally low. Moreover, the yen's weakness against other major currencies has increased the risk of exchange rate losses for investors who borrow in yen.
The Rise of the US Dollar
The US dollar, once a less common choice for carry trades, has gained prominence as a borrowing currency. Several factors have contributed to this shift. First, the US Federal Reserve's more hawkish monetary policy, characterized by interest rate hikes and a reduction in quantitative easing, has made the dollar a relatively higher-yielding currency. Second, the dollar's strength against other major currencies has reduced the risk of exchange rate losses for investors who borrow in dollars.
The Case of USDTRY
One notable example of the shift towards US dollar-funded carry trades is the USDTRY pair. The Turkish lira, with its relatively high interest rates, has been a popular target for carry trade investors. However, the increasing political and economic uncertainties in Turkey have made the lira a riskier investment. By borrowing in US dollars, investors can potentially benefit from the interest rate differential while mitigating some of the risks associated with the Turkish lira.
Challenges and Considerations
While the US dollar-funded carry trades offer potential benefits, they are not without risks. The US Federal Reserve's future monetary policy decisions, geopolitical events, and economic fluctuations in emerging markets can all impact the profitability of these trades. Additionally, the increasing popularity of carry trade strategies can lead to market volatility and potential
reversals.
Conclusion
The shift in carry trade strategies from the Japanese yen to the US dollar represents a significant development in the global financial markets. As emerging-market currencies continue to offer attractive investment opportunities, the choice of borrowing currency will remain a critical consideration for hedge funds and other investors seeking to capitalize on these trends. While the US dollar has gained prominence, the potential risks and challenges associated with carry trades should be carefully evaluated before making investment decisions.

USDT Dominance (USDT.D) Short Update. USDT dominance is currently trading within a symmetrical triangle formation. The price has been recently rejected at the Ichimoku Cloud resistance level, leading to a slight pullback. However, the 200-day moving average (200MA) remains a key support level beneath the current price, suggesting the potential for a bounce if the price reaches this area.
If USDTD breaks below the 200MA, this could indicate a decline in dominance, which may lead to an upward movement in the broader cryptocurrency market. Traders should keep a close eye on these technical levels to anticipate a possible breakout or breakdown, which could provide insight into the next significant market move.
Stay vigilant and adjust your strategies according to these key technical indicators.
Remember: This is not financial advice. Stay tuned to us for further updates and analysis. Thank you!

USDTRY Inflationary uptrend still intact but buy on the right leThe USDTRY pair has almost doubled since our last buy signal (October 27 2022, see chart below):
This pair remains one of the most efficient long-term trades long-term as its inflationary uptrend remains intact. We won't turn buyers again however before a 1W MA50 (blue trend-line) test or a neutral 1W RSI (less than 50.00). Our next Target is 40.0000 (again on the 10-year Higher Highs trend-line).
-------------------------------------------------------------------------------
** Please LIKE 👍, FOLLOW ✅, SHARE 🙌 and COMMENT ✍ if you enjoy this idea! Also share your ideas and charts in the comments section below! This is best way to keep it relevant, support us, keep the content here free and allow the idea to reach as many people as possible. **
-------------------------------------------------------------------------------
💸💸💸💸💸💸
👇 👇 👇 👇 👇 👇

Welcome to another debt crisis in economic history 8!It's been a while since I tracked the #usdtry pair. For comparison, you can find my past reviews below.
Concerns over
- high inflation rate
- low interest rates compared to the sidereal inflation rate (enag)
- high levels of debt
- external financing needs
- geopolitical tensions
- high-level gov. corruption
- pressure on the parity by carry trade
imo the parity should stabilize around 55-65 until the end of the year.

Frontusdt UpdateFrontusdt is making symmetrical triangle in case of successful breakout we are expecting a bullish move of 40% in coming days
