SPX - Weekend look.Hello,
here are the two most likely harmonic patterns of influence for the bulls, and bears.
Yellow has an initial fit in the lighter trace, transposed directly to match the recent moves, in darker yellow. Is this an indicator that the regular level behavior patterns have failed, or do we expect abrupt level shifts between regularly adjacent arguments?
What's your fav color? Yellow or Purple? Comments below, and follow along for the ride!!!
Good Luck, God Speed, Love & Lights tot All!
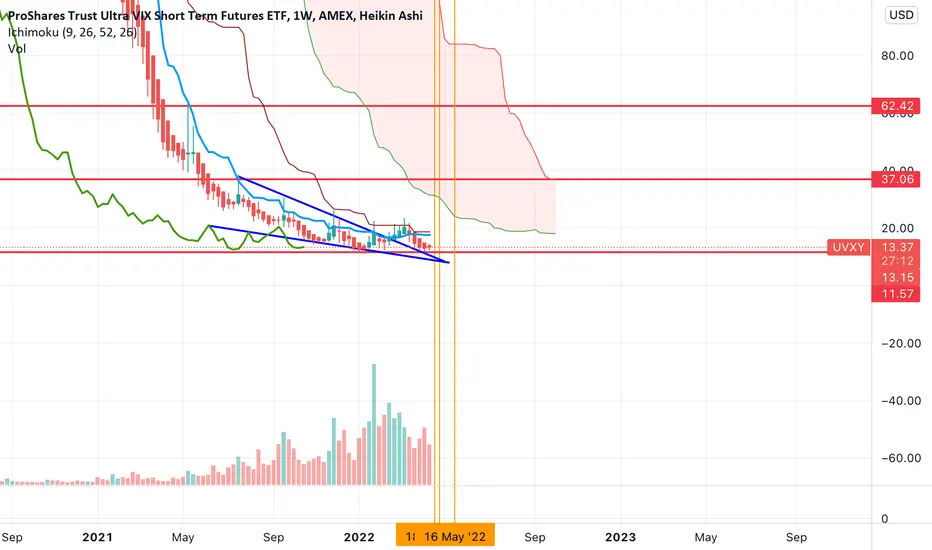
UVXY

Volatility / SPX forecastHello,
This pink trace is a nice spacial match for the vix, and it correlates with a nice match on the ES1 (SP500). Ill post a screen shot of that below.
Here’s what is interesting to me… this pink trace came from a position of lower lows… and we just printed a higher low… hmmm. That seems up for volatility of it holds.
Also…. The section of horizontal projections, breaking small support layer Jan 5th is my match for the ES1… but the pattern it just did has way higher magnitude within its level. Looks like 3 M shaped monsters flying horizontal… any how… it may be prudent to amplify the vertical scale of the projection in order to match that recent level amplitude.
Follow me.
Good Luck, God Speed, Love & Light to All!

i wouldnt try to long vix right now even if were in a bear mark volatility is doing something interesting. after a failed breakout, it has consolidated and found weekly higher lows. although this normally means were in for a huge move to the downside in broader markets i believe the timing just isnt there at the present moment. things could change overnight, but they could also change the other way just as fast, and however beat down uvxy may be right now it can always go lower next week. i dont think its unfair to stick to the 11.50 target as a rule of thumb while the s&p is showing signs that daily consolidation could lead to resuming the bounce. edit*(if we hold 11.79 closing above 13.79)edit* i will change my mind, but for now i remain bearish on vix.

I SPY eminent danger.Reposting a previous analysis… cause the bearish forecast is still looking reeeaall sassy and good. Like whats up… I’m slightly excited by this.
Also, the vix looks like it could to go bonkers!
Or not… I’m just amusing myself with these puzzles… it’s an addiction. The harder the puzzle, the more dopamine i get for solving it. It can be fun to luck out betting on it too… when the odds seem super favorable… but seriously… were on the brink of ww3… what good is digital anything gonna’ be when the matrix glitches and were all left here on space ship earth, completely unprepared to be self sufficient. Do you slave away your life to live in captivity? Your on a computer… your part of the matrix. The real world is out there… Space ship earth. Find a community and homestead. Life off the life on earth. Exit the matrix. Exit capitalism. Exit consumerism. Exit Corruption. Every one of us is complicit to allowing any other human to tax your work energy via imaginary credits. I believe its past time to convert digital credits in the ponzi scheme of capitalism into tangible life sustaining assets.
Exit the matrix, before it implodes!
Good Luck, God Speed, Love & Light to All!

Megaphone in NasdaqThere are three reasons for a downward breakout of the megaphone (broadening wedge).
1. Head fake
2, Declining volume on rally
3. Very overbought RSI

$UVXY 24 hours max! in and out 👁🗨*This is not financial advice, so trade at your own risks*
*My team digs deep and finds stocks that are expected to perform well based off multiple confluences*
*Experienced traders understand the uphill battle in timing the market, so instead my team focuses mainly on risk management
My team purchased shares of Inverse ETF $UVXY this afternoon. This set-up will challenge our 1-hour chart abilities.
Our first take profit is set at $18. Our take profit 2 at $20 may or may not get hit. We have also set an automatic stop-loss at $14.25.
ENTRY: $15.50
TAKE PROFIT 1: $18
TAKE PROFIT 2: $20
STOP LOSS: $14.25
If you want to see more, please like and follow us @SimplyShowMeTheMoney

The Vixen is all dressed up and ready to gocup and handle target 55+, cluster from 2020 seems to correspond to that level. This could be very fast, within 2-3 weeks.

vix still getting waveshigh 19s are due if we can hold above high 18s. were headed for that same resistance and if we break the quad top it will close the gap at 20.05 . short targets are lower horizontals if we cant hold high 18s and the middle line is what i think would be a good pivot. TRAMA is flatlining, and VWMA is wobbly but if we start to see red crossing above blue and trending up together i would look to the upside. 21 still possible, though as is mid 16s. the daily bounce hasnt happened in semiconductors, big tech or spx.

Massive Vix Wave Incoming?Studying the VIX on the monthly chart. Looking at the dot com bubble and 2008 crash you can see the VIX works in some pretty massive waves. Looking at today we are in a some kind of new massive wave considering we haven't had a proper market correction in 10+ years. Can VIX break past 100?

TRAMA over VWMA and Stoch headed to overbought for this vix deriuvxy has seen a lot of choppy action for weeks but the trend has been upward. if we keep seeing TRAMA and VWMA rise together on the daily and double stochastics
signal remains bullish we should end the week higher as long as spy stays under 400
holding mid 18s uvxy would indicate were due for a trip back up to high 19s

island top or taking offif we hold the 18.50s and break upper 19s retracement will be good enough and well be over rising vwma and trama if we reject 19.75 and close below a significant low on the 5 minute then stiff overhead resistance means were in for low 18s. if we see that close into the upper 19s were headed over 21

still in the pop, or back to the doldrums?its clear that uvxy has stiff overgead resistance, but if that breaks we could see over $21 soon. prove the bear case and its moreso back to $16.

volatility is picking up (UVXY)we are coming off the first weekly higher low at all time lows since the corona bounce. we havent had a major weekly bounce since then. id imagine if we do close this week somewhat lower, and trend down into next week its likely to send uvxy over 21. if SPX continues its daily bounce next week id imagine were headed back to all time lows UVXY 13 or less.

VIX on Triangular Track!Expanding triangle
Target: 49.5
In Elliot-Wave theory, triangles have 5 sides and each side is usually subdivided into 3 waves. Analysis valid as long as the channel stays intact. Equities will micro-bottom mid-June before the commencement of the melt-up rally!
Earlier analysis:
48.5/49.5 achievable with an extended market correction. Implied volatility uptrend due to fundamental reasons ( Inflation /War).
S&P 500 target would equate to 3950-4000 in this projection!
NASDAQ: 12K (Wave 1 top) or 11K (200 Week EMA / 50 Month EMA )

looks like were forming a lower high (uvxy)the 15 minute seems like price want to fall back into the vwap channel and go for a touch of vwma

$UVXY$UVXY looks primed for a move to the upside. Looks like a double bottom and a breakout bull flag may push this to 17 tomorrow, which will push the market a little further into the darkness temporarily. If this holds true then it will give more truth to our 432-428 target on the month for the $SPY.

Volatility about to break out? $UVXY the path to $60+.$UVXY looks like it's on the verge of breaking out to the upside. We a falling wedge which broke out to the upside and now price has found support on the top of the structure. Usually that indicates a large move upwards is coming.
If it starts moving, I can see a quick move up finding a final target of around $62.
Let's see what happens over the coming weeks. I've started buying in the low $12 region.
UVXY Heading Higher PotentiallyWe seem to be making a bottoming formation and within this I see a janky head and shoulders pattern. I think we are slightly over bought on lower time frames but we could move higher and the key to that here is volatility. NFA, DYOR

Daily high of 14.28 and a low of 13.21 will it hit 12 next weekStill new to this, but bare with me. I think with RSI and the MFI showing a cooling off it could run up before next week.

$UVXY entry PTs 11.50-12-13 Target PTs 20-23 and higherThe index seeks to offer exposure to market volatility through publicly traded futures markets and is designed to measure the implied volatility of the S&P 500 over 30 days in the future.

$UVXY market rally slowing down? 👁🗨*This is not financial advice, so trade at your own risks*
*My team digs deep and finds stocks that are expected to perform well based off multiple confluences*
*Experienced traders understand the uphill battle in timing the market, so instead my team focuses mainly on risk management
Bitcoin and the US markets all seem to be losing steam after rallying for the majority of the month of March. My team is now expecting the markets to retrace and behave bearish leading into the month of April.
Some US states have been proposing a possible stimulus check to residents to help fight inflation. This may send the markets higher, but in our opinion, this would be an ignorant course of action and it is unlikely to pass. We believe that this would only delay the inevitable recession and cause the inflation situation to grow even worse. With this unlikely scenario being said, we still believe that now is the time to position ourselves defensively against the market.
My team will be using $UVXY again as our market hedge, and we hope to come out on top with it just as before.
We entered $UVXY today at $14.25 per share. Our take profit is set at $18 with a stop loss at $13.25.
ENTRY: $14.25
TAKE PROFIT: $18
STOP LOSS: $13.25
If you want to see more, please like and follow us @SimplyShowMeTheMoney

Is the cash VIX giving us a reversal sign?The cash VIX at the end of June 2021 found very strong support at 15 and could not close below. Since that timeframe we've seen higher highs. Since Nov 4, 2021 the cash VIX has made higher highs and lower highs and is therefore in an uptrend until we make a lower low. The VIX uptrend can also be seen when zooming out on the weekly and monthly chart.
Yesterday, the cash VIX had an "inside" day. I thought it would be interesting to study what happens to the VIX after an inside day. The orange circle's on this daily chart are "inside" days. As you can see they give an indication that a reversal is coming...sometimes the reversal happens immediately and other times it takes a couple days but in general, based upon my analysis, it's been a fairly reliable signal in the last 9 months.
If you follow the VIX then you also know that VIX gaps generally get filled fairly quickly...most of the time very quickly but some can take a couple of weeks to months. Very, very few take years.
I'm showing the following gaps have not been filled:
Upside Gaps:
45.40 (April 20, 2020)
35.01 (March 8, 2022)
33.39 (March 15, 2022)
Downside Gaps:
19.98 (Feb 9, 2022)

ProShares Ultra VIX ETF (USA: $UVXY): Good Area To Accumulate 👌UVXY offers daily leveraged exposure to short-term VIX futures, designed to capture the volatility of the S&P 500, in a commodity pool wrapper. As a geared product with daily resets, UVXY is designed as a short-term trading tool and not a long-term investment vehicle. Returns over holding periods greater than one day can be, and often are, significantly different from 1.5x. Like its peer products, UVXY does not deliver leveraged returns on the VIX index itself, but on front- and second-month futures contracts. As a commodity pool, investors will get K-1 at tax time but avoid the counterparty risk of an exchange-traded note. Prior to February 28, 2018, the fund provided 2x leveraged exposure.
