Value
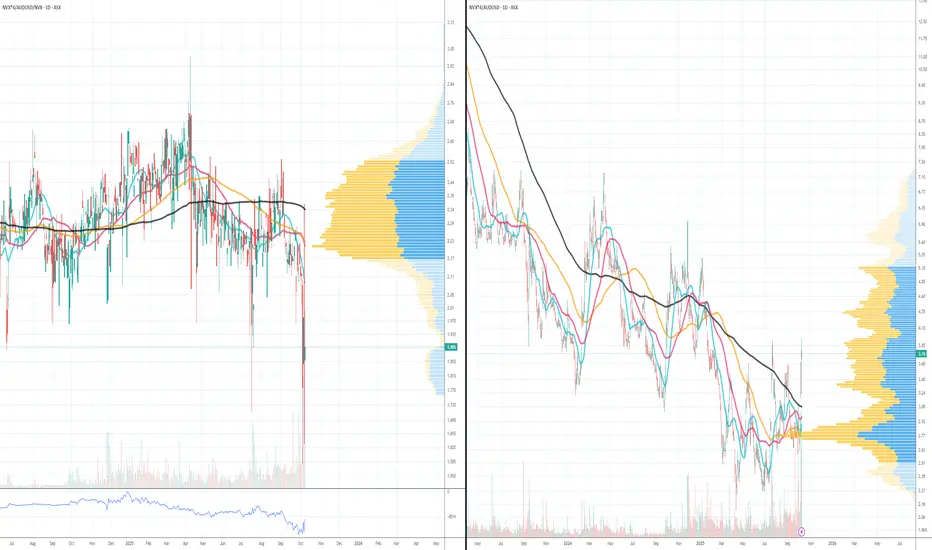
ASX:NVX premium to Nasdaq:NVXCrazy thing with ASX:NVX is how the Aussies are buying it hand over fist... its primary listing is on ASX. We have an ADR listing on NASDAQ that represents 4x ASX shares per Nasdaq share. It's currently trading at a 1.9x premium on ASX to the NASDAQ price! Use these charts to track the premium.
Rising Inflation Expectations Put the Fed’s Credibility to the T
Rising Inflation Expectations Put the Fed in a Tight Corner
The latest release of the U.S. Consumer Inflation Expectations came in hotter than anticipated, rising to 3.4% in September, compared with 3.2% previously and a 3.1% consensus. This seemingly small uptick carries significant weight. It suggests that American households increasingly believe inflation will stay elevated, posing a new challenge for the Federal Reserve, just weeks after its controversial decision to cut rates.
For a central bank whose credibility hinges on anchoring inflation expectations, this is a warning sign. Rising expectations imply that monetary policy may already be too loose relative to price pressures, leaving the Fed with little room to maneuver between supporting growth and restraining inflation.
What It Means for the Fed
The Fed’s recent hawkish cut, a 25-basis-point reduction paired with strong rhetoric on price stability, was designed to balance two mandates: sustaining a slowing labor market and restoring confidence in inflation control. But this new data complicates that message.
A move from 3.2% to 3.4% may seem modest, but it represents an unanchoring risk. Once inflation expectations drift upward, they tend to reinforce real inflation through wage negotiations, spending decisions, and business pricing. Historically, the Fed has treated such shifts as policy alarms, often responding with tighter stances or more cautious forward guidance.
If expectations continue to rise, markets may start questioning whether the Fed’s current stance is adequate. Instead of debating “how soon” the next cut will come, investors may pivot toward “whether the Fed can cut at all” in the near term.
Implications for U.S. Markets
The reaction in financial markets could be twofold:
Read full analysis on my website
darrismanresearch com
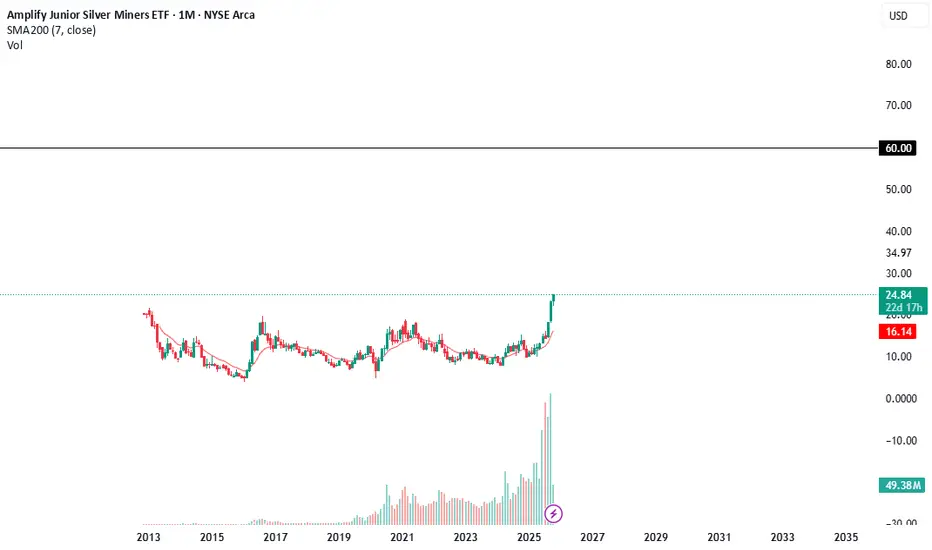
ETF ESG BullishETF ESG (Environment, social and Governance) sector is seen a rising trend based on government policies being implemented considering sustainability.
Also seeing confirmation by RSI indicator,
Can consider for short term and long term based on fundamentals
Long 🟢 position

ETF ALPHAETF BullishMirae Asset Nifty 200 Alpha 30 ETF, represent Nifty 200 Index, as per market condition looks positive. Good for short term.
Long 🟢 position
#etf #trade #India

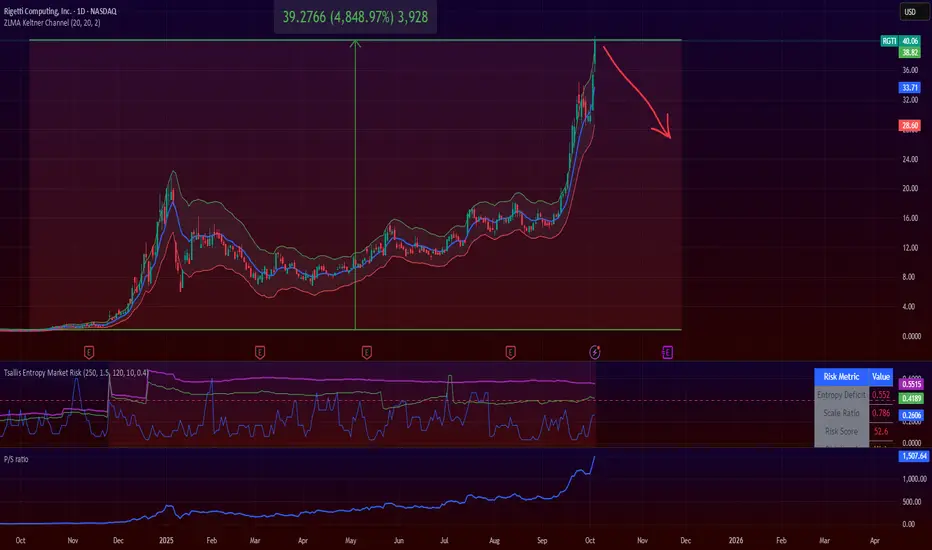
Rigetti Computing: The Quantum Hype Doesn't Add Up to ProfitAs of October 6, 2025, the stock trades around $40, giving it a market cap of ~$13 billion. This is totally absurd for a firm with declining revenue and massive losses.
This analysis substantiates a bearish outlook, highlighting why shorting RGTI makes sense (FOR ME) amid hype-driven volatility.
I'm not picking only on Rigetti. I believe other quantum companies are also ripe for shorts. This exact same analysis can be applied to NYSE:IONQ , NYSE:QBTS , NASDAQ:QUBT and $NASDAQ:ARQQ. These companies trade between 500x and 3000x their sales.
Back to NASDAQ:RGTI , the company is in a profitability abyss, with revenue of $1.8 million in Q2 2025, while operating expenses were $20.4 million.
At this speed, their cash will burn real fast and the company will be forced to issue more shares, diluting/suppressing its price.
Are are some more important points:
Rigetti's P/S ratio is at 1500x (WTF!)
The stock went up 4,800% in one single year (LOL)
They mostly sell vaporware
The current price is just nonsense hype and there are no fundamentals to sustain it
The intrinsic value of this stock is a very small percentage of the current price. Consequently, the stock is due for a strong correction.
I'm just sharing my personal opinion and journey. Do your own due diligence.
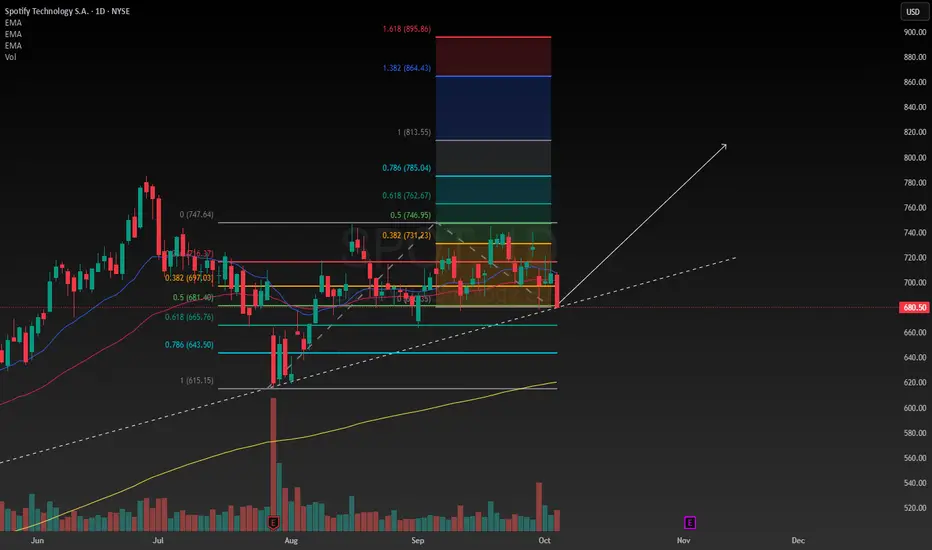
Why I like Spotify stockI'm going to explain the reason I believe Spotify is a good investment, there's a few reasons. I'm basically using Spotify as a defensive anchor in my portfolio. First I'm going to explain the fundamentals, and the formula for this never changes. The discounted cash flow model, is a mathematical formula used to value companies based on the expected revenues they will generate over a number of years. I have made my own model for the stock, and compared it with others models. The number I have come up with is $700 per share, meaning that anything less than $700 per share I would consider the company undervalued. This is my margin of safety I will not pay more than the perceived intrinsic value for the company, but the opportunity last week to buy shares at $680 was attractive to me so I added to my position, quite a substantial chunk of my portfolio is on Spotify.
Another reason I like the stock despite because I'm looking at the capital actually needed in the business. Whether that's a good investment for me depends on how much I paid for the business, in the end. Some great businesses operate on negative capital, subscribers pay in advance, there are no fixed assets to speak of, the receivables are not that much, and the inventory is nothing. Basically what I'm trying to say is that great consumer businesses need relatively small amounts of capital to run. I like this kind of businesses but so does the rest of the world and so they can become very competitive. I believe Spotify has a competitive advantage in their business model that's relatively defendable considering how long they've been around.
From a technical standpoint the stock has been in a range for a couple months, a break out to one direction or the other is inevitable eventually. My price target for the short term, maybe the next 12 months is $800, I'm going to just hold the stock, with no stop loss, because this is not a trade, to me this is an investment. I've had the stock in my portfolio for a few months and have been pleasantly surprised by how well it balances with some of my other positions. Monitoring my portfolio daily, I really enjoy just watching the markets and listening to some Spotify.
SMGR.JK long target 3000 within 3 monthsPT Semen Indonesia (Persero) Tbk ( IDX:SMGR ) is moderately bullish over the next 3 months, with potential for 10-15% upside from the current price of 2,710 IDR. SMGR, Indonesia's state-owned leading cement producer, is poised for a rebound driven by a confluence of technical recovery signals and improving fundamentals.
The stock has underperformed the IDX Composite benchmark YTD, trading at a depressed valuation (PE Ratio (TTM) of 69.49 but forward P/E of 25.84, with a 3.55% dividend yield), which creates an attractive entry point for value-oriented traders.
SIG reported "early signs of growth" in H2 2025 cement demand after a -7.4% Q1 drop, driven by infrastructure tenders. Aggressive pricing competition has eased, lifting blended ASPs to multi-quarter highs.
Trading at 0.42x book value (undervalued vs. peers), with fair value ~3,618 IDR (25%+ upside). Analyst consensus is neutral (11 firms), but max targets hit 3,500 IDR on infrastructure bets.
Buy on dip to 2,650-2,680 IDR (WRPC lower band + VAP support), add on break above 2,800 IDR (channel midline + Stoch buy confirmation) for full size.
Long position on SMGR ( IDX:SMGR ) with a target price of 3,000 IDR, anticipated within a 3-month horizon, contingent on technical confirmation and favourable market conditions. Tight initial stop at 2,600 IDR.

Lamb Weston Holdings | LW | Long at $51.32Lamb Weston Holdings NYSE:LW , the potato / French fry king, has gone through a tremendous downturn since 2023. Yet, earnings are forecast to grow 22% per year into 2027. Debt is quite high at 2.5x and this company, like many others, will significantly benefit from lower interest rates in the future. If the US experiences another way of inflation, Lamb Weston Holdings could be on the beneficiary side of things.
From a technical analysis perspective, the price has entered my "crash" simple moving average zone. Typically, this area signals a bottom, but it's not guaranteed. I foresee the daily price gap near $50 being closed in the short-term before a true move up. A dip to $47-$48 is not out of the question. Regardless of trying to predict bottoms, at $51.32, NYSE:LW is in a personal buy zone.
Targets:
$62.00
$68.00
$77.00

Acadia Healthcare Company | ACHC | Long at $21.98Acadia Healthcare's NASDAQ:ACHC stock has fallen nearly -76% in a year, primarily due to weak 2024 results, missed revenue and EPS expectations, and a soft 2025 revenue guidance. Ongoing federal investigations into billing practices and lawsuits have further eroded investor confidence. However, it is currently trading at a price-to-earnings ratio of 7.42x and earnings are forecast to grow 7.07% per year. The profitable company is trading at a good value compared to other healthcare companies. Debt-to-equity is relatively low (0.64x), but legal risks (DOJ probe, lawsuits) strain margins.
The stock has entered my "major crash" simple moving average territory and there is a lot of downward / selling pressure. But, more often than not, this area (which... I caution... still extends down near $16) can often signal a temporary or longer-term bottom. Personally, this is a buy area ($16-$21) even if it turns into a short-term bounce in 2025. But I believe the overall market moves in the S&P 500, etc. will guide this stock more than anything at this point (unless more bad news about the company emerges).
One thing to note is that there are open price gaps on the daily chart near $17, $10, and $8. These gaps, which often (but not always) get closed in the lifetime of a stock, are a potential signal for further declines - at least at some point. There could be a drop near $16, then a $10-$20 bullish price increase after that, followed by more declines (trapping investors). Time will tell, but NASDAQ:ACHC is currently attractively valued. From a technical analysis standpoint, it is in a personal "buy zone", even if purely for a swing trade.
Targets:
$27.00
$33.00
$39.00

Institutional Absence & Retail-Driven Liquiditywww.forexfactory.com
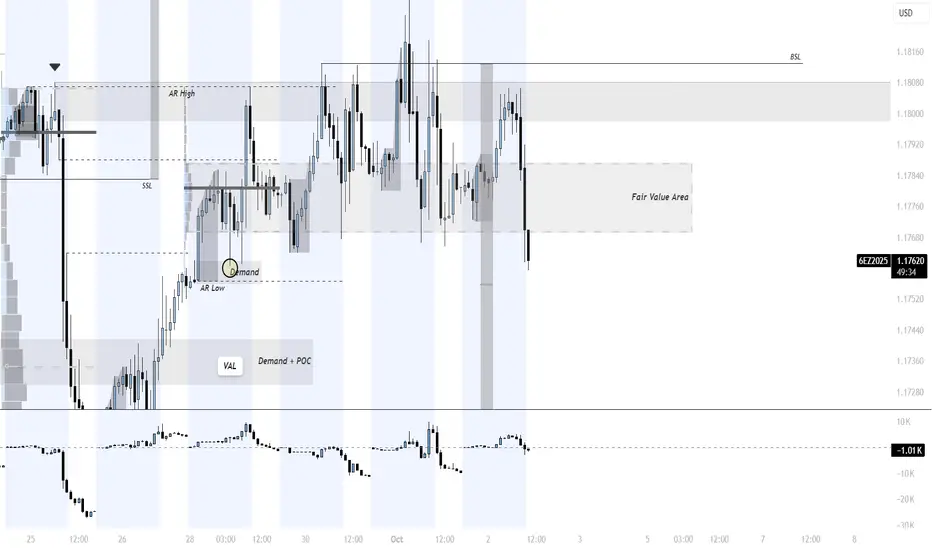
The current market environment reflects an absence of strong institutional conviction, with price rotating inside overlapping value areas as uncertainty from the government shutdown limits directional discovery. Without key economic data to anchor narratives, orderflow is dominated by retail participation, where stop-losses and emotional reactions provide the primary source of liquidity. This creates volatility spikes and false auctions that lack sustained follow-through, making the market prone to choppy, stop-driven moves rather than genuine intent. In such conditions, caution is essential, with asymmetric opportunities found only at extremes of value areas or in response to major liquidity events that can reintroduce institutional activity and restore directional flow.
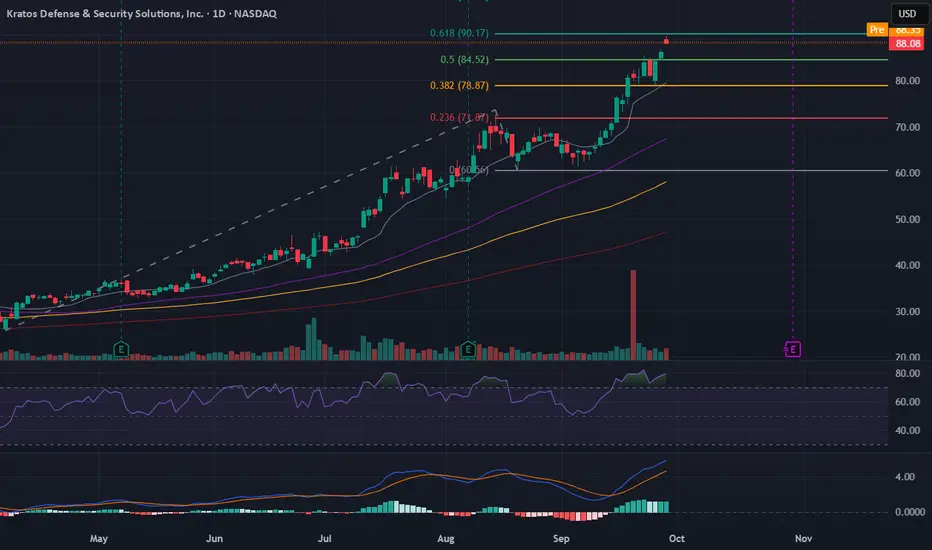
$KTOS - Conglomerate of nothing?Kratos is a technology, products, system and software company addressing the defence, national security, and commercial markets. However, Kratos has built its whole pitch around being more than a “test services” company, yet most of its revenues are still test/demonstrator programs.
Why the priced in expansion is unlikely:
- Size & capital base: Kratos does ~$1.1B revenue with single-digit margins. To go from testbed shop to prime contractor, they’d need billions in infrastructure, engineering, and political capital, which they do not have.
- Customer choices already made: The USAF CCA Increment 1 decision was pivotal. They passed over XQ-58 Valkyrie. That was the clearest shot Kratos had at scaling into a production UAV program.
- Hypersonics (Mach-TB 2.0) are testbeds only; the operational hypersonic weapons are led by Lockheed, Raytheon, Northrop.
- Competition: Anduril, GA-ASI, Boeing, Northrop all have deeper pockets, lobbying, and trusted supply chains.
- DoD prefers scale & reliability: Kratos is a “nice to have” cheap option, not the strategic backbone.
- History of promises: Kratos has been saying “we’ll pivot into production” for years. Yet most revenue is still target drones and test contracts. Track record suggests a structural ceiling.
As such, the current $15 billion market cap implies many current test contracts will expand into real production at scale and provide incredible revenue growth, which seems very unlikely.
Our base-case DCF model (GAAP net income based): equity value ≈ $2bn ($11.67/share), compared to a current price of $88/share. The shares screen materially overvalued on fundamentals.
Technicals:
Entering a short at $88, being close to Fib level of $90, and RSI signalling overbought. Looking to start taking profits at $80, and $72.
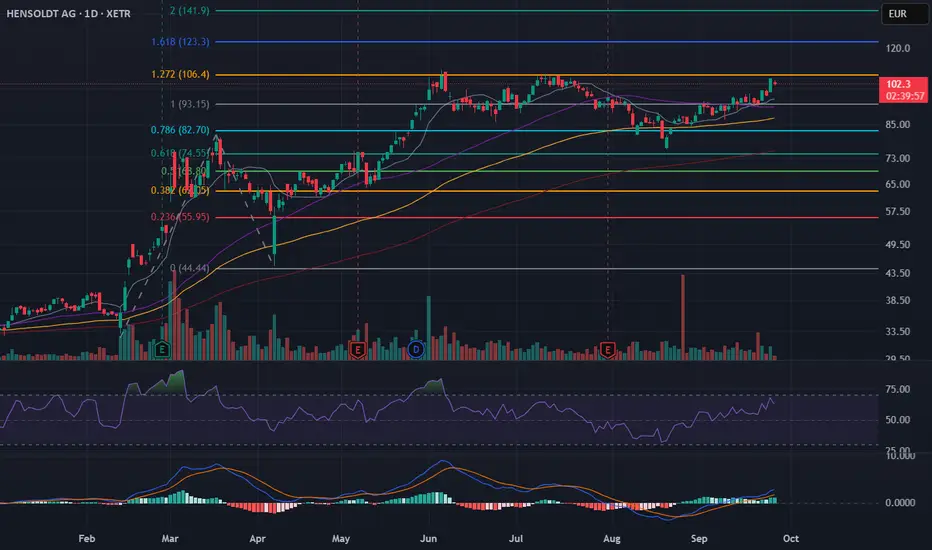
Hensoldt (HAG) - Overly optimistic? [Bear Case]Business model: Hensoldt is a German defence-electronics pure-play: ground/air radars, optronics/periscopes, electronic warfare. Their order book and revenue backlog is benefiting from Europe’s continuing rearmament.
Why pricing looks rich: At ~€100+/share, the market appears to discount flawless conversion of the rearmament wave into sales and cash, sustained high-teens margins, and minimal programme/approval risk well beyond 2030. My GAAP-based DCF (9% discount, –1% terminal) values equity ≈ €20/share (DCF model snapshot), far below the market.
Trading multiples at today’s price (as of Sep ’25):
- EV/Rev: ~5× FY25.
- EV/E (GAAP): ~116× FY25, ~85× FY26, ~72× FY27
- Compared to other defence companies, these current and future multiples are far above the average, requiring much greater growth in income, which seems unlikely.
For today’s price to be ‘fair’, the market is effectively assuming:
- Hensoldt’s 2030 revenue guidance is exceeded and margins significantly improve from current levels.
- Contract wins versus close competitors in various revenue drivers, for example vs. Thales/Saab on large NATO sensor programmes (not just German programs).
Technicals:
The stock is approaching a recent all-time high, also corresponding with a Fib level as resistance, but with fading momentum, future defence spending globally already priced in, entering a short at €104.
Deere and Company is a stapleIt looks like a good time to buy Deere shares, I have done an evaluation on the perceived intrinsic value of the company. To back up my philosophy about what I think a "good deal" on the shares is, I have included a technical analysis including a trendline being touched for the third time at a measured Fibonacci retracement.
Looking ahead five years, based on the revenues the company is expected to generate according to wall streets current estimates. I have used the discount cash flow model to determine what I believe a suitable margin of safety would be to buy and hold shares of Deere. I am taking into account, the time value of the investment by measuring 5 years ahead, the risk to me at this point is very low. $570 seems to be a fair price taking into account all the fundamentals, I have been holding the stock for some time, but am increasing my exposure to 5% allocation in my portfolio.
Naturally I like the stock because I have worked around these machines a lot in my life. So I have a good understanding of how the company will make money and why the company will make money. The current price of a share is $461, while the intrinsic value according to my model is $570, essentially that means the shares are about %25 undervalued right now. I would personally rate Deere a buy despite the short term headwinds the company faces, we need them.

GBP.USDA very hard hit 2 day rally on the dollar. Lets unpack a few things about the recent data outlook.
Good news across the board - the market that was once "priced-in" isn't anymore after the UKs fiscal stance on the public sectors borrowing making price swing from the latest US rate cuts up until now amounting to around 400 points. Reactive or not ? Have we collectively stopped questioning the feds credibility ? Or are we finding a balance because the UK doesn't look so attractive than 2 weeks ago ?
Recent data points from the UK has lead me to believe that the economy is slowing. The economy slowing around the busiest period of the year ? This stance already makes you question. Although there is a more "natural" stance on the UK in accordance to their preliminary data outputs in relation to GDP, my next question is what happened in Q2 ? Q2s data outputs of GDP from the US was expected to beat its consensus, but we need to drift back into the question of "is this natural?" - the answer is no, the market reacting to a Q2 data input I think is efficiently acceptable but not a justifiable way to take advantage of the same way monetary policy in the UK is hawkish. This is because of the headline risk traders where afraid of - tariffs - the activity in Q2 was huge, thus, inflating the report we have had today.
We've been at this price before but this time its a 1.35 target. The euro is a sound investment against the dollar whilst the pound follows. I am in positions across the board ranging from 1.345 up until now, I am potentially taking advantage of how the market has been very reactionary based off singular data inputs that do not focus on the end of year narrative & the effects from this year. Given the path of rates, we are expected to keep cutting up through next year in the US, inflationary pressures add on which today those "good" data input were heavily emphasized in the price because it is "good". But the school of thought is that a positive or negative reading should not automatically make an input from a perspective of bullish or bearish. There are questions, theories that neglect data outputs. Why do you think there are times news reacts badly to good news which doesn't align with the nominal belief that it is good ?
In a sense we can try and capture all angles, but in this short summary I have captured a few that fuels the belief in a target as such. The markets swing high to now swing low is somewhat exaggerated giving no escape to those who are hedged or locked in. There is a release going to happen and it may be as vicious as the one today but on the upside. Unless there is breaking news the fed will pivot from their projections or if there is some external headline event moving the dollar, what you are witnessing now is a pure TA play powered by aggressive buyers trying to close the gap. While the UK remain neutral on rates, they have also considered shrinking their borrowing, giving a blow onto their QE program which that so called program was reactionary when Powell mentioned it.

TANKTOBER!SPY eyeing a break below 6600—shutdown looms, Powell’s silence speaks volumes. Holding shorts, rolling puts into November 655s if we gap. #SharpShooterStocks #Trading #SPY #Shutdown2025
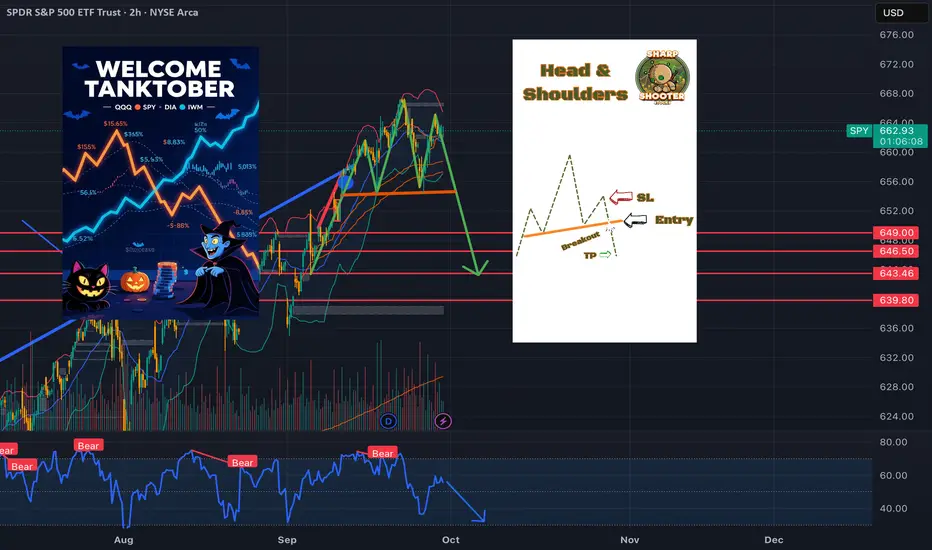
TANKTOBER!SPY eyeing a break below 6600—shutdown looms, Powell’s silence speaks volumes. Holding shorts, rolling puts into November 655s if we gap. #SharpShooterStocks #Trading #SPY #Shutdown2025

Aster vs Hyperliquid – Value BreakdownWas just taking a closer look at GETTEX:HYPE vs $ASTER. Both projects are moving fast, but the fundamentals tell two very different stories.
Hyperliquid ( GETTEX:HYPE ):
Fully Diluted Valuation (FDV): $46.7B
Annualized Fees: $1.1B
30D Perp Volume: $300B
Volume = ~2% of the entire stablecoin market
Valuation multiple: 42.5x fees
Aster ($ASTER):
Fully Diluted Valuation (FDV): $16.5B
Annualized Fees: $110M
30D Perp Volume: $27.7B
Valuation multiple: 150x fees
Takeaway:
While $ASTER has seen explosive early performance, the fee-to-FDV ratio is stretched. Meanwhile, GETTEX:HYPE is already generating serious fee revenue and market share, making it fundamentally a stronger value proposition even at current levels.

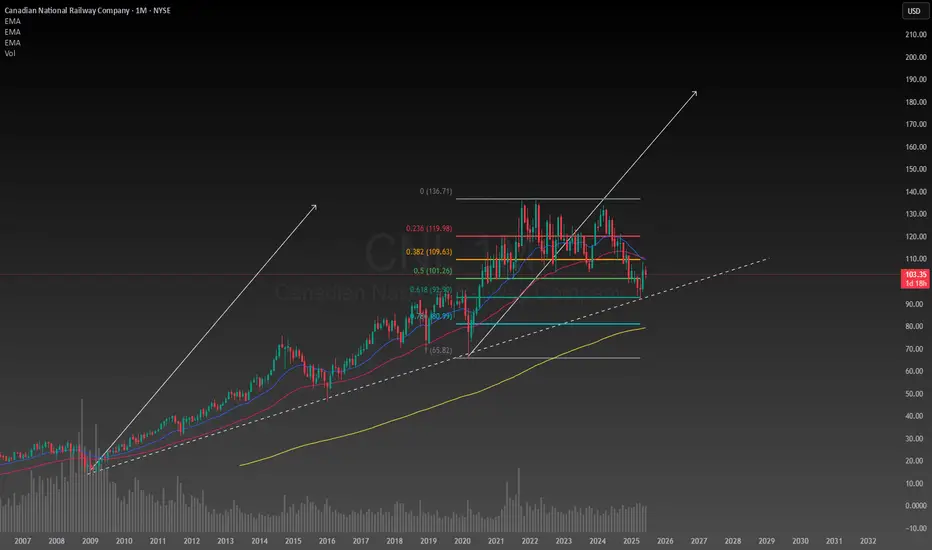
Canadian National Railway has huge upside potentialA decades old trendline still unbroken after months of correction, the Canadian economy seems to be in a great position considering the circumstances. After conducting a simple technical analysis predicting a second leg up the upside potential is enormous if I am right about this. The downside is I am looking at a monthly chart so this will need to be a position trade or long term investment to achieve the desired results. Even if my target is reached I will likely hold onto the stock for years afterwards because the company will continue to make money. The intrinsic value for CNI is between $120 and $225 so it is well below the intrinsic value making any new position on it now at a bargain deal. I will likely be allocating a significant portion of my portfolio to it in the next few days to weeks.
iQIYI: bet on recovery or just another illusion?Fundamentally, iQIYI is often called the “Netflix of China.” In recent years, it has faced heavy pressure from high debt levels, fierce competition from Tencent Video and Bilibili, and slower growth in the Chinese domestic market. However, recent earnings reports show positive shifts: a growing subscriber base, higher ARPU (average revenue per user), and reduced operating losses. With government support for the tech and entertainment sector and signs of consumer recovery, iQIYI has a real chance to strengthen in the mid to long term. If subscriber growth and cost control continue, the company’s market cap could start to recover, making current levels attractive for medium-term investors.
Technically, the stock still trades below the 200 EMA, showing ongoing seller pressure. The key support zone is $2.30–2.40, and holding this area keeps the bullish scenario alive with targets at $3.40 and $5.25. A longer-term recovery could extend toward $10.40, but only if a sustainable uptrend is confirmed. Losing $2.30 would invalidate the bullish case and expose downside toward $1.60–1.80.
This is one of those situations where market expectations diverge from reality. Optimism makes a reversal seem near, but as always, emotions must be put aside — we wait for clear technical signals before entering.

support on the curveBitcoin has potential support on the curve, where the price is currently at 108333.
In my opinion, it will reach at least the
cup and handle target on the weekly chart by the end of the year. I don't expect it to go over 150k this year, and I don't really believe in 140k+ either.
The peak will probably come by mid-October. This doesn't necessarily mean a peak for altcoins, at least not for all of them.
Cryptocurrencies can also fall due to the fall in stocks, which are now very overvalued compared to the real economy, see Buffett indicator.
Now on Thursday and Friday, important economic news will come, so we can expect at least a minor drop.
If the drop does not occur for this reason, it may be due to the US attack on Afghanistan. Be careful.

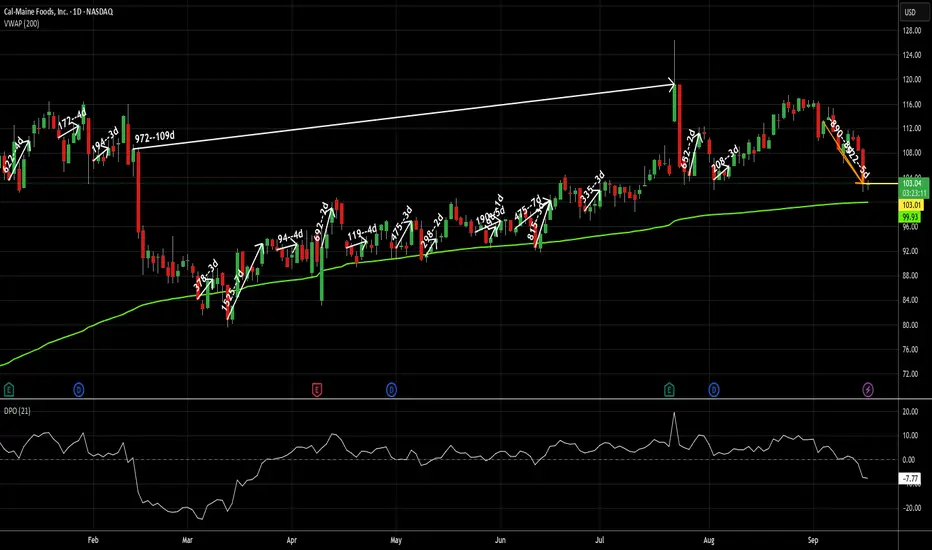
Oxymoronically pounding the table here for CALMThere are a lot of reasons I like the trade I entered into yesterday at the close here. I'll start with some reasons I'd like CALM regardless of my trading style.
I think everyone can agree we are in an overvalued market right now. That inherently creates risk with any stock you buy right now. Not saying we are gonna go down, but the more overvalued the market gets, the greater the risk that creates. CALM has several things going for it in that regard.
1--it has a TTM P/E of 4.12. Not 41.2 - FOUR!!! This is good even for a value stock.
2--their current yield is 8.11%. Give your head a second to wrap itself around that one - this stock has a yield that is twice its P/E. To put that in perspective, NVDA has a P/E of 50. If its yield were 2x its P/E, it would be paying a 100% dividend. This is not really an anomaly, either. It has always been a high dividend stock.
3--in the event inflation picks up again, foods are an area where costs can be passed through to customers better than in other areas. Eggs will still be eaten, even if they cost more. We've already proven that once. People will complain, but they still buy them.
Now for the part that really intrigued me here. 18-2 on trade signals in 2025 with an average gain of 3.5% and an average holding period of 9 days (including that 109 day marathon). That includes the two losing trades recently, and works out to a gain of .39% per day held. Note: trade returns on the chart are basis points (.01% per bp)
Those are beyond tech stock level daily returns on a stock that has been flat overall on the year, that sells something Americans bought 108 BILLION of last year (while griping about prices) that has a low P/E and if the trade goes sideways, pays me 2% a quarter to hold onto. That's .03% per day just to hold it, not including any gain on the trade itself. The average historical daily gain of SPY is around .04%, for comparison.
Why is this stock not being talked about? I don't know and I don't care, but I went long at yesterday's close at 103.01 and it's trading just below that as I put the finishing touches on this post.
As always - this is intended as "edutainment" and my perspective on what I am or would be doing, not a recommendation for you to buy or sell. Act accordingly and invest at your own risk. DYOR and only make investments that make good financial sense for you in your current situation.
Constellation Brands | STZ | Long at $134.50Constellation Brands NYSE:STZ
Technical Analysis:
Currently trading just below my "crash" simple moving average area. This area is often a bottom, even if temporary (sometimes there is a continuous stairstep down, though). There is a high probability the stock could drop down to the "major crash" zone ($120 and below) in the near-term, but all price gaps on the daily chart since 2020 that were open below the current price are now closed (bullish).
Earnings and Revenue Growth
Projected earnings increase from 2025 ($11.6 billion) to 2028 ($15.4 billion): +38.2%
Projected revenue increased from 2025 ($9.1 billion) to 2028 ($9.8 billion): +8.3%
www.tradingview.com
Health
Debt-to-Equity: 1.6x (high)
Altman's Z-Score/Bankruptcy Risk: 3.1 (excellent/very low risk)
Insiders
Warning: Selling outweighs buying.
openinsider.com
Action
Constellation Brands hold a number of major names in the alcohol industry. While sales have slumped and revenue growth is weak, it's a solid company paying a +3% dividend. I do not expect this to skyrocket any time soon, so those into overnight returns may want to pass. The decision to enter is primarily based on technical analysis and name-brand recognition. I am also going to keep my target low for a swing trade due to the unknown economic times ahead.
Targets in 2028
$158.00 (+17.5%)
$178.00 (+32.3%)
