$BWPT (VCP - 14W 26/7 3T)Position update: November 27, 2025.
Key factors:
1. The stock is in a confirmed Stage 2 uptrend.
2. A textbook Volatility Contraction Pattern (VCP) with a clearly defined, low-risk entry point.
3.The price surge of over 190% in only 35 days, reflecting powerful momentum.
4. The stock moves on its own drummer, outperforming the general market.
5. Displays high relative strength, outperforming sector and index benchmarks.
6. Volume has dried up, indicating less supply coming to the market.
7. Breakout accompanied by notable volume expansion.
Considerations:
The breakout was not exceptionally strong intraday, but the closing action was solid.
Conclusion:
This remains a classic VCP setup with a clean pivot and minimal risk. I’ll be watching closely to see whether it can hold its levels and deliver follow-through from here.
VCP

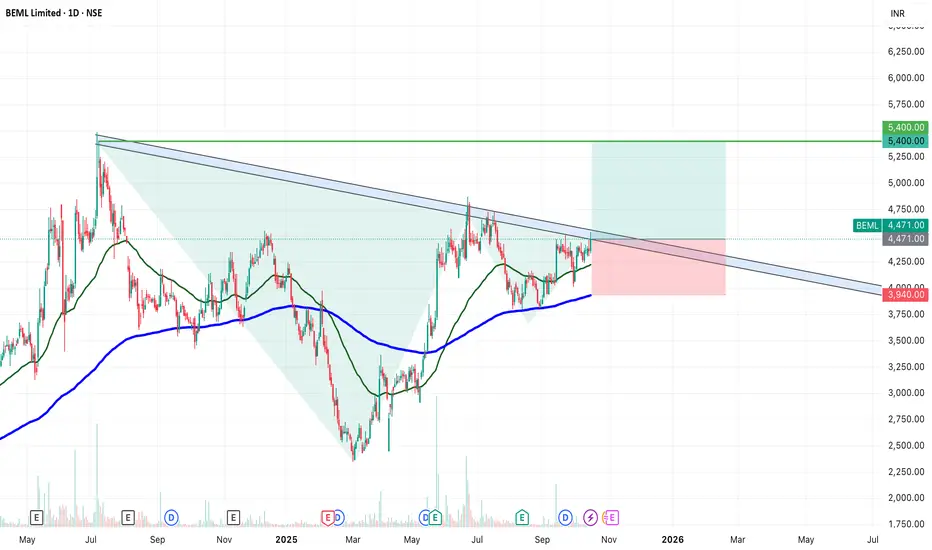
SWING IDEA - BEMLBEML Ltd , a key player in India’s defence and heavy equipment sector, is displaying a strong bullish breakout setup supported by multiple technical confirmations.
Reasons are listed below :
Breakout of a long-term trendline after multiple retests
Cup and Handle breakout, signaling continuation strength
VCP (Volatility Contraction Pattern) breakout indicating accumulation
Bullish engulfing candle on the daily timeframe confirming momentum
Higher highs and higher lows structure intact
Trading above 50 & 200 EMA, reinforcing trend strength
Target - 5400
Stoploss - daily close below 3940
DISCLAIMER -
Decisions to buy, sell, hold or trade in securities, commodities and other investments involve risk and are best made based on the advice of qualified financial professionals. Any trading in securities or other investments involves a risk of substantial losses. The practice of "Day Trading" involves particularly high risks and can cause you to lose substantial sums of money. Before undertaking any trading program, you should consult a qualified financial professional. Please consider carefully whether such trading is suitable for you in light of your financial condition and ability to bear financial risks. Under no circumstances shall we be liable for any loss or damage you or anyone else incurs as a result of any trading or investment activity that you or anyone else engages in based on any information or material you receive through TradingView or our services.
@visionary.growth.insights
$IPCC (VCP - 21W 20/5 3T)Position update: November 18, 2025.
Key factors:
1. Confirmed stage 2 uptrend.
2. A textbook Volatility Contraction Pattern (VCP) with a clearly defined, low-risk entry point.
3.Currently forming a VCP following a prior price surge of nearly 150%, demonstrating strong momentum.
4. The stock moves on its own drummer, rallying 70% while the broader market advanced just 22%.
5. The price action looks even better on weekly chart
6. Displays high relative strength, outperforming sector and index benchmarks.
7. Volume has dried up, indicating less supply coming to the market.
8. Significant volume expansion on the breakout.
Considerations:
Despite a favorable technical setup, risk should be managed diligently given the stock's sharp ascent and potential for profit-taking. Establishing stop-loss levels and monitoring market conditions is essential.
My first position was initiated on October 27. This is another quintessential VCP breakout with a clear pivot entry and minimal risk. I’ll be watching closely to see if it can hold up and follow through from here.

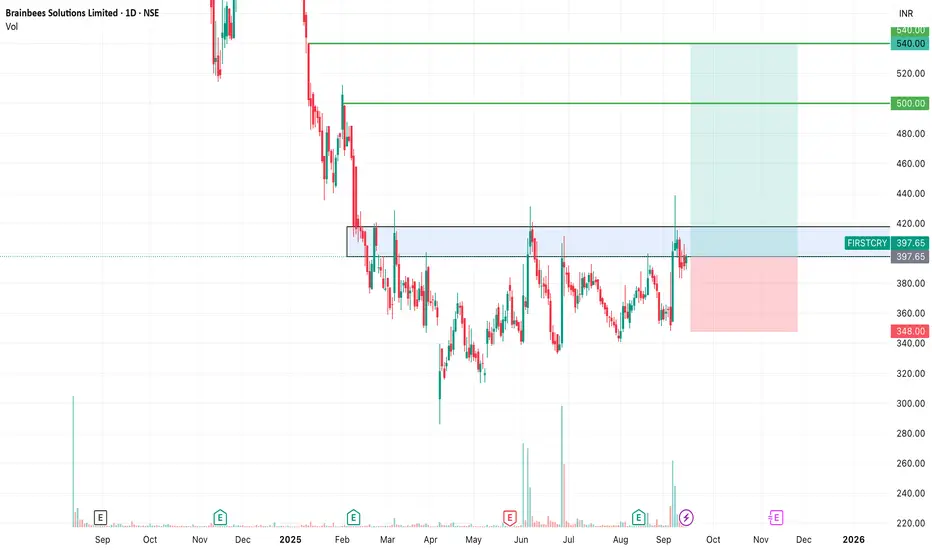
SWING IDEA - FIRSTCRY (BRAINBEES SOLUTIONS LTD)FirstCry (Brainbees Solutions) , a leading omni-channel retailer for baby and kids’ products, is showing signs of a potential breakout, presenting a strong swing trading opportunity.
Reasons are listed below :
400 resistance zone tested multiple times — now looking ready for a breakout
Attempting to break out of a 7+ month consolidation phase
Volume spikes suggest accumulation by smart money
Golden Fibonacci retracement support in play
Price action forming higher highs, confirming bullish structure
Target - 500 // 540
Stoploss - daily close below 348
DISCLAIMER -
Decisions to buy, sell, hold or trade in securities, commodities and other investments involve risk and are best made based on the advice of qualified financial professionals. Any trading in securities or other investments involves a risk of substantial losses. The practice of "Day Trading" involves particularly high risks and can cause you to lose substantial sums of money. Before undertaking any trading program, you should consult a qualified financial professional. Please consider carefully whether such trading is suitable for you in light of your financial condition and ability to bear financial risks. Under no circumstances shall we be liable for any loss or damage you or anyone else incurs as a result of any trading or investment activity that you or anyone else engages in based on any information or material you receive through TradingView or our services.
@visionary.growth.insights
BORORENEWLooks good on Chart.
Breakout soon...
Above all key EMA.
Good for Short Term.
Target 840,1030.
Do Like ,Comment , Follow for regular Updates...
Keep Learning ,Keep Earning...
Disclaimer : This is not a Buy or Sell recommendation. I am not SEBI Registered. Please consult your financial advisor before making any investments . This is for Educational purpose only.

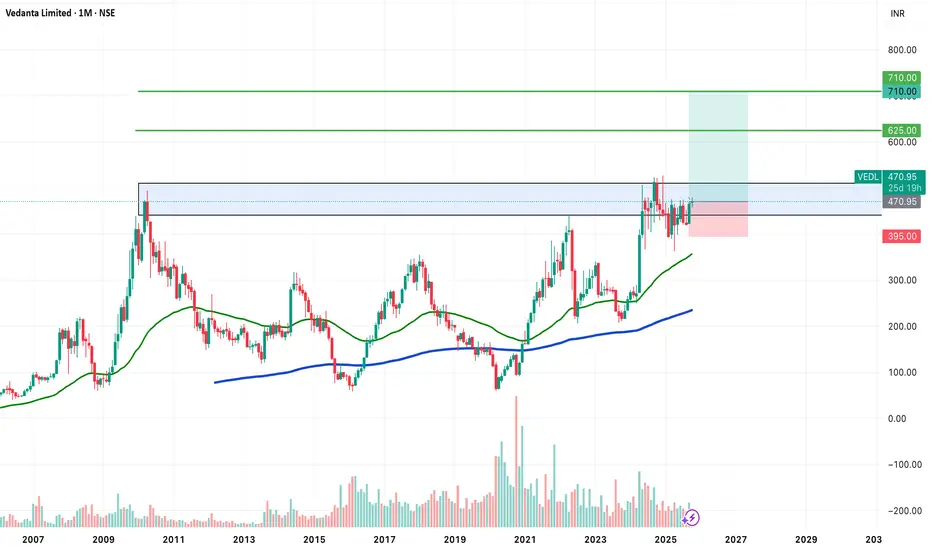
POSITIONAL IDEA - VEDANTA (VEDL)Vedanta Ltd , one of India’s leading diversified natural resources companies, is showing a strong long-term breakout setup supported by powerful technical signals.
Reasons are listed below :
Attempting a multi-year breakout after nearly 14 years of consolidation
Potential VCP (Volatility Contraction Pattern) breakout forming
Bullish engulfing candle on the monthly timeframe
Consolidating near all-time highs, showing strength in price structure
Trading above 50 & 200 EMA on both weekly and monthly charts
Maintaining a clear higher-high, higher-low trend structure
Target - 625 // 710
Stoploss - monthly close below 395
DISCLAIMER -
Decisions to buy, sell, hold or trade in securities, commodities and other investments involve risk and are best made based on the advice of qualified financial professionals. Any trading in securities or other investments involves a risk of substantial losses. The practice of "Day Trading" involves particularly high risks and can cause you to lose substantial sums of money. Before undertaking any trading program, you should consult a qualified financial professional. Please consider carefully whether such trading is suitable for you in light of your financial condition and ability to bear financial risks. Under no circumstances shall we be liable for any loss or damage you or anyone else incurs as a result of any trading or investment activity that you or anyone else engages in based on any information or material you receive through TradingView or our services.
@visionary.growth.insights
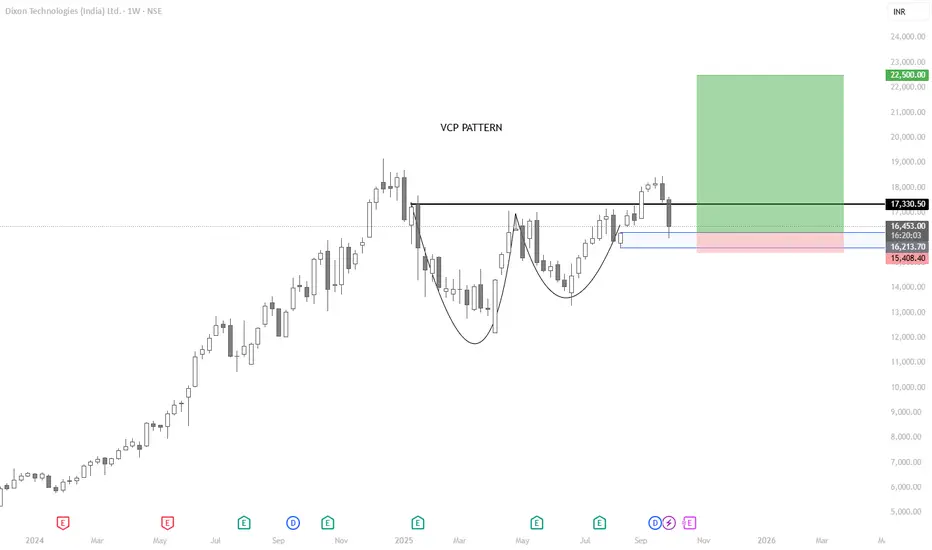
DIXON - VCP setup with good RRDIXON - a perfect vcp pattern with good RR. Expecting TGT 22500. SL 15500 WCB
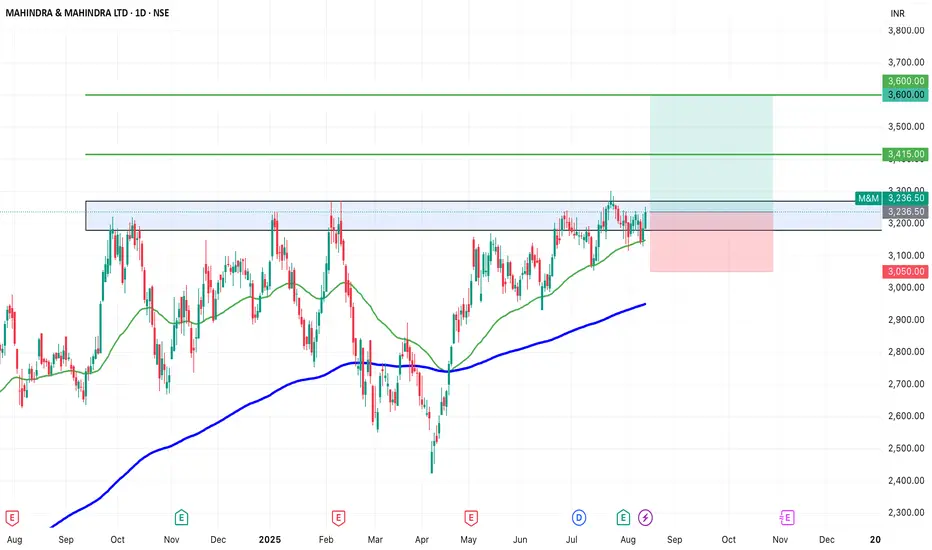
SWING IDEA - M&MM&M , a leading Indian automotive and farm equipment manufacturer, is showing signs of a potential breakout, making it a strong swing trading candidate.
Reasons are listed below :
3,200 resistance tested multiple times — now weakened and primed for a breakout
VCP (Volatility Contraction Pattern) forming, indicating accumulation
Trading above 50 & 200 EMA, confirming long-term trend strength
Inverse Head & Shoulders pattern forming, a bullish reversal setup
Target : 3415 // 3600
Stoploss : daily close below 3050
DISCLAIMER -
Decisions to buy, sell, hold or trade in securities, commodities and other investments involve risk and are best made based on the advice of qualified financial professionals. Any trading in securities or other investments involves a risk of substantial losses. The practice of "Day Trading" involves particularly high risks and can cause you to lose substantial sums of money. Before undertaking any trading program, you should consult a qualified financial professional. Please consider carefully whether such trading is suitable for you in light of your financial condition and ability to bear financial risks. Under no circumstances shall we be liable for any loss or damage you or anyone else incurs as a result of any trading or investment activity that you or anyone else engages in based on any information or material you receive through TradingView or our services.
@visionary.growth.insights
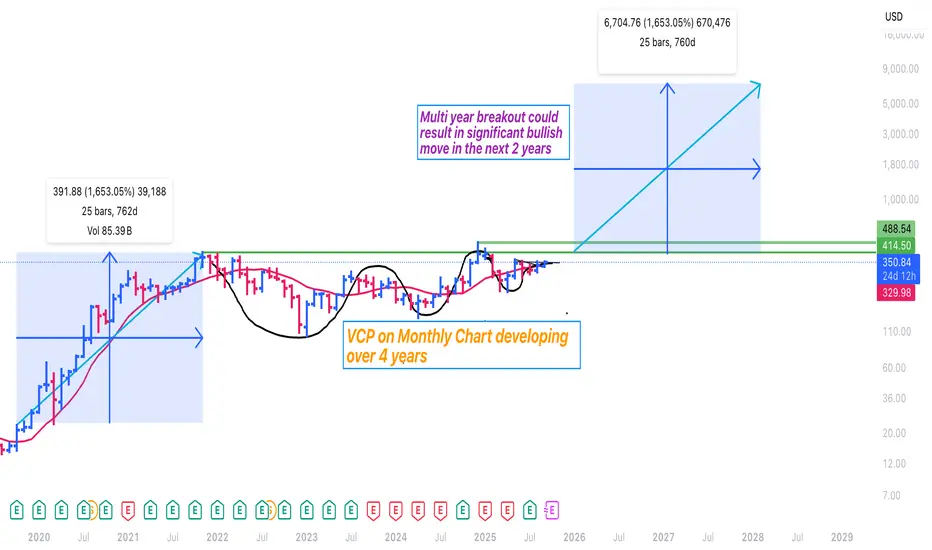
$TSLA showing multi year VCP & a breakout would be Bullish+++AB = CD pattern could emerge once broken out of this multi-year VCP / consolidation pattern that is developing in $TSLA.
Price action seem to indicate $280 - 310 is the likely bottom and odds favor a signficant move up!
Let's see how it pans out.
I am bullish.
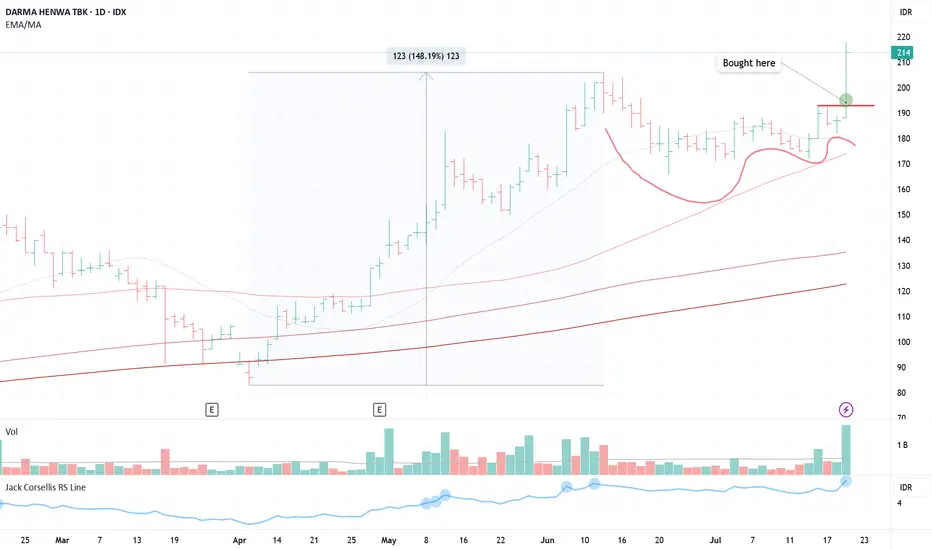
$DEWA (VCP - 6W 19/6 3T)Position update: July 21, 2025.
Key factors:
1. Confirmed stage 2 uptrend.
2. A textbook Volatility Contraction Pattern (VCP) with a clearly defined, low-risk entry point.
3.Currently forming a VCP following a prior price surge of nearly 150%, demonstrating strong momentum.
4. The stock moves on its own drummer, rallying close to 150% while the broader market advanced just 23%.
5. Displays high relative strength, outperforming sector and index benchmarks.
6. Volume has dried up, indicating less supply coming to the market.
7. Significant volume expansion on the breakout.
Considerations: Despite a favorable technical setup, risk should be managed diligently given the stock's sharp ascent and potential for profit-taking. Establishing stop-loss levels and monitoring market conditions is essential.
This is another quintessential VCP breakout with a clear pivot entry and minimal risk. I’m starting to see increased traction in the market now—a very positive sign to scale up trading size.
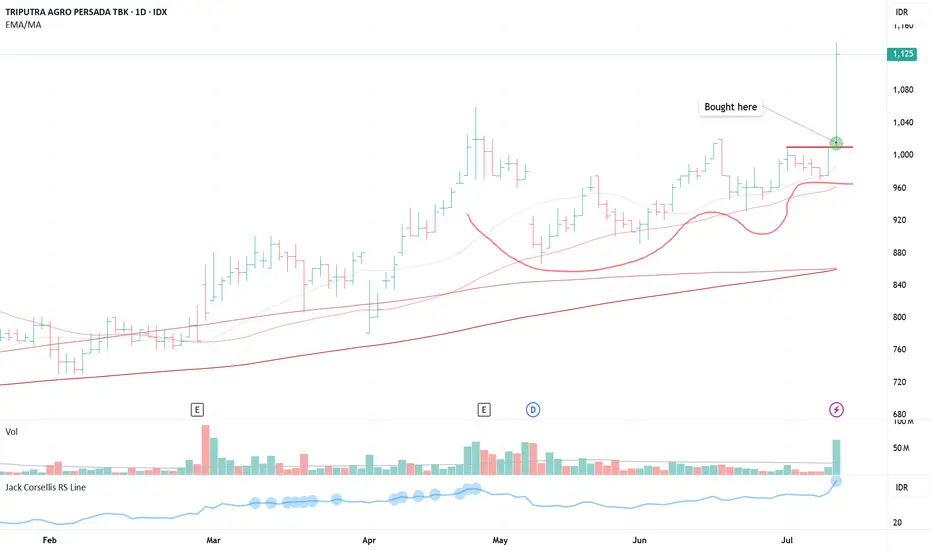
TAPG (VCP 10W 18/4 3T)Position update: July 9, 2025.
Key factors:
1. Confirmed stage 2 uptrend.
2. A textbook VCP setup with a clear, low-risk entry
3. Has absorbed its majority line of supply.
4. The stock moves on its own drummer, hitting an all-time high while the index struggles to reclaim its highs.
5. High relative strength.
6. Volume has dried up, indicating less supply coming to the market.
7. Strong fundamentals, with consistent triple-digit year-over-year earnings growth.
8. Significant volume surge on the breakout.
Considerations: Despite a favorable technical setup, risk should be managed diligently given the stock's sharp ascent and potential for profit-taking. Establishing stop-loss levels and monitoring market conditions is essential.
This is a quintessential VCP breakout with a clear pivot entry and minimal risk. I’m starting to see increased traction in the market now—a very positive sign to scale up trading size.
SUDARSHANCHEMSUDARSHANCHEM showing very good strength and consolidating since a month near ATH. Result is expected tomorrow on 25-Aug. If it declares bumper result then we may see next leg of steep rally. In recent time accumulation has been observed. Provided that if it closes above 1380 level then one may get very good risk-reward trade from hereon. Keep a stock in watch list. Just a small volume may push it above resistance line.

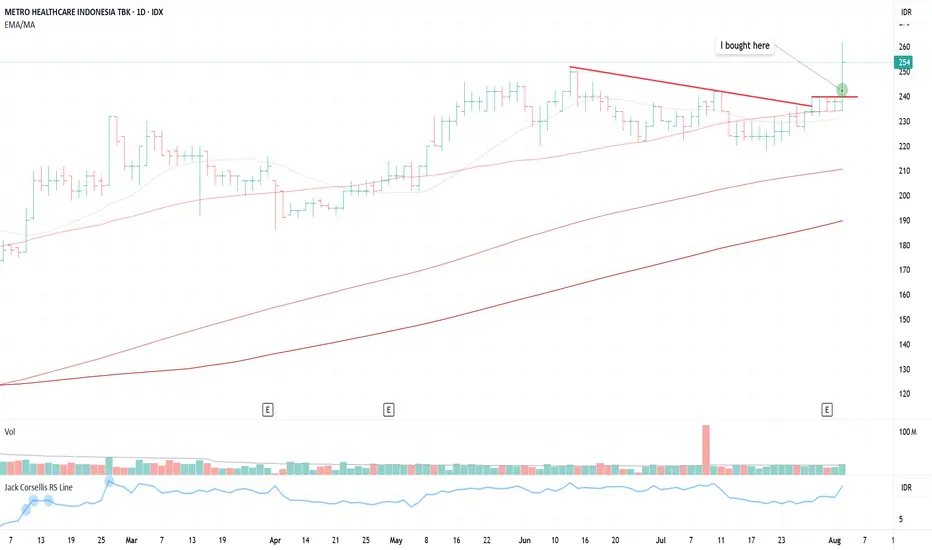
$CARE - CHEAT AREAIDX:CARE
Position Update: August 4, 2025
Key factors:
1. Low-risk entry point.
2. A rebase following a failed cup-and-handle formation, creating a potential cheat setup.
3. A confirmed Stage 2 uptrend, indicating upward continuation.
4. The stock is outperforming, rising even as the broader market trends lower.
5. Displays strong relative strength against the market and peers.
6. Volume dries up suggests less supply coming to the market.
7. Many stocks start showing traction based on my own stock continuum.
Considerations:
While the breakout was not accompanied by a significant volume surge, it is occurring in the early stages of what appears to be a new bull market cycle. This macro environment may support continued strength and follow-through.
I’ll be watching closely to see if it can hold up and follow through from here.
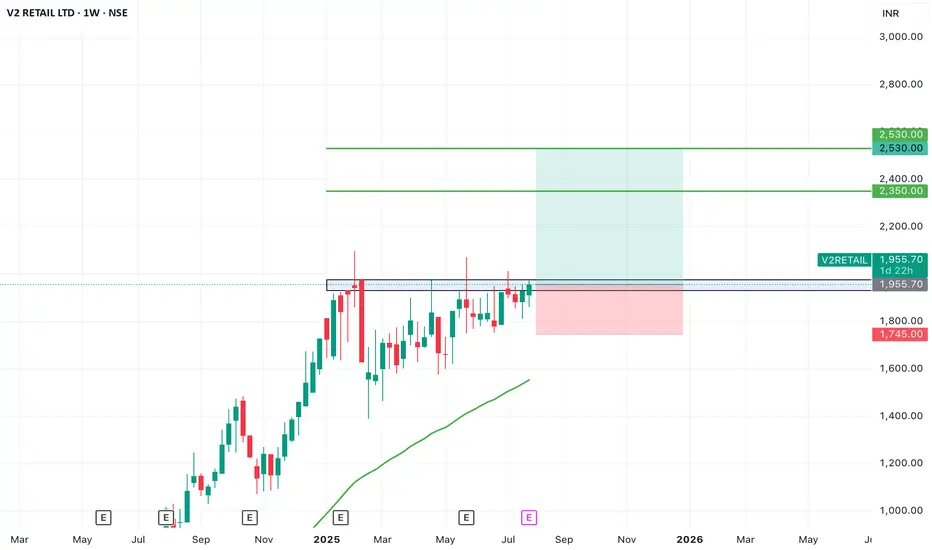
SWING IDEA - V2 RETAILV2 Retail , a small-cap value fashion retailer with a pan-India presence, is showing strong bullish momentum and a textbook swing trade setup backed by multiple breakout signals.
Reasons are listed below :
Breakout from a VCP (Volatility Contraction Pattern) – indicating accumulation and strength
Ascending triangle breakout – classic continuation pattern
Cleared major resistance zone, confirming bullish intent
Maintains a clear uptrend with higher highs and higher lows
Target - 2350 // 2530
Stoploss - weekly close below 1745
DISCLAIMER -
Decisions to buy, sell, hold or trade in securities, commodities and other investments involve risk and are best made based on the advice of qualified financial professionals. Any trading in securities or other investments involves a risk of substantial losses. The practice of "Day Trading" involves particularly high risks and can cause you to lose substantial sums of money. Before undertaking any trading program, you should consult a qualified financial professional. Please consider carefully whether such trading is suitable for you in light of your financial condition and ability to bear financial risks. Under no circumstances shall we be liable for any loss or damage you or anyone else incurs as a result of any trading or investment activity that you or anyone else engages in based on any information or material you receive through TradingView or our services.
@visionary.growth.insights
INDF - VCP (13W 10/3 3T)IDX:INDF - VCP
+)
1. Low risk entry point on a pivot level.
2. Volume dries up.
3. Price has been above the MA 50 > 150 > 200
4. Price is within 25% of its 52-week high.
5. Price is over 25% of its 52-week low.
6. The 200-day MA has been trending upwards for over a month.
7. The RS Rating is above 70 (71).
EPS Growth:
a. Quarterly QoQ: -
b. Quarterly YoY: +11.20%.
c. TTM YoY: +32.14%.
d. Annual YoY: +6.07%.
(-)
1. There is no significant breakout with substantial volume.
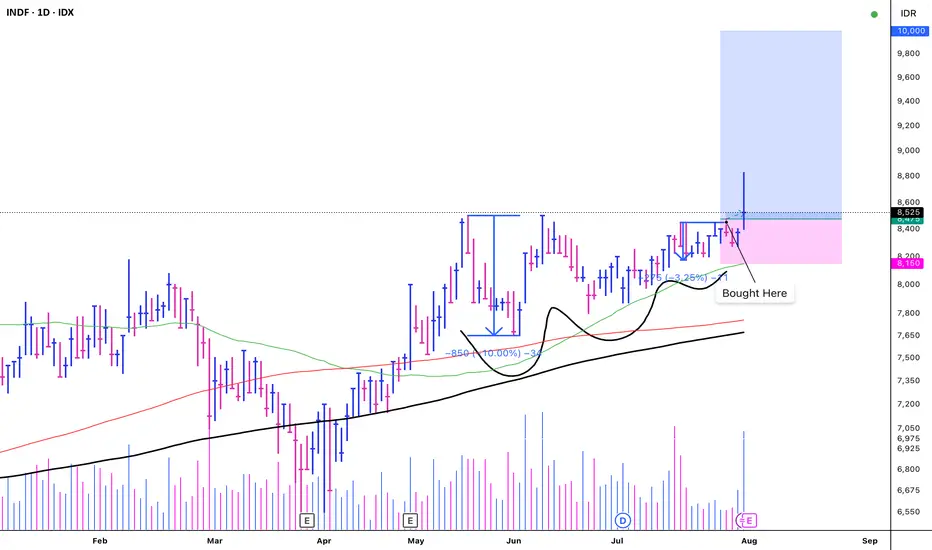
$INDF (VCP - 10W 10/3 4T)Position update: July 31, 2025.
Key factors:
1. Confirmed stage 2 uptrend.
2. A textbook Volatility Contraction Pattern (VCP) with a clearly defined, low-risk entry point.
3. Price action moves in the opposite direction of the declining general market.
4. The stock moves on its own drummer, rallying 30% to a new 52-week high, while the broader market declined 14%.
5. Volume has dried up, indicating less supply coming to the market.
6. Significant volume expansion on the breakout.
Considerations:
1. The percentage of stocks trading above their 200-day moving average stands at 51%—a positive sign and a strong indication of a potential bull market campaign.
2.Despite the technical strength, the stock squatted into the close, signaling potential weakness in the breakout. Risk should be managed carefully with appropriate stop-loss placement.
This represents a quintessential VCP breakout, offering a clean pivot entry with minimal risk. I’m seeing improved traction in my personal trades and have accordingly increased my position sizing at this stage.

HUBTOWNHUBTOWN giving trendline breakout with decent volumes. Support can be seen near 301-2 level. On upper side resistance may be nr 342-365. Stock has given around 80% return in last 1.5 months. So strong momentum is observed. Keep it on radar

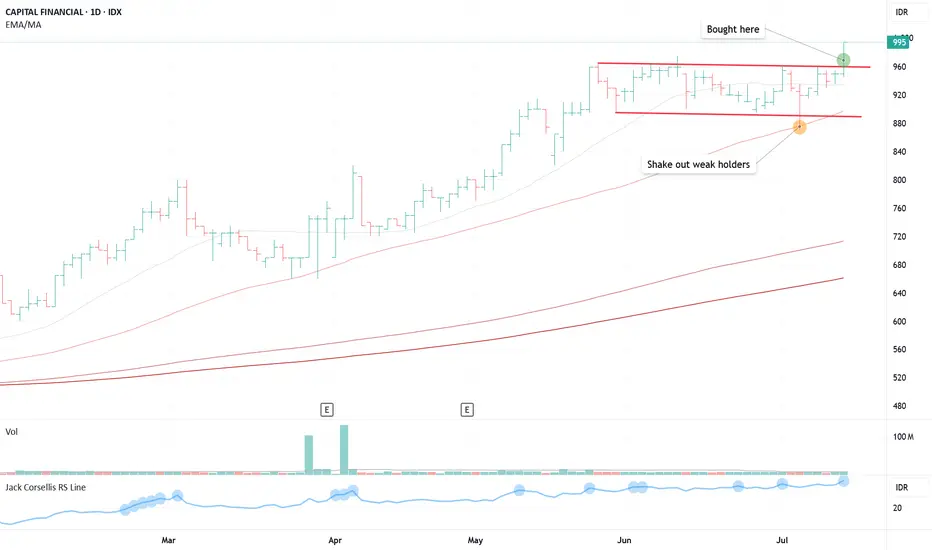
CASA - FLAT BASEPosition update: July 10, 2025.
Key factors:
1. Confirmed stage 2 uptrend.
2. A textbook Flat Base with a clear, low-risk entry.
3. The base has VCP characteristics.
4. The stock moves on its own drummer, hitting an all-time high while the index struggles to reclaim its highs.
5. A shakeout that weed out weak holders has strengthen the setup properly.
6. Volume has dried up, indicating less supply coming to the market.
7. Strong fundamentals, with consistent increased in year-over-year earnings growth.
Consideration: The breakout was not accompanied by a significant volume surge.
This is a classic Flat formation or Darvas Box Theory with a clear pivot entry and minimal risk. I’m starting to see increased traction in my personal trades—a very positive sign to trade larger in this market environment.
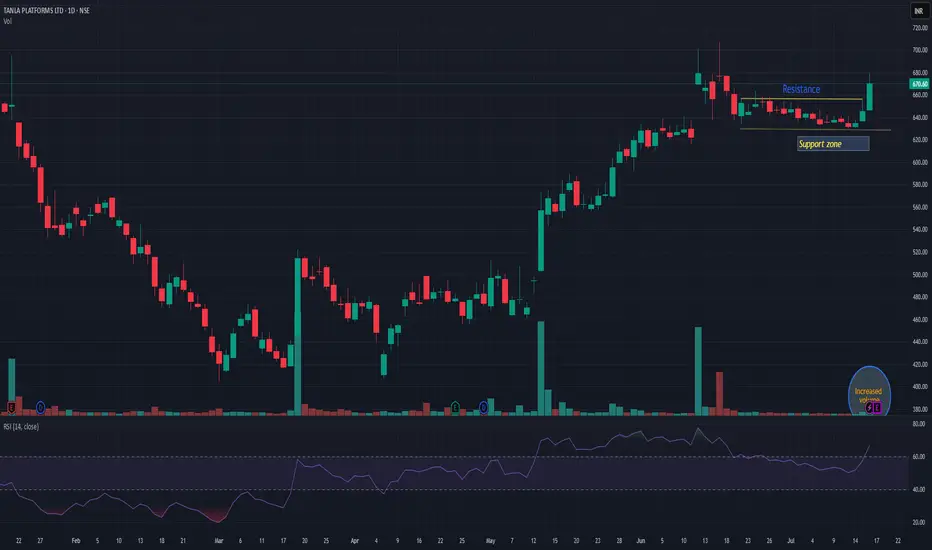
TANLATANLA giving resistance breakout with decent volume. Seems it may start momentum from here. 625-30 is strong support zone. below this my view may be changed. Risk-reward is quite in favor.
TAPG - VCP (11W 18/4 3T)IDX:TAPG - VCP
(+):
1. Low risk entry point on a pivot level.
2. Volume dries up.
3. Price has been above the MA 50 for over 10 weeks, with values exceeding 150, 200, and 300.
4. Price is within 25% of its 52-week high.
5. Price is over 30% of its 52-week low.
6. The 200-day MA has been trending upwards for over a month.
7. The RS Rating is above 70 (86).
8. There has been a significant breakout with substantial volume
**EPS Growth:**
a. Quarterly QoQ: -46.42%.
b. Quarterly YoY: +117.27%.
c. TTM YoY: +111.05%.
d. Annual YoY: +94.02%.
(-)
1. Trump Implements a 32% Increase in Tariffs on Indonesia
2. The market is volatile due to the ongoing war

MCK VCPNYSE:MCK testing 10-week VCP flat base at ATHs.
• Entry: 736.40 stop-limit on ⧁150 % vol
• Risk / Stop: 711 (1 % acct risk)
• Target: 805–820 (3.5 R, 2-4 wk swing)
Thesis: Health-services sector strength + low-beta alpha.
#MCK #trading

$BSX VCP-style ascending triangleBoston Scientific (BSX)
Pattern
VCP-style ascending triangle. Three higher lows have squeezed price against the 108 ceiling while volume dries up each contraction.
Trigger & Risk Plan
• Buy-stop: 108.15 on ≥150 % average volume
• Stop: 102.00 (handle low / rising trend-line)
• Starter size only; add 25 % more if price closes above 110.50 the same day.
Reward Map
Measured triangle target 118 — followed by the cup-handle projection near 124-129 if momentum really kicks.
Why I Like It
• Relative strength already outperforming XLV and SPX.
• Medical-device peers SYK and MDT quietly firming — sector tailwind.
• “Overbought” RSI is a feature, not a bug, right before real breakouts.

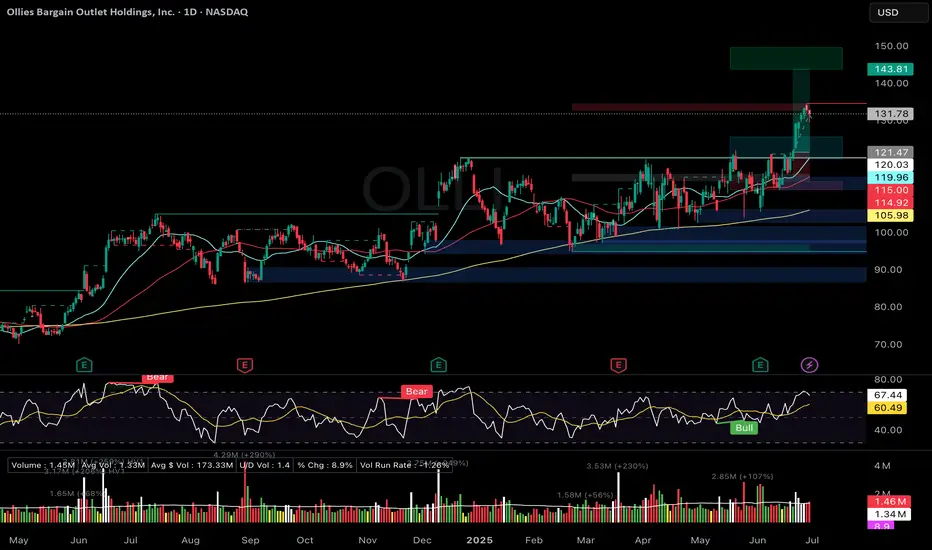
Case Study: Banking a +7 % Pop on OLLI’s VCP/ Ascending TriangleMomentum in discount retail has been stealth-strong all quarter, so when Ollie’s Bargain Outlet (OLLI) flashed a textbook volatility-contraction break I pulled the trigger. Below is the full play-by-play, numbers included, plus the process tweaks I’m carrying into the next trade.
1. The Setup
• Pattern: VCP-style ascending triangle under 121 resistance
• Context: Post-earnings drift sideways, volume drying up each contraction
• Catalysts: Strength across discounters (DG, WMT, DLTR) and bullish seasonality
• Risk: 1 % of account, stop pre-defined at 115
2. Execution
• 20 Jun – Stop-limit filled at 121.01 once intraday volume hit 2.6× ADV
• 24 Jun – Trimmed 3 sh at 129.13 (+6.7 %) to “feed the monster” and recycle BP
• 30 Jun – Trailing stop (ratcheted daily) closed remaining 7 sh at 129.94
3. Results
• Gross P&L: +86.89 USD, +7.18 % on position
• R-multiple: +1.45 R on initial risk
• Expectancy (TraderSync): +3.83 % — proof the process carries a positive edge
4. What Went Right
• Bought only after volume confirmed the breakout
• Stop never widened—only tightened
• Early partial locked in reward and removed emotional pressure
5. Improvement Plan
• Keep a 10 % “runner” until first close below 10-EMA or heavy distribution day
• Back-test a +25 % add on day-two follow-through (+2 % price, >1.5× volume)
• Simplify order flow by defaulting to single OCO brackets
NASDAQ:OLLI