Maintaining purchases at the turn of the yearThe market has perfectly worked out the scenario outlined in the last review, and buyer activity is growing. We are approaching the end of the year, and we will consider the near-term prospects. On average, the market consolidated in anticipation of determining the opening level of a new annual candle for ETH and BTC. As I expected, ETH opened the second half of the month in the neutral zone, which smooths out sales. There is also a strong bullish signal for a retest of 3500. BTC has reached strong medium-term support around 85k, from which the probability of a rollback to a retest of 100k prevails, which I described in the last review. We have already seen one pullback, but there is still a possibility of an attempt to break through 100k after the opening of a new annual candle. Against the background of preparations for a new wave of purchases at the beginning of the year and the struggle for the closing level of the year, the probability of a new test of the range of 3100-3500 ETH prevails.
A pullback in brent with consolidation above $ 60 also inspires optimism among buyers. If the year opens above this level, a very rapid reaction of the cryptocurrency market with a large wave of purchases is likely. However, most of the market, especially large-cap coins, still retains the potential for a turnaround to a clear bull run, which may linger until the next seasonal bullish period in February. With this picture, it is worth carefully weighing the growth potential before additional purchases today and giving preference to heavily oversold assets with high technical goals for retest and slow issuance.
Today, I still prefer TURTLE NFP HOOK NTRN VIC MITO ENSO BMT SHELL, for which the growth potential is higher than the rest of the altcoin market, which may contribute to growth similar to RESOLV or STO in the near future. Among the coins with the tag monitoring for work, I consider only CHESS, which has high technical signals for retest up to 0.10-15.
Against the background of the annual rollback in CHZ, the probability of a bullying in fan tokens is also increasing. ATM ACM CITY JUV looks especially interesting. However, the dynamics of CHZ in the second half of the year is quite negative, I recommend working with fan tokens in a small volume and not increasing turnover if there are older unclosed positions.
VIC

Growth up to 200% according to NFPTo date, the market continues to move exactly according to the scenario that I outlined in the last review. On Monday and Tuesday, the probability of a flat with sales attempts prevails, but from the middle of the week I expect the bullish trend to continue as part of a pullback on the annual candle and seasonal growth with an attempt to consolidate in the range of 3250-3500 ETH.
This week, NFP and SHELL reached medium-term supports, which I am now taking into account to work alongside TURTLE NTRN MITO VIC ENSO HOOK BMT. At the moment, 50% of tokens are already in circulation with further smooth unlocking, which will put minimal pressure on the price. In the future, the area for reliable scalping will shift slightly next year. For this instrument, there are long-term technical signals for growth up to 0.35-45, that is, 10X+. However, with the current bear market, we can still expect an attempt to retest the 0.060-75 range with a further pullback and resumption of growth in a new annual candle, which can already bring up to 150% profit. The intermediate resistance is the 0.05 level. If the daily or weekly candle opens higher, an active continuation of growth is likely. The opening of the second half of the month above this level will also be a signal for support.

An Attempt at Seasonal Market Growth and BTC RollbackTo date, we have reached another bifurcation point in the market and it's time for another review. So far, there is a share of positivity in the market situation. As I wrote earlier, there is strong medium-term support for BTC in the 85-90k zone, from which a rollback is likely. Unfortunately, last month we broke through the 85k level, which is a signal for a possible test of 75k in the spring. However, the probability of a rollback from 85k to 90-100 still prevails. The broadcast opened the month ambiguously. According to Asian time, the opening is in the negative zone below 3000, higher in the neutral zone at GMT. I think the market will move this month based on the bullish BTC signal, and the coins will continue to move in different directions.
The seasonal growth period in the first half of December is also a positive signal. Once again, I would like to draw attention to the background trigger used by the United States to manipulate the market - brent oil. At the last bifurcation point, prices still collapsed, despite the positive data on US stocks, to which ETH immediately reacted with a consolidation below 3k, as I warned in the review. The current monthly candle opened above the interim support of $ 62.5, against which there is a signal for growth in the first half of the month at least.
As a result, we have signals for new growth waves for individual altcoins that have reached supports and have high growth goals, as part of seasonal growth, attempts to rollback BTC with oil and rollback according to the annual schedule. However, most of the alcoins, especially those with high capitalization or upcoming aggressive issuance, will not have time to show significant growth in this short period and will continue the medium-term bearish trend. Be careful with new purchases in the next couple of weeks. Today - tomorrow is the time when coins draw a shadow down the new monthly candle, but starting tomorrow evening or Wednesday, the probability of a reversal for individual coins will increase. If positive oil data is released in the middle of the week, then the growth of the crypt is likely to accelerate steadily by the end of the week, with a continuation in the next weekly candle. Next, the opening zone of the second half of the month will be of great importance.
For altcoins, in the event of a reversal attempt, the minimum target will be to overshoot the last monthly candle. For work today, I am considering the TURTLE NTRN ENSO VIC MITO BMT HOOK first of all. These tools were recently listed on binance, which reduces the threat of delisting hanging over projects from 20-22. The issue of these instruments is also smooth, which reduces the likelihood of further large drawdowns. Given today's circulating supply, these instruments are already in an oversold position and the likelihood of a reversal to growth at the slightest provocation from the market prevails. They also previously provided strong technical signals for growth up to 300%+, which will be worked out in the medium term.
Secondly, I am considering CHESS UTK COS DATA QUICK FIO for scalping, which can give new growth waves of up to 40-50% at least, but I recommend using a smaller position size for them. CHESS has been assigned the monitoring tag, but there are strong technical signals for a 0.1 retest, which is why a large exit pump is likely. After that, I will no longer consider using the token.
BMT has prepared up to 400% growth In this review, I will consider in detail the BMT, which I previously took into account. First of all, it is worth noting the issue of this token. At the moment, 50% of tokens have already been unlocked and further issuance is slowing down, which will not put significant pressure on the price. For the next year, the 0.0250 level will remain the main support from which attempts will be made to gain a foothold above 0.05. A very important signal is the opening of the half-year above 0.125, which may lead to a sharp reversal of the half-year candle up to this level. If low volatility persists, the range of 0.100-125 will remain a medium-term target for retest and will be worked out, but with a possible pullback. On a smaller scale, the second half of the quarter opened above 0.0250, which is a signal for a test of 0.050-75. As a result, there is a fairly high probability of an attempt to close the current monthly candle above 0.05, with the trend continuing in the new month. After a local break in the 0.075-90 region, there is a high probability of a rollback to a 0.05 retest followed by an attempt to resume growth.
TURTLE MITO VIC NTRN ENSO CHESS HOOK has a similar growth potential today.

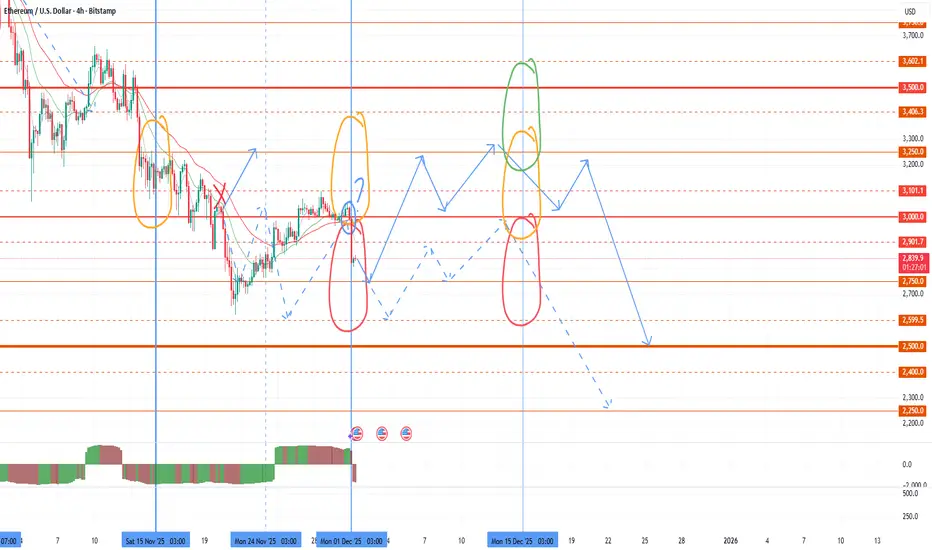
Opportunities for market growth at the end of the yearToday we have reached a new major bifurcation point in the middle of the quarter, which I have focused on. For individual coins, starting in the middle of this week, the probability of a bullish quarterly candle reversal with large growth waves will increase, similar to RESOLV and TNSR. Such reversals will be facilitated by a slowdown in the fall of ETH with attempts to change the trend before the end of the year.
So far, the bearish influence has prevailed in the market, with the opening of most major periods below key resistances and stable sales until the middle of the quarter to consolidate below 3,500, which I will indicate in the latest review. The ultimate goal of the bears in this quarter is to test the range of 2500-2750, with an attempt to close the annual candle in it under a negative scenario, and against the background of consolidation below 3500, this goal is still relevant. By the end of the month, we may still see new sales impulses to break through 2750, but with increasing buying activity at the end of each week, against which individual coins will try to grow. The second half of the quarter for ETH opened below 3,250, which gives a signal for sales below 3,000 up to 2,500, but an opening above 3,100 is a technical signal for growth up to 3,500-4,100. The attempt to reverse the quarterly candle is also facilitated by its opening above 4,100.
And so, under an optimistic scenario and a stable transition to a reversal of the quarterly candle in the second half of the week, purchases can be expected until the end of the week, with the aim of opening a new week above 3250, which will ensure continued growth until the end of the month and the possibility of opening a new month with a growth signal before the end of the year. With less volatility, there is a chance of opening a new week below 3,100, which could lead to a reversal next week.
As I wrote in a review at the beginning of October, BTC opened the quarter negatively, with a pullback signal down to 90-100 k, which the bears successfully worked out. There is a large medium-term support in the 85-90k zone, from which a pullback is likely. In addition to the growth of the altcoin index and the growth of ETH/BTC, which I expect at the turn of the quarter, the slowdown in the decline of BTC will also cease to put pressure on the market and allow individual coins to show major reversals.
Brent may once again have quite a big impact on the markets. If today and tomorrow the price fixes above $ 64 and, moreover, above $ 65, then the probability of growth of the crypt will prevail until the close of the week. In the event of US manipulation and a sudden new wave of brent sales below $62.5 today or tomorrow, there will be a chance for an ETH reversal before the weekend. Given the released data on stocks in the United States, the probability of a positive scenario prevails. All markets are connected, and no matter how absurd it may seem at first glance, it was the background manipulation of the commodity price that allowed the bears to break through key supports on ETH more than once, both on October 10 at 4,100, and at the subsequent 3,500, 3,250 and 3,100. By superimposing the dynamics of brent in the second half of the week on the dynamics of ETH by the weekend, you can see a chain reaction. That is why by the second half of October, I predicted a drop down to 3,500 by the end of the week, in the event of a drawdown of brent to $ 60.
Against the background of a slowdown in the fall of ETH and attempts to reverse the quarter, it is possible to make regular toppings for individual coins. First of all, it is worth paying attention to TURTLE and MITO, which have strong technical signals for growth up to 0.21-25 in the medium term. So the potential is the ground for dynamics similar to RESOLV. VIC BMT HOOK CHESS also has slightly weaker technical signals for growth, which I am also considering working with in the first place. On an attempt to reverse the quarter, there is a high probability of their growth to 50-70%, at least with the aim of breaking the last monthly candle. In the case of a stable ETH reversal, growth impulses of up to 200%+ can be expected.
Similarly, growth waves of up to 40-50% may show weaker instruments that do not have obvious signals, but are in an extremely oversold zone, such as QUICK COS FIO DATA. In my opinion, these tools are candidates for the assignment of the monitoring tag, given the dynamics, and therefore I recommend using a small position when working with them.
In addition to the positive note towards the end of the year that has appeared at the moment, I would like to focus on the overall negative dynamics of the market, which may continue at the beginning of the year. The current likely pullback on the quarterly and annual candles is still a temporary phenomenon and gives opportunities to coins that have technical growth signals left earlier. Most of the market, after attempts to roll back the tops at the turn of the year, is likely to continue falling until the second quarter. That is, coins without obvious growth signals, especially those with large capitalization, may remain flat until January or February without significant purchases followed by a major break.

Up to 150% on TURTLEToday, against the background of the general market pullback, new options are being formed for medium-term investments and scalping on coins recently added to binance. I would like to draw attention to TURTLE, which has reached probable medium-term support in the range of 0.085-100. With the current issue from this range, the probability of a price reversal prevails for at least a retest of large purchase volumes around 0.21. Today, the first investments have already been made to reverse the trend, more stable purchases can be expected in the second half of this week with the consolidation of ETH above 3,100. Also, as you pass through the middle of the quarter, there is a high probability of an attempt to reverse the quarterly candle both for the tops and for individual coins. A test of the lower support of 0.060-75 for TURTLE is possible only with an additional drawdown of ETH to the test of 2500-2600, which is less likely so far. From this range, a rapid price recovery above 0.1 is likely, which will serve as a good opportunity for additional scalping in addition to the main position. In case of a successful reversal of ETH from 3100-3250 to the 4100 retest on TURTLE, there is a fairly high probability of testing the range of 0.21-25.
The MITO VIC BMT HOOK has also reached levels for a new trend reversal attempt, which I am also considering working on. They can be used to top up in addition to the main position to take a reversal attempt up to 30-60%.
ADX and PIVX, which I recommended earlier, have performed well, but I am not considering them for further work, since the target levels for them have been worked out and it is possible to add the monitoring tag further.

Further market dynamicsTo date, the market has fully fulfilled its targets at the 3500 retest against the background of brent leaving below 64. Further, until the second half of Sunday, the probability of purchases up to the 4500 retest prevails. An important guideline for further dynamics will be the opening level of the new week and the second half of the month. If these periods open at least above 4,100, the probability of a flat and maintaining the market with the possibility of a breakout next month will remain. With weak purchase dynamics, there is a chance of opening the second half of the month below 4,100. In this case, in any case, we will see purchases before the end of the month for a pullback on the monthly candle, but then the market will consolidate around 3500. The available technical signals currently outweigh the bullish scenario. In this case, individual coins will turn the current month into a bullish one with significant interruptions.
The main contenders for this month's move are MITO VIC BMT HOOK, which are highly unlikely to be contenders for the monitoring tag and are more suitable for medium-term investments. It is also possible to consider scalping in the short term CHESS FIO COS QUICK DATA, which have reached supports and can show a deeper drawdown only when the ether falls below 3500. A signal has been left for a move to the ADX, however, there is a possibility of a deeper drawdown to 0.075-85 before the reversal.

Following PIVX, we take the X's on the HOOKAs I have already written, you should not try to jump on the departed train on pivx, which I recommended for purchase for more than a month, it is better to consider the options where the X's are just being prepared. First of all, they include CHESS HOOK BMT MITO VIC.
Consider the position of the HOOK. After listing on binance, the token left several strong technical signals for a retest up to 0-50-75, which is highly likely to lead to a major growth wave. The growth momentum last week was only the first investment in the upcoming trend. An uptrend line has been formed and there is a high probability of an attempt to consolidate above it before the end of this month. The quarter opened in a mixed zone, an opening above 0.09 gives a signal for growth up to 0.15, however, an opening below 0.1 is likely to give pullbacks in the event of a sharp increase. The main long-term support for the current issue is the 0.0750-850 range, from which there was a rebound after a long-term rebidding. A hike below this range is likely only with an additional significant drawdown of ETH. The most likely target is an attempt to close the current monthly candle above 0.21-21 in order to continue the trend in the new month. With negative overall market dynamics, there is a possibility of a pullback from 0.21-25. In this case, in the new month, we can expect a new attempt to return to the trend line from 0.110-125, which will provide an additional opportunity for scalping.

MITO is ready to repeat the achievements of STOStarting this weekend, the probability of new waves of growth in alcoins is growing, and I want to consider the situation with the coins that I keep in mind for work.
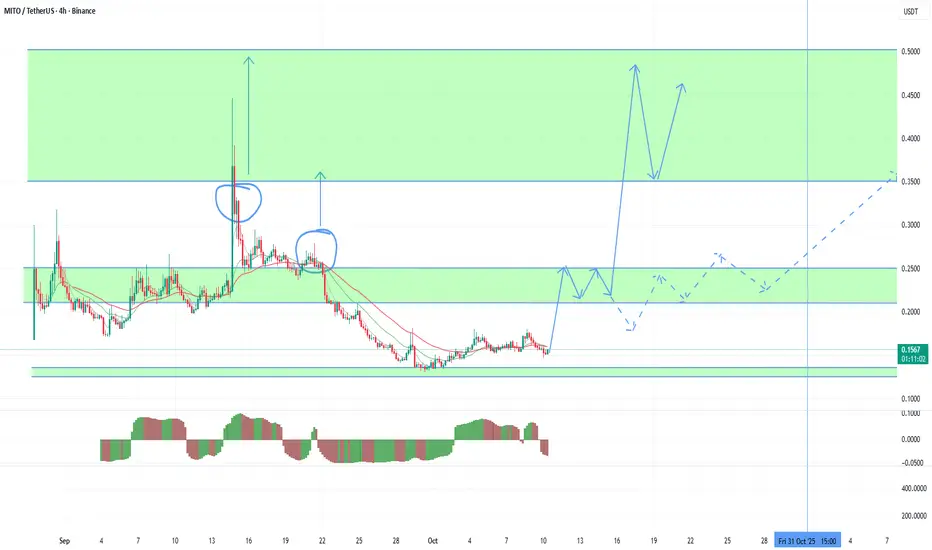
First of all, I will consider more reliable options for working in the mid-range, where you can hold a position from current levels and top up in case of a test of lower support in a falling market, such as the MITO VIC HOOK BMT. In this review, I will pay attention to MITO, which can repeat the STO picture this month. With the current issue, the main support is the range of 0.125-35, below which a fall is possible only if ETH falls to 3500-3750, which will create a good opportunity for additional confident earnings. This week, the 4750 level was re-broken for ETH, which is a signal for a second attempt to break 5000. It is more likely that this attempt will be made as early as next month. However, reducing the threat of a further drop in ether is already giving rise to purchases on MITO. And so purchases can be kept from the current levels, as there has been a rebound from the main support. In an optimistic scenario, a sharp increase may begin as early as this weekend with the closing of the weekly bullish candle and the continuation of the trend in the new week. The immediate goal is to return to the resistance in the range of 0.21-25, after the rebidding, which will open the possibility for a test of 0.35-50. This range is the main target for current emissions. With the negative dynamics of ETH, there is a possibility of a decrease in growth rates. In this case, we can see a significant pullback from 0.25 with the continuation of the trend after the opening of a new monthly candle above 0.21.
Among the weak coins, PIVX proved to be the main option for working with the greatest growth potential. There was an open zone until the 0.35-50 test, however, the breakdown occurred against a rather negative opening of the quarter, which is highly likely to lead to sharp disruptions in growth. Also, this token is essentially a dummy and carries only speculative interest, being a potential contender for adding the monitoring and delisting tag. I will consider it back to work only after returning to the range 0.100-125. However, this weekend the trend may still hold against the background of the absence of further decline in ETH.
Among similar coins with weak dynamics, the probability of assigning the monitoring tag, but high undeveloped targets are chess with a probability of growth up to 100%+ from current levels and ADX FIO with a potential for growth up to 50%+ from current levels, but also an additional drawdown before rising to 20-25%.
ATM ACM CITY JUV fantokens have a similar growth potential to PIVX. However, it is worth bearing in mind the extremely low liquidity and long accumulation of these instruments when choosing a position size.
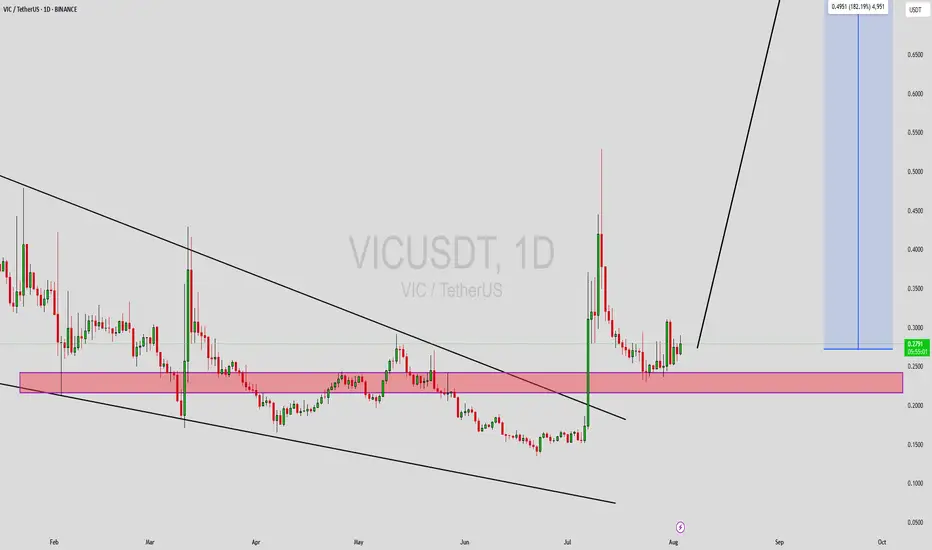
VICUSDT Forming Descending ChannelVICUSDT is currently showing a classic descending channel pattern, which often signals a potential bullish reversal upon breakout. After a sustained downtrend, the price appears to be stabilizing and respecting the lower boundary of the channel, while volume remains healthy. This combination of falling price within a defined channel and consistent volume is often a precursor to an explosive breakout. A breakout above the upper resistance line of this descending structure would validate a trend reversal and trigger a wave of bullish momentum.
What makes VICUSDT particularly compelling is the aggressive profit potential of 140% to 150%+. This high reward expectation aligns with typical breakouts from descending channels, especially when paired with strong investor interest and favorable market conditions. The technical setup suggests that the asset is currently undervalued, and any breakout move could quickly be followed by a sharp rally as buyers rush to capitalize on the momentum.
Recent market sentiment around VICUSDT has turned positive, with increasing attention from retail traders and investors alike. As capital rotates into mid-cap altcoins showing strong breakout formations, VIC is positioned to benefit significantly. Traders should closely watch for confirmation of a breakout with strong candle closes above the upper trendline and rising volume. That would be the green light for entering long with a well-defined risk.
This is a prime candidate for traders who prefer breakout setups and are seeking high-risk, high-reward opportunities. Given the technical indicators, volume support, and increasing investor interest, VICUSDT could be one of the most explosive plays in the coming sessions.
✅ Show your support by hitting the like button and
✅ Leaving a comment below! (What is You opinion about this Coin)
Your feedback and engagement keep me inspired to share more insightful market analysis with you!
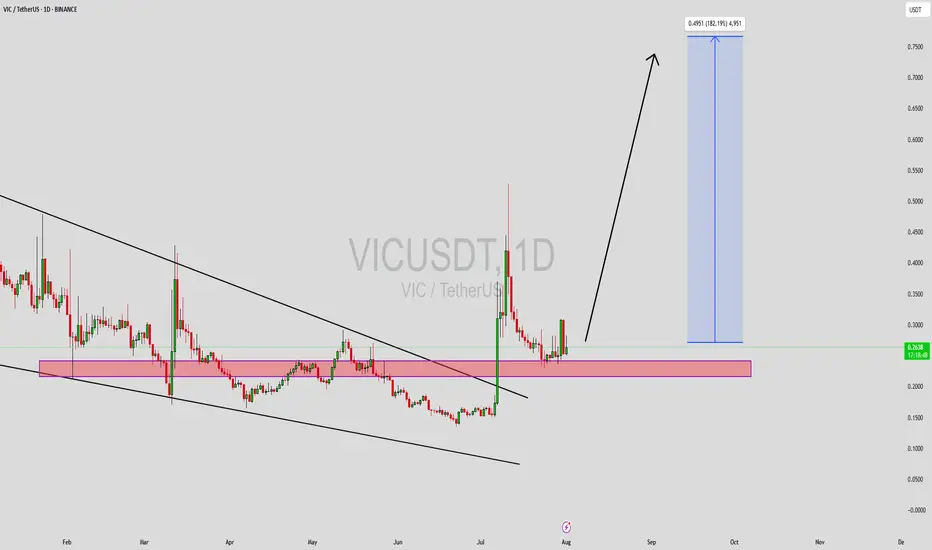
VICUSDT Forming Descending WedgeVICUSDT is currently displaying a classic descending wedge pattern, which is often recognized as a bullish reversal signal in technical analysis. This pattern typically emerges after a prolonged downtrend, and when paired with good volume — as we’re now seeing — it suggests that selling pressure is weakening and a breakout to the upside could be imminent. VIC has respected its wedge boundaries well, and now it's approaching the breakout zone, making this an ideal time for technical traders to watch closely.
Volume has been steadily increasing, which supports the idea of accumulation at the current levels. This convergence of price and volume dynamics signals that smart money may be positioning itself ahead of a potential rally. Based on the measured move from this wedge pattern, a 140% to 150% gain could be on the horizon once confirmation of breakout is secured. The price is also hovering near historical support, which adds another layer of confluence to the bullish outlook.
With investor interest rising and sentiment shifting, VICUSDT has the potential to outperform in the coming sessions. Altcoins that consolidate in well-defined reversal patterns and attract volume are often primed for explosive moves. Traders looking for setups with strong technical structure, breakout confirmation, and momentum alignment may find VICUSDT to be one of the top candidates for mid-term gains.
This is a high-reward opportunity for patient and disciplined traders. Keep an eye on resistance breakout levels and volume surges, as they may trigger the start of a powerful trend reversal.
✅ Show your support by hitting the like button and
✅ Leaving a comment below! (What is You opinion about this Coin)
Your feedback and engagement keep me inspired to share more insightful market analysis with you!
Viction Hits Bottom, 1,228% Growth Potential or HigherViction produced the highest volume ever on the 10-March week. All the other weeks have insignificant volume compared to this one and this session ended closing green. This is a strong signal.
A large part of the altcoins market produced a bottom 10-March.
Another signal that favors the bulls and the development of a bullish wave is the fact that bearish volume is very low as the market moves to produce lower lows. The final bottom happened last week and this week VICUSDT is full green.
There is a falling wedge pattern.
Seeing marketwide action and knowing the year is 2025 and we are already late for the bull market phase, we can be ready and should be prepared for maximum growth.
Thank you for reading.
Namaste.

#VIC/USDT#VIC
The price is moving within a descending channel on the 1-hour frame and is expected to continue upward.
We have a trend to stabilize above the 100 moving average once again.
We have a downtrend on the RSI indicator, which supports the upward move by breaking it upward.
We have a support area at the lower limit of the channel at 0.2680.
Entry price: 0.2865
First target: 0.3100
Second target: 0.3346
Third target: 0.3600

ALTCOINS TO WATCH - INSANE VOLUME SPIKE! BIG MOVE LOADING?🚀 VICUSDT – INSANE VOLUME SPIKE! BIG MOVE LOADING? 🚀
“This is not just a volume increase. This is a 3,061% SPIKE. Smart money is moving—are you paying attention?”
🔥 Key Points:
✅ Massive Volume Surge – This isn’t retail noise. Someone BIG is making a move.
✅ Blue Boxes = Strong Support – But don’t just buy blindly!
✅ CDV & LTF Breakouts = Must-Have Confirmation – We only enter when the market tells us it’s ready.
💡 The Game Plan:
Watch lower time frame (LTF) breakouts for entry triggers.
If CDV confirms, we have a high-probability trade.
No confirmation? No trade. Simple.
“The market doesn’t wait. The best setups don’t last. Be early, be smart, and execute like a pro.” 🔥🔥🔥
I keep my charts clean and simple because I believe clarity leads to better decisions.
My approach is built on years of experience and a solid track record. I don’t claim to know it all, but I’m confident in my ability to spot high-probability setups.
If you would like to learn how to use the heatmap, cumulative volume delta and volume footprint techniques that I use below to determine very accurate demand regions, you can send me a private message. I help anyone who wants it completely free of charge.
I have a long list of my proven technique below:
🎯 ZENUSDT.P: Patience & Profitability | %230 Reaction from the Sniper Entry
🐶 DOGEUSDT.P: Next Move
🎨 RENDERUSDT.P: Opportunity of the Month
💎 ETHUSDT.P: Where to Retrace
🟢 BNBUSDT.P: Potential Surge
📊 BTC Dominance: Reaction Zone
🌊 WAVESUSDT.P: Demand Zone Potential
🟣 UNIUSDT.P: Long-Term Trade
🔵 XRPUSDT.P: Entry Zones
🔗 LINKUSDT.P: Follow The River
📈 BTCUSDT.P: Two Key Demand Zones
🟩 POLUSDT: Bullish Momentum
🌟 PENDLEUSDT.P: Where Opportunity Meets Precision
🔥 BTCUSDT.P: Liquidation of Highly Leveraged Longs
🌊 SOLUSDT.P: SOL's Dip - Your Opportunity
🐸 1000PEPEUSDT.P: Prime Bounce Zone Unlocked
🚀 ETHUSDT.P: Set to Explode - Don't Miss This Game Changer
🤖 IQUSDT: Smart Plan
⚡️ PONDUSDT: A Trade Not Taken Is Better Than a Losing One
💼 STMXUSDT: 2 Buying Areas
🐢 TURBOUSDT: Buy Zones and Buyer Presence
🌍 ICPUSDT.P: Massive Upside Potential | Check the Trade Update For Seeing Results
🟠 IDEXUSDT: Spot Buy Area | %26 Profit if You Trade with MSB
📌 USUALUSDT: Buyers Are Active + %70 Profit in Total
🌟 FORTHUSDT: Sniper Entry +%26 Reaction
🐳 QKCUSDT: Sniper Entry +%57 Reaction
📊 BTC.D: Retest of Key Area Highly Likely
I stopped adding to the list because it's kinda tiring to add 5-10 charts in every move but you can check my profile and see that it goes on..

VICUSDT(VICTION) Updated till 12-03-25VICUSDT(VICTION) Daily timeframe range. we can see a decent pull back from its new low. and making 0.1825 its recent support. it will be more optimal here if PA can get a valid close above 0.3187. fails their will send it back to trouble zone.

VICUSDT Explodes with 1100% Daily Volume Surge – Big Moves !VICUSDT Analysis
Massive Volume Surge and Key Bullish Zone
"VICUSDT is catching fire with an incredible 1100% daily volume increase. This is the kind of action that smart traders watch closely."
Why This Matters:
Green Line Zone: Around the green line, I see a great opportunity to go bullish. These levels aren’t just good; they’re promising.
Volume Power: Such a volume spike shows strong interest and potential for a major upward move.
Key Observations:
"As always, I will wait for confirmation in the form of lower time frame upward market structure breaks. CDV, volume profile, and other data will guide the entry."
This could be a fantastic opportunity. Smart money is active, and so should you be! 🚀
Let me tell you, this is something special. These insights, these setups—they’re not just good; they’re game-changers. I've spent years refining my approach, and the results speak for themselves. People are always asking, "How do you spot these opportunities?" It’s simple: experience, clarity, and a focus on high-probability moves.
Want to know how I use heatmaps, cumulative volume delta, and volume footprint techniques to find demand zones with precision? I’m happy to share—just send me a message. No cost, no catch. I believe in helping people make smarter decisions.
Here are some of my recent analyses. Each one highlights key opportunities:
🚀 RENDERUSDT: Strategic Support Zones at the Blue Boxes +%45 Reaction
🎯 PUNDIXUSDT: Huge Opportunity | 250% Volume Spike - %60 Reaction Sniper Entry
🌐 CryptoMarkets TOTAL2: Support Zone
🚀 GMTUSDT: %35 FAST REJECTION FROM THE RED BOX
🎯 ZENUSDT.P: Patience & Profitability | %230 Reaction from the Sniper Entry
🎯 DEXEUSDT %180 Reaction with %9 Stop
🐶 DOGEUSDT.P: Next Move
🎨 RENDERUSDT.P: Opportunity of the Month
💎 ETHUSDT.P: Where to Retrace
🟢 BNBUSDT.P: Potential Surge
📊 BTC Dominance: Reaction Zone
🌊 WAVESUSDT.P: Demand Zone Potential
🟣 UNIUSDT.P: Long-Term Trade
🔵 XRPUSDT.P: Entry Zones
🔗 LINKUSDT.P: Follow The River
📈 BTCUSDT.P: Two Key Demand Zones
🟩 POLUSDT: Bullish Momentum
🌟 PENDLEUSDT.P: Where Opportunity Meets Precision
🔥 BTCUSDT.P: Liquidation of Highly Leveraged Longs
🌊 SOLUSDT.P: SOL's Dip - Your Opportunity
🐸 1000PEPEUSDT.P: Prime Bounce Zone Unlocked
🚀 ETHUSDT.P: Set to Explode - Don't Miss This Game Changer
🤖 IQUSDT: Smart Plan
⚡️ PONDUSDT: A Trade Not Taken Is Better Than a Losing One
💼 STMXUSDT: 2 Buying Areas
🐢 TURBOUSDT: Buy Zones and Buyer Presence
🌍 ICPUSDT.P: Massive Upside Potential | Check the Trade Update For Seeing Results
🟠 IDEXUSDT: Spot Buy Area | %26 Profit if You Trade with MSB
📌 USUALUSDT: Buyers Are Active + %70 Profit in Total
🌟 FORTHUSDT: Sniper Entry +%26 Reaction
🐳 QKCUSDT: Sniper Entry +%57 Reaction
📊 BTC.D: Retest of Key Area Highly Likely
This list? It’s just a small piece of what I’ve been working on. There’s so much more. Go check my profile, see the results for yourself. My goal is simple: provide value and help you win. If you’ve got questions, I’ve got answers. Let’s get to work!

A longterm view of VICUSDTA fantastic situation happened on this token to achieve over 260% Profit !
Every time the descending trendline touched from down until it breaks! Now its time to touch from upside and a shadow get the job done!
Now all is simple just we should buy this friend and thanks to dear Fibonacci wait to reach the targets (or more targets I should update later)
Enjoy!

Viction (VIC)Viction, formerly TomoChain, is a people-centric layer-1 blockchain, offering zero-gas transactions and enhanced security to make Web3 easy and safe for everyone.
Anyway, VIC's start was an upward phase, followed by a correction wave. It seems VIC is moving in a big, flat triangle pattern. Recently, VIC started an upward wave going toward the triangle's upper line. Let's see what happens.

VICUSDT(Viction) Updated till 02-09-24VICUSDT(Viction) Daily timeframe range. PA still in price discovery level. so a valid retrace or reject can be profitable. its trying to claim over 0.4130. thats a good thing cause not much hold up till 0.5563,depends on bag holders. recent support and low at 0.2779.

Hidden Gem VIC Just entered Binance. It will make big rises very soon.
The market maker is playing.
It will easily reach $1.1 in 1-2 weeks.
Long term target 4-6 USD

Is tomochain ready for the next rocket? (now VICTION)Tomochain has been changed to Viction on 24 november. I do not expect any changes in the direction forward to a new ATH.
The fourth wave of major degree forming an elliot triangle abcde wave is still not finished. I do expect the start of the fifth wave between end of december and january 2025.

OUTSIDE DAY for ALL major averagesWhat a turnaround for ALL the MAJOR averages!
As we've been saying over and over again.......
The END OF DAY IS WHAT MATTERS!!!
*Indices formed an OUTSIDE DAY*
Outside days can signify 2 things:
CONTINUATION
OR
REVERSAL (of the current trend)
Being that the day ended lower, LIGHT VOLUME though, we will take this as a WARNING!!!!!!!
RSI fell pretty hard, #stocks could just experience profit taking for a bit.
__________________________________________
TVC:VIX roaring & seems 2b stronger this time around.
TVC:DXY close to support and seems to be trying to base again.
2 Yr #yield showing positive divergence.
10Yr oversold - don't see anything out the norm in either one of these, yet at least.

Long for target 138Dear tradder,
We can wait for the next week to confirm the pattern. But go long now for the next target.
