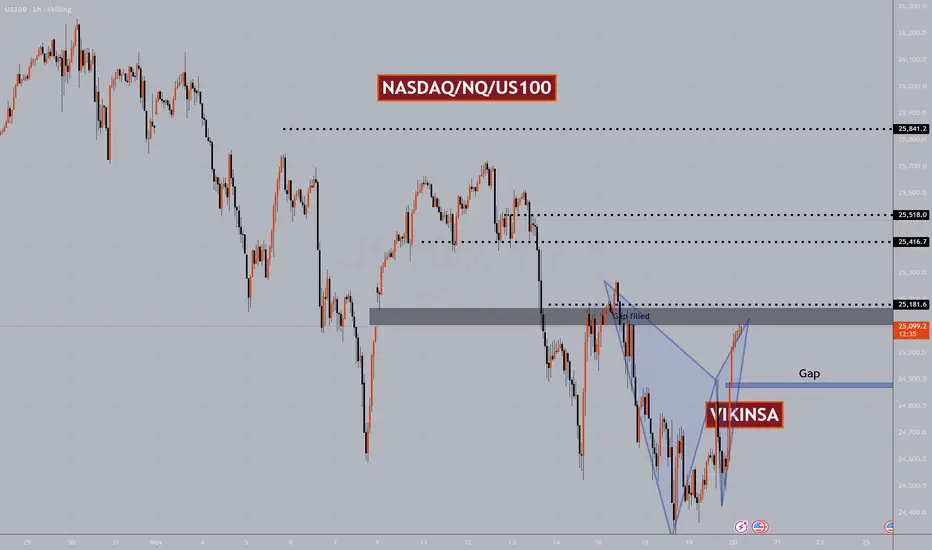
NASDAQ NQ A Breakout Can Come, Wait For The ConfirmationAs I posted earlier, all of our FCP levels and zones have been working great and have given us tremendous opportunities. Now NQ is back at the upper zone and the momentum is looking great. If this breakouts we can test previous high and possibly go to all time highs.
I have updated a few new levels on the chart.
Trade what you see, wait for the confirmations and manage the risk as always.
Follow for more. Please support this analysis by liking, commenting, and sharing with friends, colleagues, traders, and trading communities. Thanks👍🙂
Vikinsa

META Can rise As It Forms A Bullish W PatternMETA Can rise As It Forms A Bullish W Pattern
Meta has been finding support and in the past couple of days it has started forming a base which can lead to a breakout. If this breakout sustains, we can have a possible formation of bullish W pattern. Targets are self evident.
Lets wait and watch and always this is not and advice but just an observation. Risk management is extremely important as always.
Follow for more. Please support this analysis by liking, commenting, and sharing with friends, colleagues, traders, and trading communities. Thanks👍🙂

NFLX (Netflix) Possible Buy OpportunityNetflix along with several other NASDAQ stocks have been taking good levels of corrections. I posted about Microsoft yesterday too.
Netflix is running inside an ABCD pattern which can bring it down to the 50% retracement level around 75.66. However, this can only happen if the current support is broken and a bull trap is set. There are a few more levels which can be good levels to BUY or for Dollar Cost Averaging but they are not in the scope of this simple analysis as of now.
Lets wait and watch and always this is not and advice but just an observation. Risk management is extremely important as always.
Follow for more. Please support this analysis by liking, commenting, and sharing with friends, colleagues, traders, and trading communities. Thanks👍🙂

UKOIL/BRENT Chart Shows That OIL Can RallyI am using UKOIL/BRENT chart because there is a direct correlation between this and any other USOIL/WTI chart.
What we have are:
1. It has been falling in a wedge pattern and is coiling. Hence a breakout sooner or later is expected.
2. It has reached an FCO zone which is acting as a good support. The price has started to form a possible double bottom this week.
3. We have Trend Line support which price has not been able to break though.
This presents a very good medium to longer bullish opportunity on OIL and associated sectors
Lets wait and watch and always this is not and advice but just an observation. Risk management is extremely important as always.
Follow for more. Please support this analysis by liking, commenting, and sharing with friends, colleagues, traders, and trading communities. Thanks👍🙂

$MSFT Microsoft Potential BUY/Support AreasNASDAQ (NQ) did not have a good start to the new year. It has been hitting lows after lows so far and yet to make a proper 2026 high. This downward correction is being reflected in nearly all major tech stocks.
MSFT (Microsoft) clearly created a double top while running inside and touching upper end of a channel. It is now retracing and can possibly come to one of the support areas/levels which can act possible targets for shorts and levels for buys.
As the channel is upwards, this can be good retracement for buy opportunities and if NASDAQ makes anew high, it can pull MSFT higher to new highs too.
Lets wait and watch and always this is not and advice but just an observation. Risk management is extremely important as always.

Gold/Silver Ratio Has Reached An Important LevelGold/Silver Ratio Has Reached A Crucial Level which can provide support. We have 78.6 Fibonacci level along with structure support. Both of them if the market allows, it can bounce from here.

Possible M pattern on GBPAUD for quick one, confirmation neededPossible M pattern on GBPAUD for quick one, confirmation needed
M pattern completed
Trend Line
Support

USDCAD Possible W Pattern and other scenariosUSDCAD has been very bullish in recent times.
However it is now forming and nearly has completed a W pattern. Tuis can create a correction.
If the price stay bullish and the previous high become support then it can rise much higher the the anticipated level.
Trade what you see.
Please support this analysis by liking, commenting, and sharing with friends, colleagues, traders, and trading communities. Follow me for more of these. Thanks👍🙂

GBPUSD Swing Reversal Trade Possible ZonesGBPUSD has reached an FCP zone which can act as resistance. A W pattern has alco completed there.
If this one does not gold, then we have a level and another FCP zone above which should make the market go in to a correction at least for a little while.
Trade what you see, manage the risk.

$NQ NASDAQ/US100 Bearish W Pattern Target Hit, Next Quick UpdateHi
The W pattern completed as expected and after that it fell. It reached the first bearish target. I personally am not looking for any more bearishness. I an bullish from the current levels. However I trade what I see and will plan after seeing the latest price action.
There was a big gap let. All these gaps may or may not get filled but they are important levels. So if the markets becomes bullish again, it may try to go higher from the current levels o fill that gap to the upside.
These is a previous gap level which can also provide support if the market falls from the current levels.
Trade what you see, wait for the confirmations and manage the risk as always.
Follow for more. Please support this analysis by liking, commenting, and sharing with friends, colleagues, traders, and trading communities. Thanks👍🙂

GOLD $GC XAUUSD Target Hit - UpdateTraders and Investors,
W pattern completed as expected and posted about a few days ago. This has given us a great long swing opportunity and then several long and short opportunities on smaller time frames. We have been trading around the levels and zones taking one of them at a time. Whereas one swing long position has been running for this W pattern completion target.
When W pattern completes the market take a correction, this is why today price fell a bit from the FCP zone as expected. It is now consolidating. Lets see if see a further correction or a breakout in the NY session.
Trade what you see, wait for the confirmations and manage the risk as always.
Follow for more. Please support this analysis by liking, commenting, and sharing with friends, colleagues, traders, and trading communities. Thanks👍🙂

GOLD $GC Levels and Patterns AnalysisTraders and Investors,
Gold (XAUUSD) has been consolidating mostly but still has been giving a lot of great short term and swing trade opportunities.
I have updated the important levels and zones which can act as support and resistance. They should guide us a bit for the best possible trade opportunities.
There as possible W pattern forming. It has not formed or completed yet. It must first break the trend line and confirm the break. BTW, that trend line can also give us a good opportunities around it. Next, the price has to break the mid point of potential W pattern. Once it has done that, it can complete the W pattern.
Trade what you see, wait for the confirmations and manage the risk as always.
Follow for more. Please support this analysis by liking, commenting, and sharing with friends, colleagues, traders, and trading communities. Thanks👍🙂

NASDAQ $NQ US100 Major Levels And PatternsNasdaq bounced yesterday heavily and completed a W pattern. I personally have been able to capture majority of this move. You can consider yesterday's W pattern a sort of double bottom which means hat more bullishness is expected in the medium term.
On a short term, now that it has completed a W pattern and reached previous important zone which had a gap, so we can expect a correction here but this may not be a big one. In a rare case there may not be any correction here at all because NASDAQ is forming a pattern which when forms usually ignores all the smaller W and M patterns.
For that reason my Bias is bullish and I will look for buying opportunities mostly.
There are certain Higher time frame levels that I am watching closely which you will find on the chart.
Trade what you see, manage the risk.
Follow for more. Please support this analysis by liking, commenting, and sharing with friends, colleagues, traders, and trading communities. Thanks👍🙂
EURCAD Can Fall Fall Further DownThe last standard W pattern had failed. EURCAD completed an extended W pattern. It showed some rejection from the top. We have a support level in there. If this support levels is broken and confirmed with a bearish signal, we can see a good short opportunity. Targets are on the screen:
If you found this interesting please consider supporting this analysis by liking, commenting, and sharing with friends, colleagues, traders, and trading communities. Thanks👍🙂

AUDCHF Possible BUY AreaAUDCHF completed a W FCP pattern. This made the price fall. It has fallen hard and could possible be going towards the area where we have confluence of an FCP zone and 2 trend lines. This can be a good Buy area for a possible bounce up.
As always wait for the confirmation on the smaller time frame.
If you found this interesting please consider supporting this analysis by liking, commenting, and sharing with friends, colleagues, traders, and trading communities. Thanks👍🙂

USDCHF Zone To Watch Out ForUSDCHF is at a resistance zone. If the market make it a support zone and gives a bullish confirmation above it, it can be a good buying opportunity.
At the moment it is at resistance level so if you want to go long, you must wait for a proper confirmation. Remember Buy at support and Sell at resistance :)
If you found this interesting please consider supporting this analysis by liking, commenting, and sharing with friends, colleagues, traders, and trading communities. Thanks👍🙂

NZDUSD Can Rise From The FCP Zone & M PatternNZDUSD Can Rise From The FCP Zone & M Pattern
As the chart indicates, we have an M pattern completion along with and FCP zone on the daily time frame. Wait for a confirmation based entry on smaller time frames. This can be a good day trade or swing trade opportunity depending on your trading plan.
If you found this interesting please consider supporting this analysis by liking, commenting, and sharing with friends, colleagues, traders, and trading communities. Thanks👍🙂

USDJPY Higher Time Frame AnalysisJapanese Yen collapse continues with its lowest closing price in 34 years. If it falls through 160, it will be the lowest level against the U.S. Dollar since the 1980s. It can get even worse. Let's look at some charts:
1. We are currently sitting at 160 resistance level where a W FCP pattern is completed which can give us a correction. This is the last level which is preventing the USDJPY from slingshotting upwards.
2. A CUP formation is happening at the moment (rounding bottom). So if the correction comes at the current levels, that can make this a Cup and Handle pattern.
3. If the correction does not occur or we get a shallow one, these current levels can become a new support which can push USDJPY higher once confirmed.
4. There are several gaps left in 1980s. I posted about these gaps in my previous post approximately 7 months ago, indicating that USDJPY would be bullish.
5. These are the levels where in the long run USDJPY can go to complete a big W pattern.
This can have a huge impact on the #dollar index (DXY) too.
I recently did a premium analysis report on USDJPY and DXY (dollar index) for a client which has a more in-depth analysis and potential target zones/levels. Get in touch with me via DM if you want to order a copy of that report.
If you found this interesting please consider supporting this analysis by liking, commenting, and sharing with friends, colleagues, traders, and trading communities. Thanks👍🙂

GBPUSD - Watch 1.3 round number and LevelsGBPUSD had an explosive move last week. This was mainly due to a fall in USDJPY from a resistance level that I shared. See the attached chart. This made DXY fall and most of the USD based pairs felt the impact of that. Now GBP use is back in a possible resistance area. Watch out for a W pattern and these levels.
If you found this post useful or information please support this analysis by liking and sharing. 👍✔ Also us for more.

EURCAD W pattern Completion - Can FallEURCAD is near W pattern completion. This has been a complex W pattern in formation which usually gives a good pull backs.
This is a swing trade idea, so wait for a proper confirmation before going short.
If you found this post useful or information please support this analysis by liking and sharing. 👍✔ Also us for more.

NVDA Can Fall NVDA Can Fall:
NVIDIA hit the 161.8 Fibonacci extension and took a little correction. It has been consolidating for some time but also forming a diamond pattern. Although this pattern is not one of the strongest, if it plays out, the market can fall below the FCP zone. Or even the previous high level with a 200sma (daily time frame) confluence and trend line.
This can have a knock-on effect on NASDAQ 100 (US100).
Something to watch out for.
If you found this post useful or information please support this analysis by liking and sharing. 👍✔ Also us for more.

$DXY Dollar Index Can Go ParabolicTraders and Investors,
No matter what the media and general consensus say, simply look at the charts and trade what you see.
The dollar made a huge sharp move down recently which made the majority think and post about the "Dollar Crash". I saw 1000s of posts on social media including some from institutional analysts. But almost immediately the dollar has recovered and is back at the same level of 102.5. 🙂 This effect has been witnessed in commodities and equity markets.
As I write this on Aug 12, 2023, the dollar is showing great strength in the chart pattern formation. The pattern is kind of 75% complete so this analysis post is kind of an early warning. This early warning was sent to private clients a little while ago.
This pattern if finds momentum generally ends up in parabolic movement. Having said that there are a few things that we must consider:
1. This is a higher time frame analysis (daily/weekly chart) and picture so it may take its own time. Keep things in perspective.
2. There are 200 sma (daily time frame) along the way (yellow line) that can act as resistance. That is a good barrier to this pattern.
3. There are several levels and zones along the path to the ultimate target around 109-110. Over time DXY may go up and down on the relatively smaller time frames around these zones as a market never goes up in a straight line. Not DXY anyway 🙂
4. There are several gaps that were left unfilled to the upside. DXY usually does not leave any gaps open. There are a few gaps to the downside as well.
5. Watch USDJPY and USDCHF with it.
Please support this analysis by liking and sharing. 👍🙂
Rules:
1. Never trade too much
2. Never trade without a confirmation
3. Never rely on signals, do your own analysis and research too
✅ If you found this idea useful, hit the like button, subscribe and share it in other trading forums.
✅ Follow me for future ideas, trade setups, and updates on this analysis
✅ Don't hesitate to share your ideas, comments, opinions, and questions.
Take care and trade well
-Vik
____________________________________________________
📌 DISCLAIMER
The content of this analysis is subject to change at any time without notice and is provided for the sole purpose of education only.
Not financial advice or signal. Please make your own independent investment decisions.
____________________________________________________

$BTCUSD #Bitcoin Can Breakout SoonTraders and investors,
Bitcoin has been causing a lot of confusion among traders and investors. So let's break it down and understand.
1. in June 2022 (1 year ago) Bitcoin broke out of the 30000 price tag but never retested that.
2. This year it formed a W pattern to reach that level and retest it.
3. The price reached 30000 this year and completed that W pattern. When a W pattern "completes" the market goes down. So Bitcoin started to fall from there.
4. It reached its target level of Fibonacci 38.2 which was also a good confluence of Structure and Trend Line
5. This formed a flag pattern.
6. Currently the price is supported by the trend line and moving slowly inside the flag
7. This has been going on for quite some time now. So a breakout is imminent.
8. If it breaks out to the downside it can fall further to foran M pattern around 21477
9. If it breaks above the previous high of 31163 and confirms then it will become bullish and can target a bigger W pattern completing around 36783 and a better W pattern at 41000.
10. Caution: Until the breaks and confirms the previous high of 31163 there will still be a chance of it falling down to complete the M pattern as pointed out in point 8 above.
Please support this analysis by liking and sharing. 👍🙂
Rules:
1. Never trade too much
2. Never trade without a confirmation
3. Never rely on signals, do your own analysis and research too
✅ If you found this idea useful, hit the like button, subscribe and share it in other trading forums.
✅ Follow me for future ideas, trade setups, and updates on this analysis
✅ Don't hesitate to share your ideas, comments, opinions, and questions.
Take care and trade well
-Vik
____________________________________________________
📌 DISCLAIMER
The content of this analysis is subject to change at any time without notice and is provided for the sole purpose of education only.
Not financial advice or signal. Please make your own independent investment decisions.
____________________________________________________
