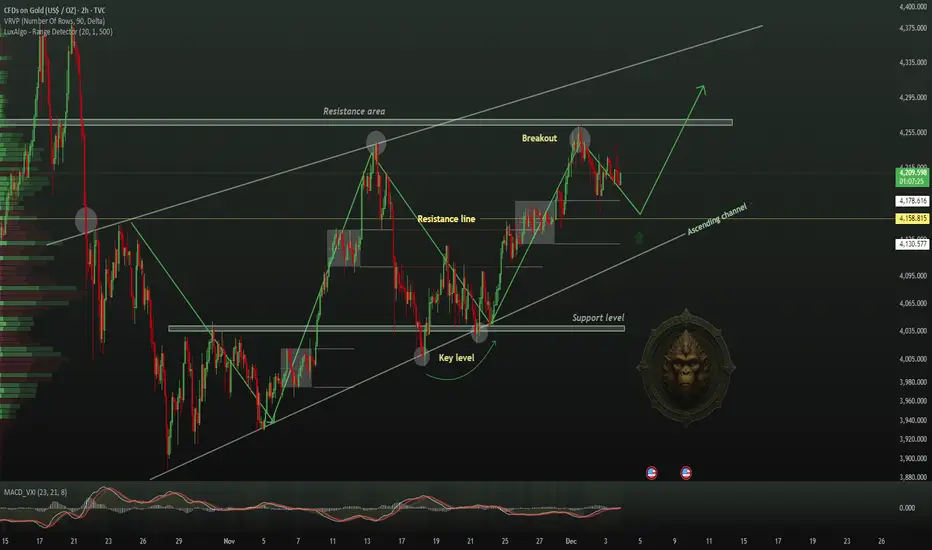
GOLD BUY | Idea Trading AnalysisGOLD is moving in an ascending channel and creating symmetrical triangle and is moving in a descending AND is moving in an UPWARD channel.
We expect a decline in the channel after testing the current level.
Hello Traders, here is the full analysis.
I think we can soon see more fall from this range! GOOD LUCK! Great BUY opportunity GOLD
I still did my best and this is the most likely count for me at the moment.
-------------------
Traders, if you liked this idea or if you have your own opinion about it, write in the comments. I will be glad
VIP
ADA/USDT | Cardano Slides to 0.38 and Bears Keep Pushing!By analyzing the CRYPTOCAP:ADA chart on the 3 day timeframe, we can see that price finally dropped to 0.38, which confirms the bearish pressure we talked about earlier. ADA is now trading near 0.40 and the chart still looks weak. Buyers are not showing real strength and momentum is clearly on the sellers’ side.
If the drop continues, the next downside target I am watching is 0.36. Make sure you monitor price reaction at this level.
From my perspective, the 0.32 to 0.36 zone is a possible long term accumulation area for investors who use proper risk management and do their own research (DYOR).
For now the bias stays bearish until ADA reclaims strong levels with real demand.
Please support me with your likes and comments to motivate me to share more analysis with you and share your opinion about the possible trend of this chart with me !
Best Regards , Arman Shaban

XAU/USD | Gold Approaching Key Intraday Supply Zone! (READ)By analyzing the #Gold chart on the 4H timeframe, we can see that after dropping to 3998 dollars, price found strong demand and has now climbed back up to around 4050 dollars.
Keep an eye on the 4056–4064 zone for a potential SELL reaction, as this is a key supply area.
This analysis will be updated soon, and all important supply and demand zones are already marked on the chart.
Please support me with your likes and comments to motivate me to share more analysis with you and share your opinion about the possible trend of this chart with me !
Best Regards , Arman Shaban

diwali personal favourite pic 4: vip ind my thesis is In BHARAT, THE tourism HAS TO to pick pace and this a proxy play in the same segment
healthy time and price correction seemingly completes .
India’s organized luggage market reached an estimated ₹4,450 crore in retail value during CY 2024–25, expanding at a robust 9.6% CAGR
over the past five years and accounting for roughly 12 million units sold annually.
Modern retail outlets and branded stores command around 65% of sales, while e-commerce contributes 20% and traditional/unorganized channels .
the remaining 15%. Hard-shell suitcases lead the category with a 52% share, followed by soft-side trolleys at 28%, backpacks and duffels at 15%, and travel accessories at 5%.
At the forefront of the market, VIP Industries holds a 32% revenue share, underpinned by its extensive distribution network,
while Safari Industries occupies the second spot with an 18% share by focusing on the value segment. American Tourister, part of the Samsonite Group, captures 15% of the market, and Samsonite itself secures 10% by positioning in the premium segment.
Youth-oriented Skybags accounts for 7%, and a diverse set of domestic players—including Wildcraft and Carlton—make up the remaining 18%. In terms of pricing, 45% of units are sold in the economy segment (under ₹2,000), 40% in the mid-range (₹2,000–5,000), and 15% in the premium bracket (above ₹5,000). Looking ahead,
the market is projected to reach nearly ₹6,300 crore by CY 2028 at a faster 10.5% CAGR, driven largely by premium and “smart” luggage innovations such as ABS-PC blends and RFID-enabled locks, as well as the continued growth of e-commerce and omnichannel retail strategies.

ENSUSDT Analysis D1ENSUSDT Following Setup Breakout,Retest Confirm Bouncing Expecting Solid Recovery In Coming Days .

BANANAUSDT Analysis D1BANANAUSDT Descending Trendline Has Already Got Cleared, Banana Can Give Solid Bullish Rally In Coming Days .

ARBUSDT Analysis D1ARBUSDT Descending Channel & Other Multiple Hurdles Has Already Got Cleared Arb Can Give Solid Bullish Rally In Coming Days


HIGHUSDT Analysis D1HIGHUSDT Already Broken Descending Broadening and started Recovery in D1 Chart
Continuity of momentum can see 80-120% Bullish Rally in Short-term .

HOTUSDT Analysis D1HOTUSDT Horizontal Resistance Breakout & Retest Confirmed, Now Holochain Need To Break Descending Channel To Lead Solid Recovery, Expecting 150% Rally After Successful Breakout

ETCUSDT Analysis D1ETCUSDT Trendline Breakout & Retest Has Already Confirmed, Currently Consolidating Within Bullish Pennant Once Pennant Got Cleared, Etc Can Lead Solid Recovery Towards 30-35$ In Coming Days .

BTCUSD 15MINTS CHART TECHNICAL ANALYSIS NEXT MOVE POSSIBLE..This chart shows a potential bullish move for Bitcoin (BTC/USD).
The price is currently in a support zone (blue area) around 81,800-82,000.
A breakout from this level is expected, leading to a rise toward 83,224 (resistance level).
If momentum continues, BTC could reach 84,457.
The blue arrows indicate the expected bullish movement.

GBPUSD 1HOUR CHART TECHNICAL ANALYSIS NEXT MOVE POSSIBLE This chart shows a technical analysis of GBP/USD on the 1-hour timeframe.
1. Resistance Rejection – Price reached 1.30056 and faced rejection, indicating a possible reversal.
2. Bearish Scenario – The chart suggests a potential drop toward 1.29514 as the first support.
3. Breakdown Possibility – If 1.29514 fails, price could continue falling toward 1.29136, the next key support.
4. Price Action Structure – The drawn arrows indicate a possible retest of 1.29514 before a further decline.
Overall, this chart signals a potential bearish move if price fails to hold above key levels.

BTCUSD 74500$-75000$After breaking the previous high, Bitcoin made a retest and started a new bullish consolidation. We also see a break of the upper trend line and a strengthening of the bullish momentum. Everything indicates that we will visit the ATH zone again and attack it to create a new one. The target is -0.618% Fibonacci level and $74600. It would be nice to see Bitcoin at $80,000 in December, and maybe even earlier.

XAU/USD : Let's go for SHORT! (READ THE CAPTION)By analyzing the gold chart on the 30-minute timeframe, we can see that today the price faced a correction after reaching the key supply level at $2663 and is currently trading around $2654. Keep in mind that the shadow of war still looms over the market, so it's best to minimize your trading risk. At the moment, I expect further declines in gold to lower levels. The downside targets are $2647, $2644, and $2640, respectively.
Please support me with your likes and comments to motivate me to share more analysis with you and share your opinion about the possible trend of this chart with me !
Best Regards , Arman Shaban

SWING IDEA - VIP INDUSTRIESVIP Industries , a leading manufacturer of luggage and travel accessories, is displaying technical indicators that suggest a promising swing trading opportunity.
Reasons are listed below :
450-500 Strong Support Zone : The 450-500 level has been established as a strong support zone, providing a solid base for potential upward movement.
Bullish Engulfing Candle on Weekly Timeframe : The formation of a bullish engulfing candle on the weekly chart indicates strong buying pressure and suggests potential for further upward movement.
Daily Candle Engulfed 7 Daily Candles : The recent daily candle has engulfed the previous 7 daily candles, demonstrating significant buying interest and a potential shift in trend.
Golden Fibonacci Zone : The stock is finding support at the golden Fibonacci retracement level (0.618), a key area where prices often bounce back, indicating potential for an upward move.
Increased Volumes : A noticeable increase in trading volumes confirms the strength of the price move and indicates growing investor interest.
Target - 575 // 660 // 715
Stoploss - weekly close below 445
DISCLAIMER -
Decisions to buy, sell, hold or trade in securities, commodities and other investments involve risk and are best made based on the advice of qualified financial professionals. Any trading in securities or other investments involves a risk of substantial losses. The practice of "Day Trading" involves particularly high risks and can cause you to lose substantial sums of money. Before undertaking any trading program, you should consult a qualified financial professional. Please consider carefully whether such trading is suitable for you in light of your financial condition and ability to bear financial risks. Under no circumstances shall we be liable for any loss or damage you or anyone else incurs as a result of any trading or investment activity that you or anyone else engages in based on any information or material you receive through TradingView or our services.
@visionary.growth.insights

⭐️ XAU/USD : Navigating Supply and Demand Shifts (READ CAPTION)Hello Traders , Upon examining the gold chart in the 1-hour timeframe, we can see that after the price entered the targeted supply zone ($2352), it faced selling pressure and corrected with a drop of 230 pips down to $2328. Now, gold has closed at $2338, and I expect further correction with the market opening, although it’s possible that the price may re-enter the defined supply zone first before correcting with greater momentum. There are several important price levels ahead for gold that I urge you to consider and mark on your chart; these levels are, in order, $2366, $2375, and $2385. The potential scenario has been outlined on the chart.
Please support me with your likes and comments to motivate me to share more analysis with you and share your opinion about the possible trend of this chart with me !
Best Regards , Arman Shaban

NZDUSD SELL | Day Trading AnalysisHello Traders, here is the full analysis.
I think we can soon see more fall from this range! GOOD LUCK! Great SELL opportunity NZDUSD
I still did my best and this is the most likely count for me at the moment.
Support the idea with like and follow my profile TO SEE MORE.
Traders, if you liked this idea or if you have your own opinion about it, write in the comments. I will be glad 🤝
Patience is the If You Have Any Question, Feel Free To Ask 🤗
Just follow chart with idea and analysis and when you are ready come in THE GROVE | VIP GROUP, earn more and safe, wait for the signal at the right moment and make money with us💰

GBPJPY OUTLOOK & TRADE IDEA 4HGBPJPY took liquidity & imbalance --> tapped into a 1h supply zone.
What do you think?
DBD = Drop Base Drop Supply Zone
LQP = Liquidity Pool
Arrows = Inducements

$GBPUSDOANDA:GBPUSD
FX:GBPUSD
In my opinion, the price of the dollar index has experienced a lot of decline and it will take some time to suffer and recover, and the current jumps also indicate a price floor.
Trading starts on Monday 4 hours after the market opens

CHF/JPY SHORT SETUP AFTER BOJ WARNINGSOn CHF/JPY, we have a bullish setup that reached the highest level at 164. From there, the price started to change trend; this morning, it dropped by 50 pips and is currently retracing in the supply zone at the level of 163.50, where we have a Point of Interest (POI), meaning a high probability reversal point. Here, we could look for a short trade in case a bearish candle enters and then closes below the POI. The chart shows a potential trade with entry points, exits, and take profit levels. What do you think? Greetings from Nicola, CEO of Forex48 Trading Academy.

XAUUSD signal As you can see we have a good chance to buy GOLD at this levels so we have a double bottom in 4H and classic setup on 30 min also we have a nice flag .the market looking for continue pushing up.

GOLD BUYAs I see gold ready for buy....entry 2004 , tp= open , sl = previous support 1986, set a buy limit @ 1986
