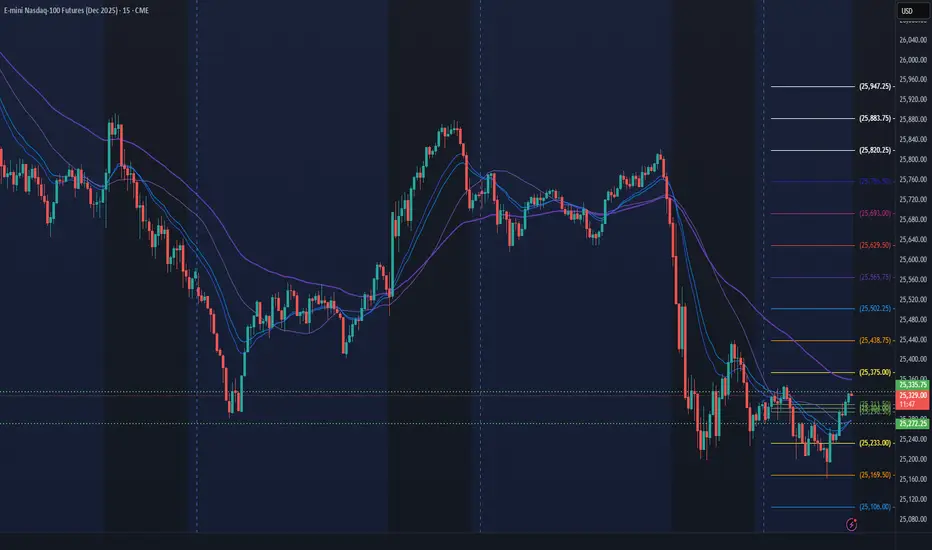
NQ Power Range Report with FIB Ext - 11/17/2025 SessionCME_MINI:NQZ2025
- PR High: 25188.25
- PR Low: 25022.00
- NZ Spread: 372.0
No key scheduled economic events
Session Open Stats (As of 12:35 AM)
- Session Open ATR: 458.87
- Volume: 48K
- Open Int: 290K
- Trend Grade: Long
- From BA ATH: -4.2% (Rounded)
Key Levels (Rounded - Think of these as ranges)
- Long: 26636
- Mid: 25410
- Short: 24039
Keep in mind this is not speculation or a prediction. Only a report of the Power Range with Fib extensions for target hunting. Do your DD! You determine your risk tolerance. You are fully capable of making your own decisions.
BA: Back Adjusted
BuZ/BeZ: Bull Zone / Bear Zone
NZ: Neutral Zone
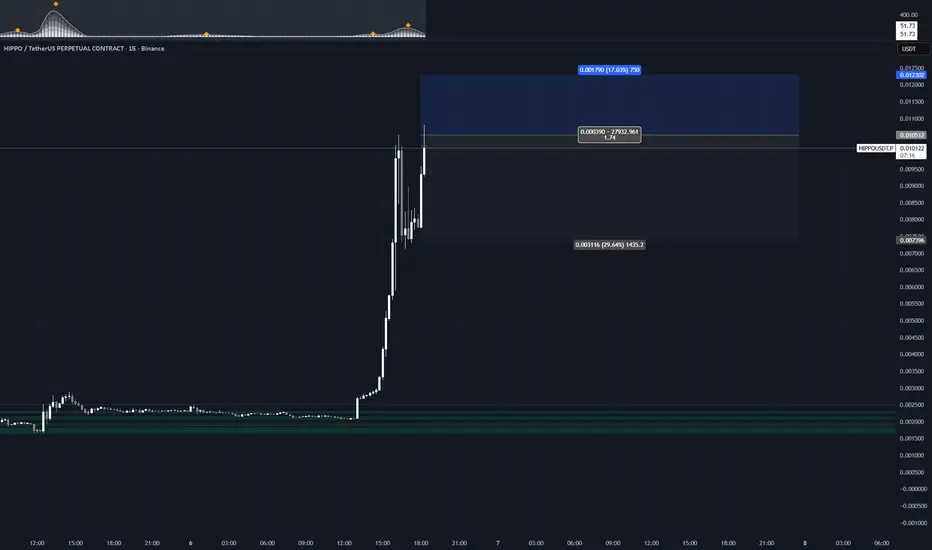
Volatility
Irregular VolumeThe irregular volume on this is unsustainable for this asset as well and its likely to drop rapidly with at least a 80% downside.

DCR | This Crypto Is About To Pop | LONGDecred is Money Evolved.
By combining battle tested Proof-of-Work with an innovative take on Proof-of-Stake that places coin holders in charge of shaping the future, Decred is able to adapt to challenges and innovate at a rapid pace. You acquire influence in Decred by putting “skin in the game”.
Decred’s security, privacy, scalability, and decentralized treasury empower stakeholders and provides them with the tools needed to enhance their financial sovereignty.
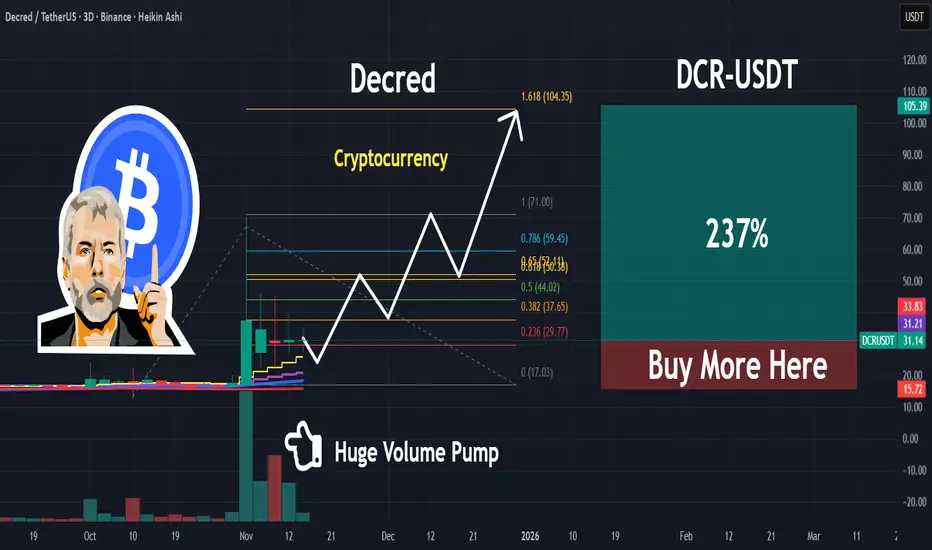
10% LONG POSITION As we cab see the price bounced from that support level multiple times, and this time not only boncing from it , this time clearly have swept the liquidity from tha recent low , and have given as a good reaction and a good confirmation to the up side , possibly headed to the previous high ( HRLR)

BTC AT A CROSSROADS A make or break moment for CRYPTOCAP:BTC
If market holds @ 95k we could get a reversal otherwise this may be one of the deadliest crash

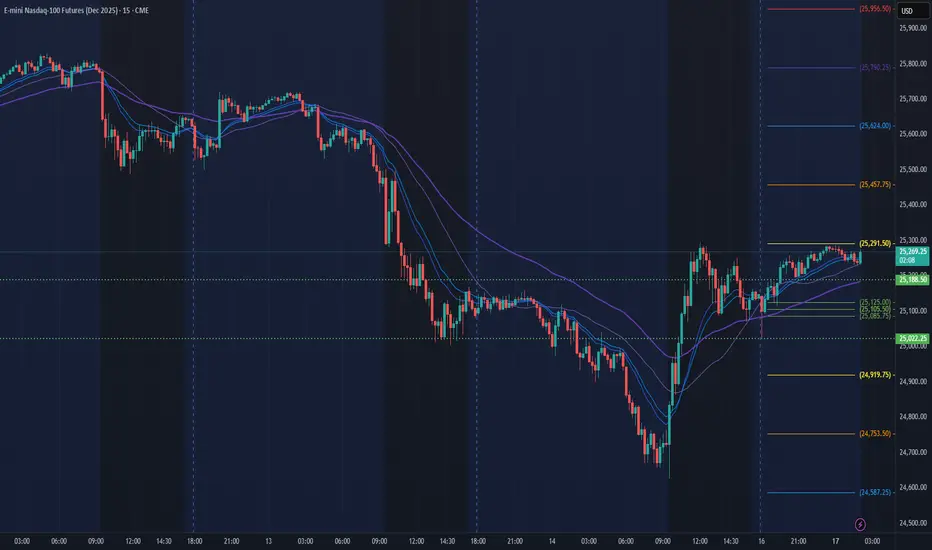
NQ Power Range Report with FIB Ext - 11/14/2025 SessionCME_MINI:NQZ2025
- PR High: 25151.75
- PR Low: 25087.75
- NZ Spread: 143.0
No key scheduled economic events
Session Open Stats (As of 12:55 AM)
- Session Open ATR: 439.51
- Volume: 47K
- Open Int: 302K
- Trend Grade: Long
- From BA ATH: -5.1% (Rounded)
Key Levels (Rounded - Think of these as ranges)
- Long: 26636
- Mid: 25410
- Short: 24039
Keep in mind this is not speculation or a prediction. Only a report of the Power Range with Fib extensions for target hunting. Do your DD! You determine your risk tolerance. You are fully capable of making your own decisions.
BA: Back Adjusted
BuZ/BeZ: Bull Zone / Bear Zone
NZ: Neutral Zone
Quiet Strength Beneath the NoiseWhile the broader crypto sentiment leans bearish, TRB/BTC is quietly carving a bullish structure that deserves attention. The October flash dump printed a textbook Spring extreme volatility, yes, but the wick down only saw 32k in volume compared to the 549k on the Selling Climax. That’s a low-volume Spring, which typically signals strength. Don’t expect price to revisit that wick in any meaningful way.
Phase B is showing classic reaccumulation traits: price pulling back on declining volume, small overlapping candles, and no real selling pressure from smart money. It’s quiet, but it’s telling.
Trade Scenario
Note, this isn’t about USD strength it’s about TRB outperforming BTC. That distinction matters. You’re not chasing a pump, you’re positioning for relative strength.
Stop Loss
• Clean invalidation sits below the Spring. Yes, it’s a deep wick, but if we print a monthly higher swing low, SL can be tightened or adjusted to the weekly TF.
Take Profit
• TP1: Just below the EQ of the range.
• TP2: Near range highs.
• TP3 (trail): Use monthly higher swing lows to trail toward the minimal range high. It’s a stretch target, but the chart shows it. No bias, just structure.

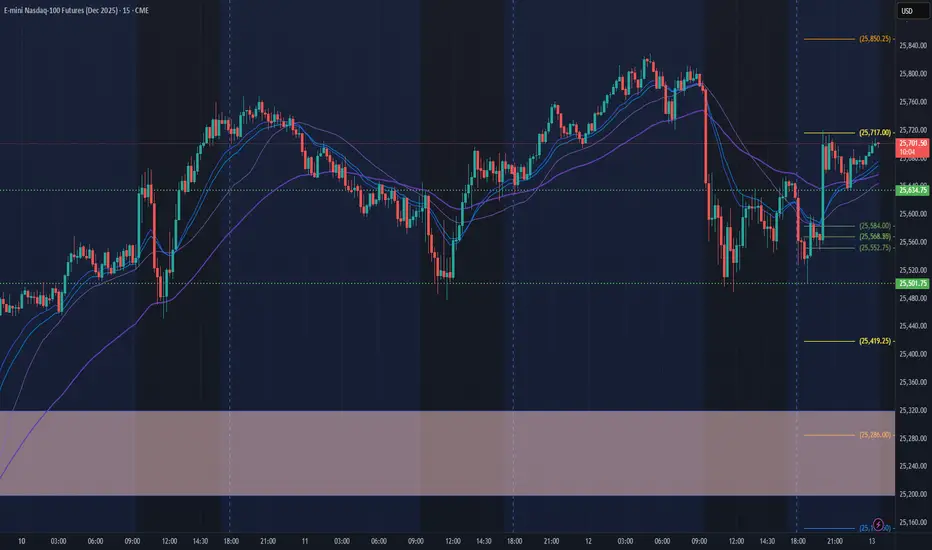
NQ Power Range Report with FIB Ext - 11/13/2025 SessionCME_MINI:NQZ2025
- PR High: 25635.25
- PR Low: 25501.50
- NZ Spread: 299.25
Key scheduled economic events:
08:30 | CPI (Core|MoM|YoY)
- Initial Jobless Claims
13:00 | 30-Year Bond Auction
Session Open Stats (As of 12:25 AM)
- Session Open ATR: 423.22
- Volume: 52K
- Open Int: 296K
- Trend Grade: Long
- From BA ATH: -2.7% (Rounded)
Key Levels (Rounded - Think of these as ranges)
- Long: 26636
- Mid: 25410
- Short: 24039
Keep in mind this is not speculation or a prediction. Only a report of the Power Range with Fib extensions for target hunting. Do your DD! You determine your risk tolerance. You are fully capable of making your own decisions.
BA: Back Adjusted
BuZ/BeZ: Bull Zone / Bear Zone
NZ: Neutral Zone
NQ Power Range Report with FIB Ext - 11/12/2025 SessionCME_MINI:NQZ2025
- PR High: 25673.50
- PR Low: 25629.50
- NZ Spread: 98.5
Key scheduled economic events:
13:00 | 10-Year Note Auction
Session Open Stats (As of 12:25 AM)
- Session Open ATR: 424.02
- Volume: 33K
- Open Int: 293K
- Trend Grade: Long
- From BA ATH: -2.6% (Rounded)
Key Levels (Rounded - Think of these as ranges)
- Long: 26636
- Mid: 25410
- Short: 24039
Keep in mind this is not speculation or a prediction. Only a report of the Power Range with Fib extensions for target hunting. Do your DD! You determine your risk tolerance. You are fully capable of making your own decisions.
BA: Back Adjusted
BuZ/BeZ: Bull Zone / Bear Zone
NZ: Neutral Zone

MSFT: The “Top Pick” Trap? Or Real Breakout Fuel?Microsoft is testing a critical support zone — and with Morgan Stanley just naming it a top pick in tech, buyers may be gearing up for control. 📈
Quantitative stats back the setup: Sortino Ratio of 0.42 and 90% win rate on this pattern.
👉 What’s your call — breakout to new highs… or one more dip before the rally?

Gold back leading the charge higher!It was interesting to see that weekend progress between Democrat and Republican lawmakers on bringing an end to the longest running federal government shutdown in US history led to a 2.6% surge in Gold, from opening levels around 4000 on Monday up to a 2 week highs of 4116, a move that has extended this morning to print a high at 4149. Traders chose to focus on the potential clarity the move could bring to the Federal Reserve’s (Fed) current interest rate outlook, rather than cutting back on their Gold exposure being held a safe haven hedge against the economic uncertainty and potential damage the long-lasting shutdown was inflicting on the US economy.
It is hoped that a reopening of the US government could restore the economic data flow providing updates on the health of the US labour market and direction of inflation in time to influence the decision making of Fed policymakers ahead of their final rate decision of the year on December 10th. The current market pricing of roughly a 65% chance of a further 25bps rate cut at this meeting has helped support Gold’s move higher, as a non-interest-bearing asset.
Progress on ending the shutdown seems to be speeding up with the Senate voting to approve a spending package that keeps most of the government open until the end of January, and some departments open until the end of September. The bill now moves to the House of Representatives for approval before being sent to President Trump for his signature. Two potential stumbling blocks that may add further volatility to Gold prices across the remainder of the week.
The technical outlook could also be influential after yesterday’s close above resistance at 4077, the 38.2% retracement of the October price decline.
Gold Technical Update: Signs of Upside Resumption?
Following the price drop into the 3886 October 28th low, Gold entered a phase of more balanced price action, with sideways consolidation dominating recent sessions. This suggested a pause in directional momentum as traders assessed whether the decline had run its course or if further price weakness might resume.
However, following the weekend news of a potential US government re-opening, fresh support emerged on Monday. As a result, Gold has now rallied over 6.7% from the October 28th low (3886), marking a notable recovery from the recent weakness.
Traders may now be focused on Monday’s closing break back above resistance at 4077, a level equal to the 38.2% Fibonacci retracement of the October weakness. While not a guarantee of further price strength, this move may lead to a phase of recovery. Therefore, it could be useful to gauge support and resistance levels after the latest price activity for possible clues to the next directional themes.
Potential Resistance Levels:
While future price action will ultimately dictate where Gold moves next, the recent close above 4077 may suggest further upside in price. This could raise the prospect of a test of 4194, the higher 61.8% retracement level of October’s decline.
The 61.8% retracement level at 4194 is potentially a strong barrier to price strength, and if tested Gold may face sterner resistance here. However, a closing break above this level could open scope for deeper upside moves toward 4381, the October 20th extreme.
Potential Support Levels:
After the speed of yesterday’s up move, the first potential support for traders to monitor could be at 4016, a level marking half of the recent rally from the lows at 3886 (October 27th low). A pullback to this level could be a routine reaction to recent strength, however but closes below this level might signal renewed downside pressure.
While not a definitive signal of renewed weakness, a close below 4016 could open the door to retest 3886, the October 28th low and potentially even 3823, a level equal to the 50% Fibonacci retracement of the August to October advance.

EURUSD LONG Followed the Liquidity throughout the days and came across the opportunity to execute this trade here and currently it is moving slow BUT the peak hours are ahead for movement/volatility.

November 10 - 14 2025
1. Macro
I have made several changes to my Macro layout to make it more focused and intuitive for options trading. I still watch commodities and check the gauge from time to time, but I have found they are too volatile, cyclical, and noisy for me to be keeping such close tabs on. Instead, my renewed focus is to assess risk across currency (gold and fiat) and bonds, which in turn will help me measure the attractiveness of stocks in real time.
Since Mid-September, the dollar TVC:DXY has been on a steady rise. Meanwhile, the Z-score of $(DXY*TYIE) (Dollar FX strength multiplied by real yield) has been falling over the same period before pivoting at the end of October. This would suggest that real yields were falling at a rate that outpaced the dollar’s relative strengthening. The pivot came at the same time that TVC:GOLD started to pull back from its nearly 30% rally. Keep in mind that real yields rising is bearish for gold.
I’m also bringing in $GOLD/GVZ which serves as a good early exhaustion gauge for Gold. Here we can see that traders loaded up on AMEX:GLD puts before the price pulled back, but have since reverted back to the average. We will see if Gold continues its uptrend or if more volatility is to come.
Next, I’m looking at the Z-score of the dollar TVC:DXY against the price (not yield) of a 10Y US-bond. The idea here is to simply gauge whether the market has a preference for cash or risk-free bonds. This measures the relative risk of bonds (ie. higher yields expected: market will prefer cash). Here we can see that there seems to be a preference for cash that has close correlation with the TVC:DXY uptrend, suggesting FX is moving the dollar higher more than a change in the bond price.
I have decided to chart TVC:US02Y by itself, occasionally switching to other yields or the 10Y real yield FRED:DFII10 ), since it is more sensitive to policy than 10Y and more volatile than 03MY. Here, the nominal yield started to rise at the same time as when TVC:GOLD & CBOE:GVZ peaked and the dollar*real yield gauge pivoted. The forward inflation gauge (bottom right) has stayed mostly down but is showing signs of flattening out, perhaps finding support for a move higher.
What does all of this tell me? I think this sends a clear message that the market thinks nominal yields will continue to rise, yet I’m not yet getting the signal that this is due to a change in how the market is pricing inflation. Due to shutdown delays (which will hopefully be ending soon), the latest available real yield print is from Thursday November 6, and with the movement on Friday it will be important to see how the forward inflation gauge changes when it gets updated.
If nominal yields continue to rise TVC:US02MY and TVC:GOLD confirms without hedging CBOE:GVZ , this would send a risk-off signal. On the flip-side, the market would need to see continued FX strength for the dollar AND nominal yields flat or falling to confirm a risk-on pivot. Right now this leans risk-off but I will be watching closely.
2. FX
Made a couple changes to the FX layout to support the same line of thinking. Might tweak this more depending on how insightful it is. Top pane is now 2Y yields for selected countries. The middle pane is what I would call a “forward-looking interest rate vs historical inflation”. This is similar to the real yield but the real inflation data has much more lag, but I’m trying this out as it may suggest how loose or tight forward policy expectations might be. Lastly, I have the percent comparison of the selected currency baskets as usual.
Since the Dollar’s FX strength is playing a key role in the dollar’s attractiveness over bonds, It’s worthy to note that other currency indices currently have an inverse relationship with OPOFINANCE:DXY. The dollar caught a bid while competitors fell in late October but now it looks like the opposite is occurring. TVC:US02Y has risen and is now essentially tied for second-highest with Australia - use below Great Britain. Meanwhile, the market is pricing the US as restrictive but not as tight as France and Italy (dotted and dashed blue lines, respectively). I think this means the Eurozone will see more FX interest compared to the dollar, which could undermine its strength unless nominal yields continue to rise.
In my view, this supports a better Risk-On argument since the Euro index TVC:EXY has not started outperforming TVC:DXY yet on the indexed chart, meaning euro restrictiveness is not fully priced in. With the US in the early stages of an easing cycle and Europe still dealing with higher inflation, US conditions are likely to continue easing relative to the EU’s riskier members; France and Italy. This should keep the dollar from finding too much market interest.
Conclusion: Dollar FX will continue to be range-bound or lower. Any rise should just be seen as temporary.
3. Risk
I’ve changed my approach here to focus more on credit on a shorter-term basis. Here, I have real Option Adjusted Spreads of corporate bonds (top left, blue) like before, but will primarily watch the proxy -1*(HYG+LQD)/2/TLT (public debt vs treasuries), which is more sensitive and can provide early signals and important divergences. In the middle pane, I’m tracking $-1*HYIN (inverse of a private-credit ETF; higher value = higher risk to private credit). On the third pane I am using $ES1!/GOLD as I have always done.
This layout shows a worrying picture for the near-term. The real OAS chart (blue) is confirming the uptrend on the proxy above it is signaling stress to public credit and spreads may be on to higher highs. On the next chart, we are seeing that there is also stress to private credit that is staying above the Keltner Channel. I believe this underlying credit risk added stress to stocks over the past two weeks. If it continues there certainly could be more downside ahead. It’s also not looking good when $ES1!/GOLD is moving lower after a bounce that could potentially lead to lower low, however a key point to note is that this recent dip has been caused by stock selling, not gold buying, as I have previously pointed out, which is a very important distinction in my opinion.
My takeaway is that the credit situation should be monitored very closely. Despite this, it’s also noteworthy that the market is not rushing into risk-off assets like Gold and Treasuries, and Macro forces may even prevent a surge in both, so there is still a good chance the credit issue is temporary. Neutral/leaning bearish on this one.
4. Sector Performance
Same approach here. Only thing I want to point out is that we clearly saw a rotation out of tech AMEX:XLK and into healthcare AMEX:XLV (circled), which was the source of stock market volatility and could have been due to “smart money” positioning prior to the White House pharmaceutical pricing announcement. I doubt this trade will hold, so a rotation back into tech at some point seems likely.
5. Bias
I won’t spend too much time on this one today. I already predicted we’d see the price move higher after Friday’s close which is why I bought calls one week out. CVD clearly favored the sellers last week but right now it looks like it might be breaking through. On my volatility indicators on the left, there was strong confirmation that dealers were long puts on the days the market sold off last week but Friday appeared to show a pivot, taking out the puts. Historical Volatility (HV) is falling so there is a possibility this could be a reversion, however I think a 4% pullback and 22 on TVC:VIX with no major news supporting it was excessive. Stocks were overbought so that was more than enough for a healthy pullback to shuffle the deck.
Conclusion:
Macro indicators are important to watch this week, as I believe they will provide important clues for stock market performance. As I explained above, rising yields/strong dollar will put downward pressure on stocks but the dollar’s relative strength can be assessed through the FX lens, which suggests that even if we see nominal yields rise to start the week, investors will still have an incentive to buy US debt compared to across the pond (UK, France, Italy).
I also think the rotation out of Tech and into Healthcare was likely temporary, which let stocks pull back and investors to profit off of the healthcare-related policy news that was in the pipeline. The real bearish catalyst I’m watching is to see if credit continues to show signs of stress. If that is the case, a continued rise in gold (which we are already seeing today) could be a signal of rushing to safety, however I would also expect to see US treasuries declining simultaneously if that were the case.
All of this to say, I think it is more likely than not that stocks will recover and continue the bullish trend this week, but it is still important to watch for any signs that trouble still lies ahead. A lot can happen in a week.

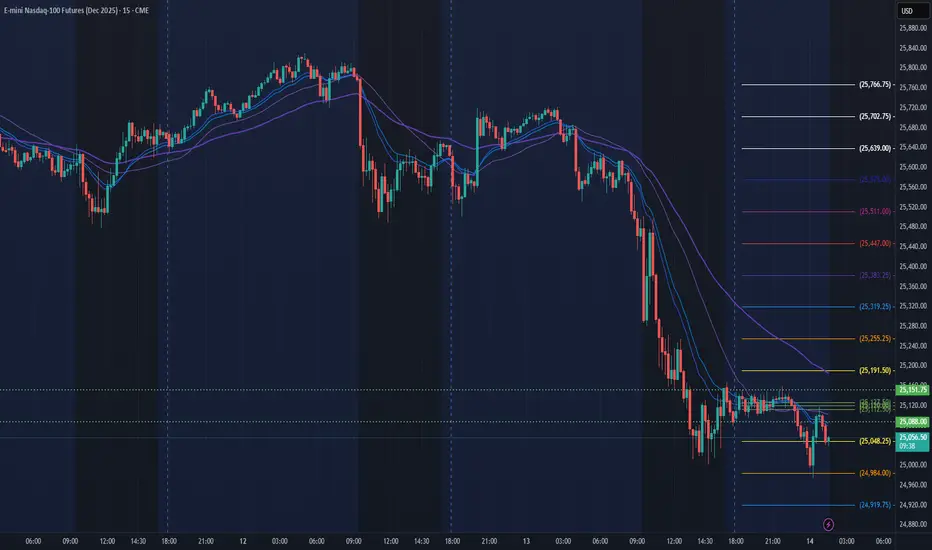
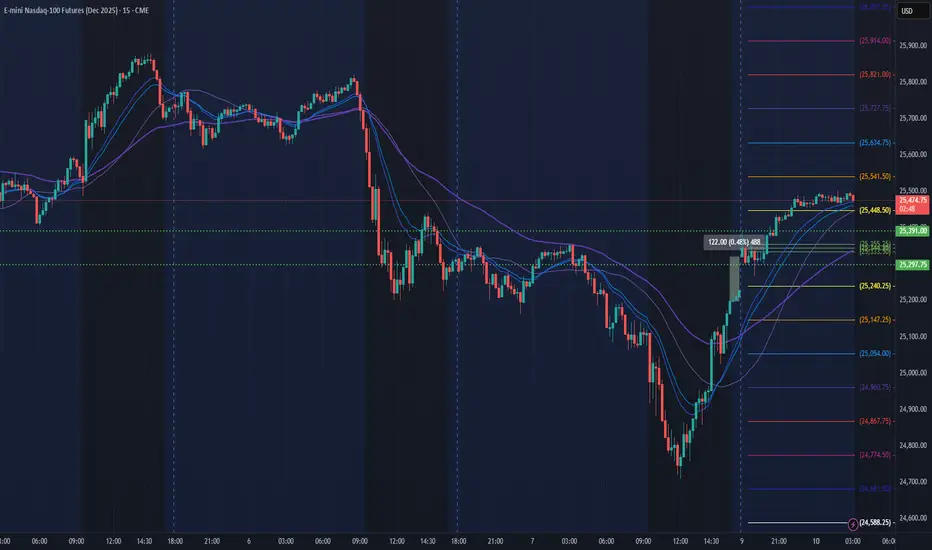
NQ Power Range Report with FIB Ext - 11/10/2025 SessionCME_MINI:NQZ2025
- PR High: 25391.50
- PR Low: 25297.50
- NZ Spread: 210.0
No key scheduled economic events
Session Open Stats (As of 2:25 AM)
- Session Open ATR: 439.66
- Volume: 53K
- Open Int: 297K
- Trend Grade: Long
- From BA ATH: -3.4% (Rounded)
Key Levels (Rounded - Think of these as ranges)
- Long: 26636
- Mid: 25410
- Short: 24039
Keep in mind this is not speculation or a prediction. Only a report of the Power Range with Fib extensions for target hunting. Do your DD! You determine your risk tolerance. You are fully capable of making your own decisions.
BA: Back Adjusted
BuZ/BeZ: Bull Zone / Bear Zone
NZ: Neutral Zone
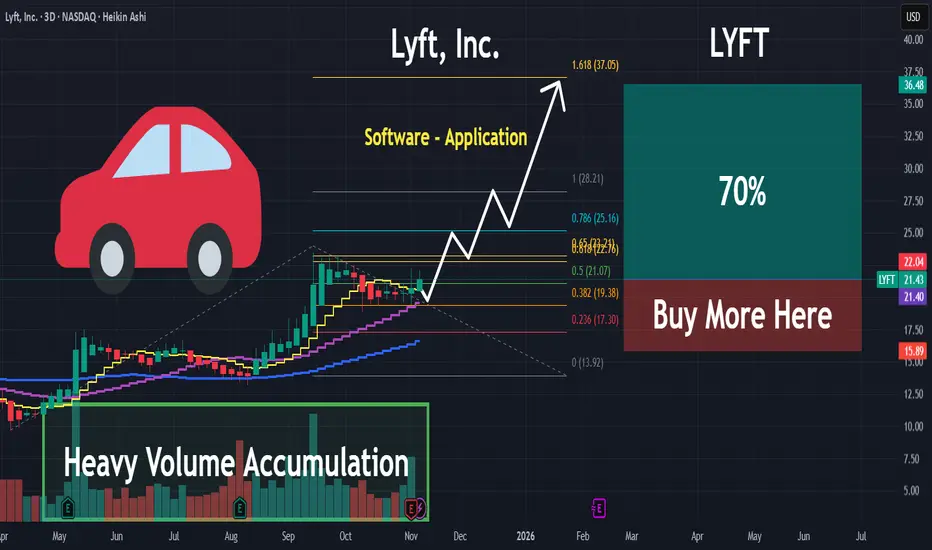
LYFT | Expect an Accelerated Move Higher | LONGLyft, Inc. engages in the provision and management of an online social rideshare community platform. It offers access to a network of shared bikes and scooters for shorter rides and first mile and last-mile legs of multimodal trips, information about nearby public transit routes, and Lyft Rentals to offer riders a view of transportation options when planning any trip. The company was founded by Marcus Cohn, John Zimmer, Rajat Suri, Matt van Horn, and Logan Green in 2007 and is headquartered in San Francisco, CA.
The Swing Strategy, I been usingZone‑to‑Zone Trading
1.1 Drawing the Zones
What is a zone?
A price area (not a single line) where the market repeatedly reacts: flips from support→resistance (S/R) or resistance→support (R/S), stalls, or coils.
Priority by timeframe:
Monthly ≥ Weekly ≥ Daily ≥ Hourly. Higher‑timeframe zones carry more weight.
How to mark zones
Start on monthly, and highlight obvious S/R bands.
Drill down to weekly, refine, or add.
Drill down to daily, refine, or add.
Drill down to hourly for tactical entries.
Clues for a quality zone
Prior breakout level that later flips to S/R on retest and consolidates before resolution.
Clear historical reaction clusters (wicks, bodies, or gaps).
Visible “sensitivity” (multiple rejections/holds in the same area).
1.2 Trading the Zones
Entry: Wait for local consolidation near a zone, then take the breakout.
Stops:
Conservative: Below the box low (consolidation floor).
Tight: Mid‑box (accept higher stop‑out rate, better R).
Filter:
Longs only above 50 SMA, shorts only below 50 SMA (trend filter).
1.3 Range vs. Exact Level
Treat zones as bands, not one price tick. I would take the pivot close to the opening of the first red candle if it's a bullish pivot.
At times a single line is acceptable (e.g., clean, repeated close‑basis pivot), but default to ranges.
2) Box System
2.1 Market Phases
Sideways (consolidation) → build energy (boxes form between zones).
Trending → series of HH/HL (up) or LH/LL (down).
2.2 Trend Structure
Trends breathe via consolidation → expansion → consolidation.
Breakouts can:
Go with no retest
Retest the boundary and go
Brief incursion back into box, then full resolve
The first inner zone inside the box is critical: if a new uptrend is valid, the price shouldn’t revisit below it.
Stops: below that first inner zone.
Note: Zone‑to‑Zone shines in non‑trendy markets (FX, many dividend names).
2.3 Types of Boxes
MA roles (fractal):
9 SMA → short‑term momentum
50 SMA → intermediate momentum
21 SMA → the inflection between 9 and 50; often reacts first
2.3.1 Base Box
Both the 9 & 50 SMA flatten for an extended period.
Highest stored energy; breakouts can start major trends.
2.3.2 50 SMA Box
Sideways price, 9 SMA flat, 50 SMA rising/falling into price as dynamic S/R.
Breakout after the 50 SMA reaches the box.
2.3.3 9 SMA Box
Shorter coil (≈ 3–4 candles).
9 SMA catches up; breakout follows.
Shortest consolidation; quicker moves.
2.3.4 9 vs 50 Comparison
9 SMA trend: 2× HH/HL supported by 9. Parabolic (≈20% of cases): each candle’s low should not undercut the prior candle’s low.
9 SMA box: brief sideways until 9 SMA “tags” price → quick reaction.
50 SMA boxes: longer coil; 50 “arrives,” 9 often flat.
Base box: 50 is inside & flat; price crossed above/below multiple times.
2.4 System Objectives Checklist
Trend-following or mean-reversion?
Entry conditions?
Exit logic?
System expectancy?
Risk model?
Entries
Box breakout (bullish): Prefer consolidation at the top‑right of the box before break → higher probability.
Zone‑to‑Zone: Look for a lower‑TF coil at a higher‑TF zone → break of coil for entry.
Profit & Exits
Next zone target; or
Exit when an uptrend fails to make an HL (i.e., breaks prior swing low).
Stops
Box breakout: Below the first inner zone or box low.
Zone‑to‑Zone: Based on the lower‑TF coil used for entry.
Position Size = 4% per trade or less.
2.5 Trading the Boxes
Four box archetypes: 9 SMA, 21 SMA, 50 SMA, and Base.
Base Box
More false starts; longest runs when it goes.
Prefer equity or bull‑put spreads; ride while price > 50 SMA.
50 SMA Box
The first 50‑box after a base is the most reliable.
Daily 50‑box usually follows 3–4 weeks of coil; expect ≈1.5–2 weeks of trend leg.
Tactics: Stock and swing options (expiry ≈ coil length or slightly more).
9 SMA Boxes
Breakout leg ≈2–3 days, then another coil.
Tactics: Scalps with 1–1.5 weeks to expiry; 1–2 OTM strikes.
Quick Summary
Base: most power, least timing precision.
50: first after base = best reliability; second is weaker.
9: short, sharp, tactical.
2.6 Overall Market Environment
If indices trend up above the latest daily zone, 8/10 breakouts can succeed.
If indices chop under the latest daily zone, expect ≈5/10 to work.
Compare QQQ vs. SPY strength to gauge risk‑on/off.
Rules of thumb
Upside bias: Index above the latest daily zone (or proxy 9 SMA if approximating).
Scalping bias: Above the latest hourly zone.
2.7 Box System & Long‑Term Investing (LTI)
Markets are fractal; weekly = daily = hourly in pattern, not speed.
Trend rule: in an uptrend, price should not break prior swing low (mirror for downtrend).
Trailing stop logic
Uptrend: trail to recent swing low once confirmed.
Downtrend: trail to recent swing high.
MA benchmarks:
Hard breaks of 9 SMA → likely consolidation.
50 SMA for longer bias.
Caveat: large‑cap growth rarely trends cleanly down (index dependency & fund flows).
2.8 Watchlist Creation
Three steps
Scan sectors for consolidations (boxes).
Check relative strength vs. SPY (e.g., XLK/SPY).
Review the top 10–20 holdings.
Tiers
A‑List: Box about to break + high options liquidity.
B‑List: Box about to break but low options liquidity.
C‑List: Boxes are still developing.
2.9 Role of the 21 SMA
Acts as the inflection between 9 and 50.
The highest failed‑break probability occurs at 21 boxes.
After a 9‑trend ends, watch 21 for the reaction:
Back to recent highs and breaks, or
Failed break; or
Reject at 9 after 21 reactions.
2.10 SPX Intraday Scalp Pattern
Don’t chase the open; wait 1–2 hours for the market to form an intraday box (2–3 h coil).
Enter as the range breaks: you benefit from direction and rising IV (“double whammy”).
2.11 SQUEEZE Pro Indicator (SQZPRO)
Concept: A squeeze occurs when Bollinger Bands compress inside the Keltner Channels (BB inside KC) → energy building.
Dot codes (suggested):
Green: No squeeze
Black: Mild squeeze (BB within 2 ATR KC)
Red: Tight squeeze (BB within 1.5 ATR KC)
Yellow: Very tight (best odds for expansion)
Heuristic: The tighter the compression, the stronger the potential release.
2.12 Backtesting & Strategy Creation
Use TradingView Replay. Segment by regime (bull, bear, or chop).
Test entries, exits, and risk variants.
Purpose: build statistical confidence to keep your “monkey brain” from hijacking.
2.13 QQQ vs SPY for Intraday
SPY: S&P 500 (market‑cap weighted, broader economy).
QQQ: NASDAQ‑100 ex‑financials (tech‑heavy, risk‑on).
Scenarios
Bullish clean: QQQ > SPY, and both above hourly 9.
Bearish clean: QQQ < SPY, and both below hourly 9.
Chop, green day: Market up but QQQ < SPY → grindy.
Chop, red day: Market down and SPY < QQQ → grindy.
Read strength: Compare % change vs prior close.
2.14 Gaps: What & Why
Markets aren’t 24/7; exogenous events (earnings, geopolitics) reset expectations → open ≠ prior close.
How to trade gaps
Treat the gap range as support (gap‑up) or resistance (gap‑down); draw a gap box.
Unfilled gaps are potent S/R. Above, a bullish gap favors continuation until filled.
If the gap is huge, rely on historic zones to seed new levels within.
2.15 Scalps vs Swings
Scalps: minutes–hours; TF ≤ 1h.
Swings: days–weeks; TF ≥ 1h (prefer daily baseline).
Drill down one TF for refined entries; manage to the anchor TF.
Expiration (rules of thumb)
Stocks (scalps): Mon/Tue → same‑week; Wed/Thu/Fri → next‑week.
Indices (scalps): 1–2 DTE, 1–2 OTM.
Swings: Expiry ≥ consolidation length (often 1–1.5× coil duration).
2.16 Which Timeframe Should You Trade?
Real Trading Hours, 1-2 HR → Day trading & scalps (≤1h TF).
After Hours, 1–2 hr → Swings (≥1 hr, ideally daily).
Less than 1 HR → Multi‑week swings or LTI (weekly charts).
Ross Cameron ScreenerThe 12-Minute Morning Flow (7:00–7:12 ET)
Open “Gap & % Gainers” list (pre-market).
Sort by % change; scan the top 5–10 only.
Hard filters (pass/fail):
Price $1–$20 (sweet spot $5–$10).
%chg ≥ 10% (≥4% absolute minimum).
RVOL ≥ 5× (today vs 30-/60-day avg).
Float ≤ 20M (prefer ≤10M; sub-5M = rocket fuel).
Catalyst check (white-/blacklist below).
Float rotation quick glance: Volume / Float ≥ 1× already? Bump priority if so.
Liquidity guardrails:
Pre-mkt volume ≥ 300k (tighten to ≥ 1M for safer fills).
Bid/ask spread ≤ 1% (or ≤ $0.05 under $10).
Tag 1–3 tickers as A-setups (everything else = B/C or ignore).
Mark headline times to anticipate bursts: 7:00, 7:30, 8:00, 8:30, 9:00, 9:30.
What to Trade (and What to Skip)
A. Green-list catalysts (prefer)
Earnings beats/upside outlook
Clinical results / FDA approvals
Material contracts/partnerships (not fluff)
Sector tailwinds (theme rotation—AI, GLP-1, China ADRs, etc.)
Technical/short-squeeze breakouts (OK even with no news if tape is clean)
B. Red-list catalysts (avoid)
Buyouts / M&A at fixed price (turns into a barcode around deal level)
Obvious promo/pump (OTC, newsletter spam)
Bankruptcy/provisional delisting (too binary; hard to manage risk)
The Scanner Recipe (copy these ideas to your platform)
Universe: All US stocks, price $1–$20, not OTC, primary listing.
% Change: ≥ +10% (pre-market) → sort DESC.
Relative Volume (day): ≥ 5× (or “Volume ≥ 5 × avg 30D”).
Float: ≤ 20M (display float column; you’ll eyeball ≤10M first).
Pre-mkt Volume: ≥ 300k (raise to 1M on choppy days).
Optional momentum toggles: Price > VWAP, Price > 20/50-DMA.
Columns shown: %chg, Price, Volume, RVOL, Float, Sector, News flag, Rotation = Volume/Float.
Fast Prioritization Heuristics
A-tier: Price $5–$10, Float ≤10M, RVOL ≥10×, %chg ≥25%, clean catalyst, tight L2, rotation ≥1×.
B-tier: Price $1–$5 or $10–$20, Float 10–20M, RVOL 5–10×, %chg 10–25%.
Pass: No catalyst and messy tape, float > 50M, RVOL < 3×, thin/illiquid prints.
Timing & Session Edges
Prime window: 7:00–10:30 ET (most of your trades happen here).
Midday: Usually stand down unless a true anomaly trends.
Power hour (15:00–16:00): Only re-engage if the morning leader holds trend/flags above VWAP with volume.
Sizing, Risk & Do-Nots (keeps you alive)
Starter size only until it proves it can hold above VWAP/prev high.
Max risk per trade: 0.25–0.50R of daily stop; daily hard stop set in stone.
Liquidity check: Your order ≪ 2–5% of 1-minute volume.
Respect halts/SSR mechanics; never chase into first spike after a resumption.
No shorting early for beginners—unbounded risk; squeeze risk is real.
Walk away if the tape turns illiquid or spreads blow out.
Quick Read of the Tape (pre-entry sanity)
Level 2: stacked bids, refreshing buyer at VWAP/flag lows, speed of prints increasing on pushes, light volume on dips.
Structure: Clean pre-mkt flag, higher lows, holds pre-mkt high on the open, respects VWAP on pullbacks.
Bad tells: Stuffed breakouts with heavy offers, repeated reclaim-failures of VWAP, volume dying on pushes.
Minimal Watchlist Template (fill it in each morning)
A1: Ticker / Price / %chg / Float / RVOL / Rotation / Catalyst / Pre-mkt high / Levels to watch
A2: …
A3: …
Contingency: 2 B-tier names if the A’s die.
When Nothing Qualifies
Trade nothing. Or relax rules one notch (e.g., RVOL ≥ 3×, Float ≤ 30M) but demand cleaner technicals (above VWAP, tight flags, no overhang).
“Why this works” (mental model)
You’re engineering an extreme supply–demand imbalance:
Demand = big % gap + RVOL + attention (top of list) + credible catalyst
Supply = small float → fast float rotation → squeezes/continuation
Then you ride clean technicals and cut losers fast.
Screener:
www.tradingview.com

UVXY | Volatility Will Pop VERY Soon | LONGProShares Ultra VIX Short-Term Futures ETF seeks daily investment results, before fees and expenses, that correspond to one and one-half times (1.5x) the performance of the S&P 500 VIX Short-Term Futures Index for a single day. The index seeks to offer exposure to market volatility through publicly traded futures markets and is designed to measure the implied volatility of the S&P 500 over 30 days in the future.

Volume Model Live Test #2Targeting a 30% move to the downside with no leverage as part of trend system live test.
NQ Power Range Report with FIB Ext - 11/6/2025 SessionCME_MINI:NQZ2025
- PR High: 25335.75
- PR Low: 25272.00
- NZ Spread: 142.75
No key scheduled economic events
Session Open Stats (As of 2:55 AM)
- Session Open ATR: 420.01
- Volume: 55K
- Open Int: 296K
- Trend Grade: Long
- From BA ATH: -4.0% (Rounded)
Key Levels (Rounded - Think of these as ranges)
- Long: 26636
- Mid: 25410
- Short: 24039
Keep in mind this is not speculation or a prediction. Only a report of the Power Range with Fib extensions for target hunting. Do your DD! You determine your risk tolerance. You are fully capable of making your own decisions.
BA: Back Adjusted
BuZ/BeZ: Bull Zone / Bear Zone
NZ: Neutral Zone
Bitcoin FUDINDEX:BTCUSD has pulled back to the 50% Retracement of the April 2025 low to the October 2025 high at 100,300. This could be a Support to hold up the recent down move.
Bitcoiners have requested the best FUD to affirm that this could be "the local bottom". Bottoms are made in fear so it seems they are trying to manifest as much as possible on social media to confirm this will be as low as it will go for now.
The obvious narrative FUD would be something about how the bull phase of the Halvening price cycle ended precisesly when it was predicted to (at 36 months from the November 2022 bottom) and the bear cycle has begun. However, here I think are some even more scary FUDs for post-Halloween:
The Compound Annual Growth Rate (CAGR) of Bitcoin for the last decade has been in decline. Bitcoin has been going higher and likely will continue to make higher highs and higher lows into the future BUT at a decreasing rate. Bitcoin's price is following a negative exponential curve. Bitcoin will probably make a higher high at some point in the future, this cycle or the next, but the returns to investors will be far less than have been seen in the past and continue to be even less over time.
A more neutral look at future possibilities is to model historic volatility and project the most probable outcome. The 1 Standard Deviation range from today's price for the next 365 days is between 159,600 and 64,800. That means that there is a 68% probability that Bitcoin will trade within this range over the next year. The FUD is that the lower band matches the Volume Profile node from 2024's consolidation creating support in that zone.
Trade wisely.

Bitcoin - A Short Term Correction of Start of a Deeper Decline?Bitcoin and the wider cryptocurrency market have not been immune to the risk aversion running through financial markets this week as traders reassess whether high valuations and excessive positioning across a range of assets is still valid or is due for an adjustment. This reassessment of pricing has seen Bitcoin trade from its highs from October 6th above 126000 down to a low of 98873 only yesterday, that is a drop of 21.7%.
Now of course, the world’s no.1 cryptocurrency can be prone to periods of short-term volatility, however what may be concerning traders this time around is that the reasons for the drop have not been attributed to speculators, or excessive leverage, but long-term holders of more than 6 months liquidating their positions. If true, that could add weight to the theory that the current high of 126304 may remain in place for a prolonged period unless fresh buying interest can quickly return to the market.
When these types of situations arise in a popular asset it is often useful to move back to the charts to check the current technical trends to see if they support a potential direction change.
Once that initial assessment is complete, the next stage is to look to identify potential key support or resistance. These are the levels that could have a directional impact on Bitcoin moving forward, depending on whether they hold further selling interest, cap buying interest or are broken on a closing basis to indicate that a bigger directional move may be in play.
Below is the current technical assessment of Bitcoin.
Technical Update: Bitcoin Wipes Out Summer Gains
October and early November have so far been challenging for Bitcoin, with its price falling 21.7% from the October 6th all-time high of 126304 to yesterday’s low of 98873. This decline has effectively retraced 100% of the price strength built up since the June lows and may see traders watching for signs of stabilisation or further price weakness.
Corrections of this speed and magnitude are not uncommon in crypto, and traders will now be weighing whether the latest decline is another limited pullback within a longer-term uptrend, or an early sign of a broader sentiment shift.
Perhaps the technical picture can offer clues as to the next directional themes…
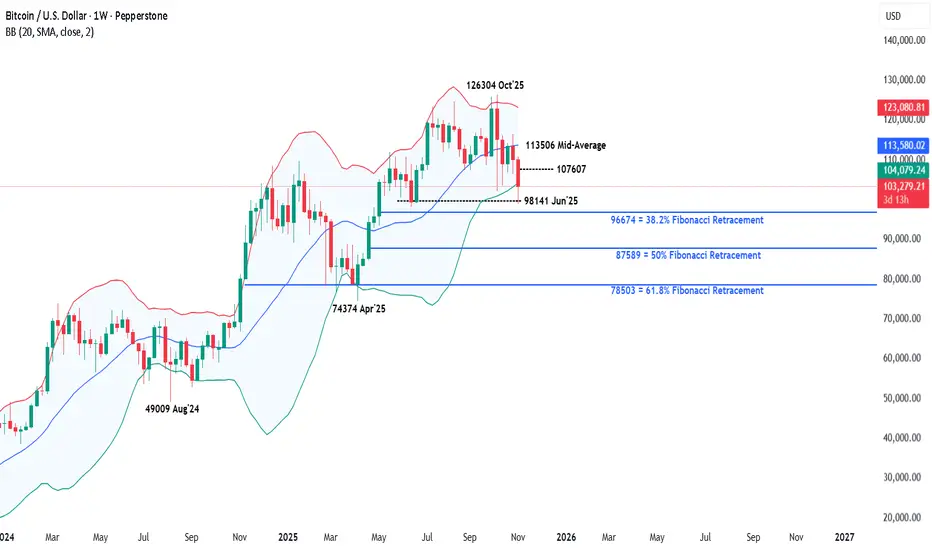
Possible Support Levels:
Much will continue to depend on how future price trends evolve but traders may now be viewing the recent Bitcoin decline as a correction toward a potential support zone at 96674/98141. This area is equal to the 38.2% Fibonacci retracement of the August 2024 to October 2025 rally and the June 2025 monthly low, potentially making it a key focal point for signs of stabilisation or further downside risk.
This 96674/98141 support band now may be watched on a closing basis and classed as a possible pivot to current price activity. While not a guarantee of further price weakness, closes below 96674 might suggest a deeper retracement is possible towards 87589, which is the 50% retracement, even 78503, a level equal to the deeper 61.8% level.
Potential Resistance Levels:
While the 96674/98141 support band continues to limit the current price weakness, it’s possible a reactive recovery is on the cards, especially after the latest 21.7% decline. Traders may now be focusing on 105585, a level equal to the 38.2% Fibonacci retracement of October 27th to November 5th weakness.
If tested, how this level is defended on a closing basis may offer clues to whether further price strength may be on the cards.
If closing breaks above 105585 were to emerge in upcoming sessions this could renew attempts to push to higher levels. Such moves if seen, might then open possibilities to 107607, which is the 50% retracement, even 109775, which is equal to the higher 61.8% level.
The material provided here has not been prepared accordance with legal requirements designed to promote the independence of investment research and as such is considered to be a marketing communication. Whilst it is not subject to any prohibition on dealing ahead of the dissemination of investment research, we will not seek to take any advantage before providing it to our clients.
Pepperstone doesn’t represent that the material provided here is accurate, current or complete, and therefore shouldn’t be relied upon as such. The information, whether from a third party or not, isn’t to be considered as a recommendation; or an offer to buy or sell; or the solicitation of an offer to buy or sell any security, financial product or instrument; or to participate in any particular trading strategy. It does not take into account readers’ financial situation or investment objectives. We advise any readers of this content to seek their own advice. Without the approval of Pepperstone, reproduction or redistribution of this information isn’t permitted.
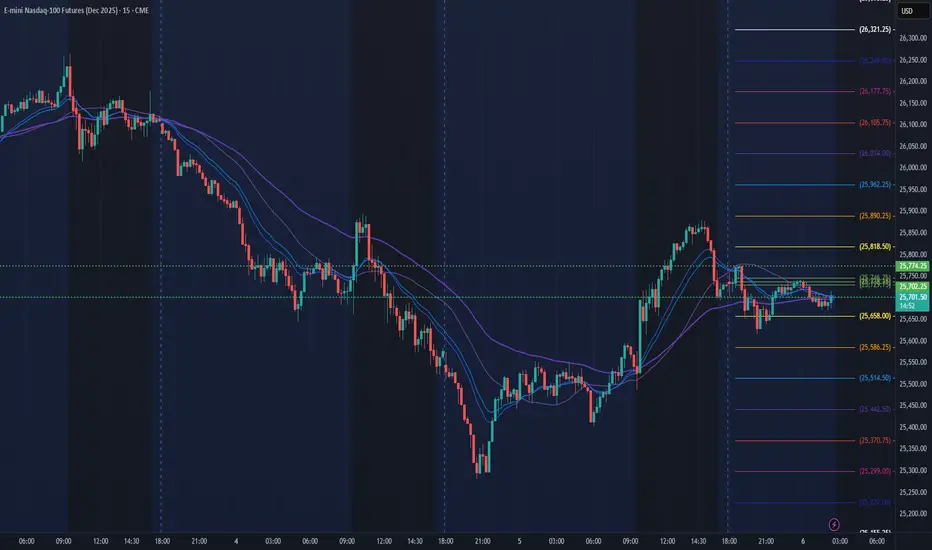
NQ Power Range Report with FIB Ext - 11/5/2025 SessionCME_MINI:NQZ2025
- PR High: 25774.00
- PR Low: 25702.25
- NZ Spread: 160.0
No key scheduled economic events
Session Open Stats (As of 2:15 AM)
- Session Open ATR: 404.54
- Volume: 48K
- Open Int: 289K
- Trend Grade: Long
- From BA ATH: -2.7% (Rounded)
Key Levels (Rounded - Think of these as ranges)
- Long: 26636
- Mid: 25410
- Short: 24039
Keep in mind this is not speculation or a prediction. Only a report of the Power Range with Fib extensions for target hunting. Do your DD! You determine your risk tolerance. You are fully capable of making your own decisions.
BA: Back Adjusted
BuZ/BeZ: Bull Zone / Bear Zone
NZ: Neutral Zone