XMR / USDT Approaching Key Support — 30% Bounce PossibleXMR / USDT is declining aggressively for a healthy retest of a key support zone. If price shows a strong reaction from this level, a clean bounce is expected, with a potential upside move of around 30%. Market conditions remain highly volatile, so proper risk management and confirmation are essential before entry.
Volatilty

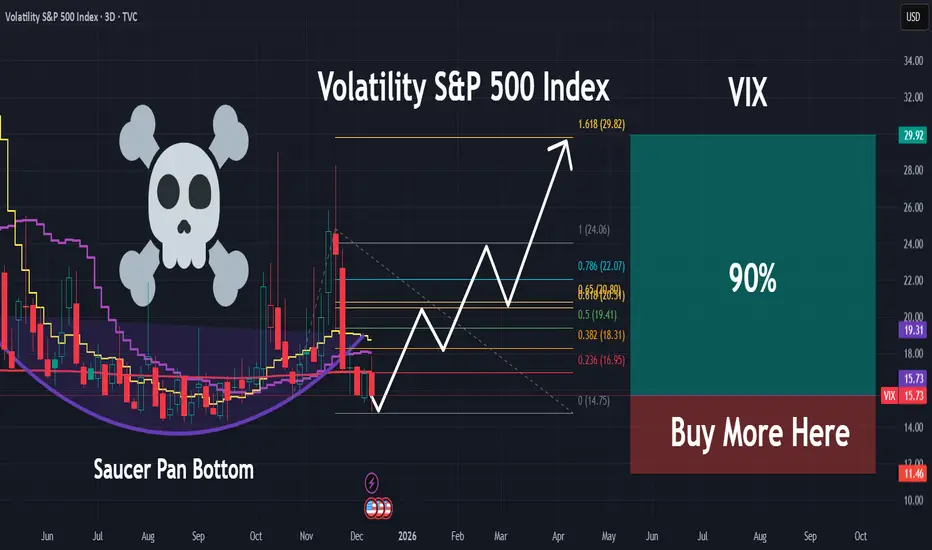
Geopolitics Alert: Greenland, Tariffs & Potential VIX Surge 2026As President Donald Trump ramps up his aggressive foreign policy in early 2026, fresh tariff threats against European allies are stoking fears of a trade war escalation, potentially driving market volatility higher and pushing the VIX (fear gauge) into overdrive.
Trump's January 17 announcement of 10% tariffs starting February 1—rising to 25% by June—on eight European nations (Denmark, Norway, Sweden, France, Germany, the UK, the Netherlands, and Finland) unless they facilitate a U.S. "purchase" of Greenland has sent shockwaves through global markets.
This move, tied to his long-standing obsession with annexing the Arctic territory for national security reasons, risks severe retaliatory measures from the EU, including tariffs on up to $108 billion in U.S. goods.
The standoff is intensifying: European leaders are holding emergency summits, deploying troops to Greenland to assert sovereignty, and rejecting Trump's demands outright, with Danish officials calling it "blackmail."
Trump has not ruled out military options, linking his threats to a perceived Nobel Peace Prize snub, which could fracture NATO alliances and trigger broader geopolitical turmoil.
On X, traders are buzzing about immediate impacts—S&P futures dipping, VIX spiking from 13 to potentially 40 in a flash, and crypto liquidations exceeding $1B amid risk-off sentiment.
Oil prices are already edging higher on China data, but Greenland tensions add uncertainty, pushing safe havens like gold while hammering stocks and autos.
These risks—trade retaliation, alliance breakdowns, and failed annexation attempts—could cascade into major market disruptions, echoing past tariff shocks that tanked equities.
With no deal in sight for Greenland (public support in the U.S. is low at 17%, and force is even less favored), volatility looks set to surge.
Hedging with VIX futures or options isn't a bad idea for protection—better safe than sorry in this high-stakes game.

Weekly Market Outlook,Nifty, BankNifty,S&P 500Nifty closed the week at 25,694, almost flat vs last week, after making a high of 25,899 and a low of 25,473.
As discussed earlier, once again Nifty respected the broader range of 26,150–25,250, keeping the market in a balance phase.
This week’s candle reflects indecision — such structures often act as compression, and once price accepts beyond the range, moves can turn fast.
🔼 Nifty Upside
If Nifty manages to sustain above 25,811 on a 1-hour close, upside levels to watch:
25,900
26,000
26,150
Acceptance above this zone will be key.
🔽 Nifty Downside
If Nifty sustains below 25,600, downside levels open towards:
25,500
25,400
25,200
📌 Structure Summary
25,600–25,811 → balance zone
Above 25,811 → bullish acceptance
Below 25,600 → downside expansion
For now, broader range remains
👉 26,150 – 25,200, unless any major global trigger changes sentiment.
🏦 BankNifty View
BankNifty closed near an important fib zone around 60,092.
If it gives a consecutive close above 60,150, upside levels:
60,360
60,437 (ATH)
60,500
60,700
60,950
Broader range remains
👉 61,200 – 59,000.
🌎 S&P 500
Weekly candle remains indecisive.
Above 6,986 → 7,026 / 7,122
Below 6,885 → 6,780 / 6,700 / 6,469
⚠️ Final Note
Market remains volatile and range-bound.
In such phases, patience matters more than prediction.
Respect levels — let price decide direction.

VIX Signals Rising Market Risk — Swing Trade Focus!📈 VIX Volatility Index — Swing Trade Bullish Setup 🚨
Asset: VIX Volatility Index (Fear Gauge)
Market Type: Index
Trading Style: Swing Trade
🧠 Trade Plan — Bullish Bias
Strategy: Thief Layering Method (Multiple Limit Order Entries)
🔹 Entry Plan
Layered buy-limit approach to capture volatility expansion from value zones.
🟦 Buy Limit Layers:
• 14.50
• 15.00
• 15.50
👉 You may increase or adjust layers based on your own risk appetite and capital size.
📌 Why Layering Works on VIX?
Volatility often expands in waves. Layering helps build position strength during uncertainty instead of chasing price.
🛑 Stop Loss (Risk Control)
❌ Thief SL: 14.00
⚠️ This SL is not mandatory. Adjust stop-loss based on your personal risk management plan.
🎯 Target Zone
💰 Primary Target: 17.50
🚔 Police Force Zone → Strong resistance + sentiment trap + overbought conditions may appear.
📤 Smart traders escape with profits, not emotions.
⚠️ Target is flexible — partial profits and trailing stops are always encouraged.
🔄 Related Markets to Watch (Correlation Guide)
📉 S&P 500 / SPX / SPY
• VIX usually moves inverse to equities
• Equity weakness = volatility expansion
• Sharp drops in SPX often trigger fast VIX spikes
📊 VIX Futures
• Futures strength confirms volatility expectations
• Watch near-term contracts for momentum clues
📈 Volatility ETFs
• High beta reaction to VIX movements
• Useful for confirmation, not prediction
📊 Technical Logic Behind This Setup
✔️ VIX measures expected 30-day market volatility, not price direction
✔️ Volatility compresses → then expands aggressively
✔️ Mean-reversion + breakout behavior makes layering effective
✔️ RSI, prior resistance zones, and sentiment shifts align near target area
🌍 Fundamental & Economic Factors to Monitor
📰 High-Impact Events That Fuel VIX
• Inflation data (CPI, PPI)
• Central bank interest-rate decisions
• Employment data (NFP)
• Unexpected economic surprises
🌐 Macro & Sentiment Drivers
• Geopolitical tensions
• Trade disputes & policy uncertainty
• Sudden equity sell-offs
• Risk-off sentiment across global markets
📌 Volatility often rises before panic becomes obvious — stay alert.
🚦 Key Levels Summary
🟢 Support Zone: 14.00 – 14.50
🟡 Reaction Zone: 16.00 – 16.80
🔴 Resistance / Target Zone: 17.50 – 18.00
A clean breakout above resistance may unlock further upside momentum.
⚠️ Risk Disclaimer
Dear Ladies & Gentlemen (Thief OGs),
This is not financial advice.
Profit, loss, stop-loss, and targets are your responsibility.
Trade smart. Protect capital. Take money when market gives.
💬 Drop your view below:
Do you expect fear to rise… or stay calm?
📊 Like, comment & share to support quality volatility analysis.

When Structure and Volatility Align Again — Will History Rhyme?In the past, an ascending triangle combined with a Bollinger Bands squeeze led to a volatility expansion and the start of a directional move.
Currently, price is consolidating within a horizontal channel while Bollinger Bands are compressing again, suggesting another phase of reduced volatility.
Rather than predicting direction, this observation focuses on how market structure and volatility compression often precede expansion , regardless of outcome. The question remains whether history will rhyme once more — to the upside or the downside.
ETHICAL & EDUCATIONAL NOTICE
This content is presented solely for educational and analytical purposes , based on historical price data.
It does not promote or encourage any specific trading method, financial instrument, gambling, leverage, margin usage, short selling, or interest-based activity .
Readers are encouraged to align any financial activity with their own ethical, legal, and religious principles .
⚠️ DISCLAIMER
This material is strictly educational and informational .
It does not constitute financial advice, investment recommendations, or trading instructions.
The author does not provide personalized guidance.
Any decisions made based on this content are the sole responsibility of the individual.

VIX | Major Volatility and Market Correction Incoming | LONGThe VIX Index, formally known as the Cboe Volatility Index, is a real-time market index that represents the market's expectation of 30-day forward-looking volatility for the S&P 500 index. It is widely known as the "fear gauge" because it tends to rise sharply during periods of increased investor fear and market uncertainty.
BTC 1H diagonal compression into Monday: brace for volatatilityI’m tracking a validated descending channel (2 magenta lines) from the Oct highs and two rising supports (2 green lines) from the Nov/Dec base. Price is now pinned near the convergence around 90.6k.
Why the “double lines” matter
The outer lines define the macro boundaries (where reactions repeatedly happened).
The inner lines act like a “decision lane” (where price keeps getting rejected/held).
Together this often produces compression to expansion (volatility tends to increase once the market chooses a side).
What I’m watching (behavior > prediction):
Bullish resolution: 1H close above the upper magenta + next candles hold above (no instant reclaim back under).
Then I treat magenta as support on retest. Upside targets become the next horizontal supply zones (92–94k).
Bearish resolution: 1H close below the lower green + retest fails (closes stay below).
Then I treat green as resistance; downside opens toward 89k first, then deeper supports (mid/low 80s).
Chop warning: wicks through lines with no follow-through = liquidity runs, not confirmation. I don’t trade the wick. I trade the close + hold.
Here's how the lines helped me succesfully time a short recently:
Planned two days earlier, during previous chop at this level, and patiently waited for a retest:
Rule for the weekend / Monday open
I’m not betting on the timestamp of line intersections. I’m bracing for range expansion and waiting for acceptance/rejection on 1H closes.
Not financial advice. This is a volatility warning + structure map, not a signal.

How to Use ATR in TradingViewMaster ATR using TradingView's powerful charting tools in this step-by-step tutorial from Optimus Futures.
ATR, or Average True Range, is a volatility indicator that helps traders measure market movement, set appropriate stop losses, and adjust position sizing based on current market conditions.
What You'll Learn:
Understanding ATR as a volatility measurement tool that tracks price movement regardless of direction
How ATR calculates the average range between highs and lows over a specified period — typically 14
Why rising ATR signals increasing volatility and larger price swings
Why falling ATR indicates decreasing volatility and quieter market conditions
Using ATR to set dynamic stop losses that adjust to current volatility rather than arbitrary dollar amounts
How to calculate stop distances by multiplying ATR by factors like 2x or 3x
Applying ATR for position sizing to maintain consistent risk across different volatility environments
Setting profit targets based on ATR multiples to align with actual market movement
Filtering trade setups using ATR levels to avoid low-volatility periods or confirm breakout momentum
How to add ATR on TradingView via the Indicators menu
Understanding the default 14-period setting and how shorter or longer periods affect responsiveness
Practical examples using the E-mini S&P 500 futures chart
Applying ATR across daily, weekly, and intraday timeframes for risk management and trade planning
This tutorial is designed for futures traders, swing traders, and risk-focused analysts who want to integrate volatility-based risk management into their trading approach.
The methods discussed may help you set smarter stops, size positions appropriately, and adapt your trading strategy to changing market conditions across multiple markets and timeframes.
Learn more about futures trading with TradingView: optimusfutures.com
Disclaimer
There is a substantial risk of loss in futures trading. Past performance is not indicative of future results. Please trade only with risk capital.
We are not responsible for any third-party links, comments, or content shared on TradingView. Any opinions, links, or messages posted by users on TradingView do not represent our views or recommendations.
Please exercise your own judgment and due diligence when engaging with any external content or user commentary.
This video represents the opinion of Optimus Futures and is intended for educational purposes only. Chart interpretations are presented solely to illustrate objective technical concepts and should not be viewed as predictive of future market behavior.
In our opinion, charts are analytical tools, not forecasting instruments.

VIX mid-term TAI've been watching VIX closely since September, and the accumulation has been growing since then and it's not stopped yet, it looks like it set double top and currently is cooling down but the indicators are still very strong and they don't get that strong that often on daily time frame, the VIX may look like it's cooling down for a holiday cheer but it didn't go away yet. So be prepared for a possible volatility to hit again.

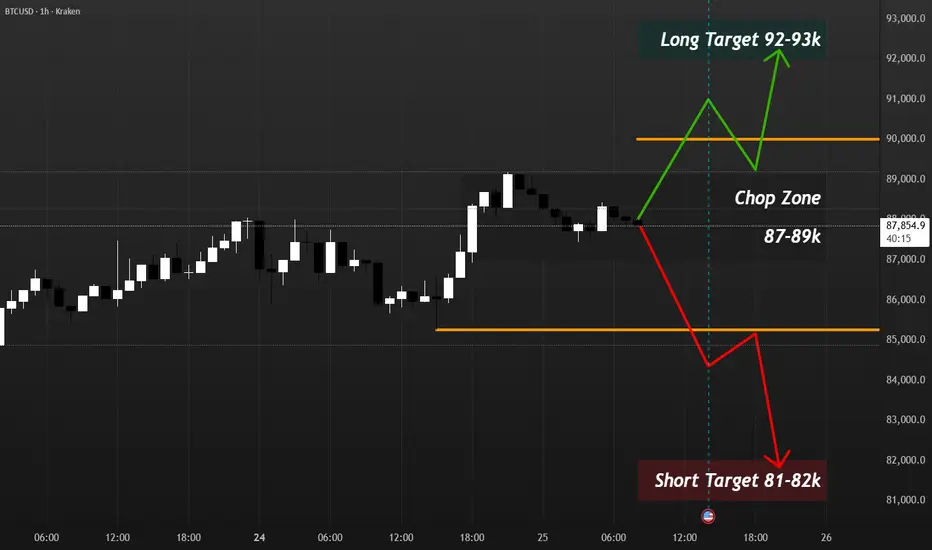
FED days are for levels, not direction.FED days are for levels, not direction. Above 90k I respect the squeeze; below 85.3k I respect the breakdown. Map, not signal.
KRAKEN:BTCUSD BTC is chopping around 88k just under a 1h channel top into FED today/tomorrow. ETF flows look soft and options positioning still leans defensive.
I’m not opening new trades into the announcement. Anything stuck between 87–89k post-FED is a no-trade chop zone for me.
Post-FED: if BTC holds above 90k I’ll only look for pullback longs with 92–93k as context; if it loses 85.3k and can’t reclaim, I’ll lean into shorts toward 82–81k. Map, not signal.
MU - 160 / 260 Strangle Iron Condor IVR has expanded heavily in MU over the past several trading days.
Going to sell some options outside the 1 standard deviation in December to try and capture a IV contraction ..

ETHEREUM(ETH/USD): Consolidation – The Silence of VolatilityEven though ⚠️ETHEREUM is trading in a bearish trend since October, 📉
The pair has been in a deep consolidation, since the last 3 days 🗓️
The price is currently testing a strong horizontal support level where the price is consolidating. ↔️
Because the trend is strongly bearish, chances will be high to see
a further bearish continuation. 🐻
Your reliable confirmation will be a breakout and a 4H candle close below the underlined support. 🕯️
The next goal for the sellers will be 2840 🎯
Alternatively, the market may continue consolidating and trading within the range. 🔄

BTC at HTF Shelf: Execute Only on ≥2H Reversal__________________________________________________________________________________
Market Overview
__________________________________________________________________________________
Risk-off momentum drove Bitcoin into a dense multi-timeframe demand shelf, where price is probing for a reaction after losing 98k–100k. The next impulse likely comes from the battle around 95.8–95.9k and whether buyers can stage a clean reversal.
Momentum: Bearish drive into HTF demand; intraday trend remains down while daily is mixed-to-up in the background.
Key levels:
- Resistances (12H/1D): 97,300–98,200; 100,000; 101,600–103,000
- Supports (2H/4H/12H/1D): 95,820–95,920; 95,200–95,000; 92,000
Volumes: Very high on 12H and below (sell waves); normal on 1D — momentum is flow-driven, not a pure volume vacuum.
Multi-timeframe signals: 12H/6H/4H/2H/1H downtrends; 1D uptrend — execution should respect 12H Down unless ≥2H prints a confirmed reversal at 95.8–95.9k.
Harvest zones: 95,900 (Cluster A) / 95,000–95,200 (Cluster B) — ideal dip-buy zones for inverse pyramiding if a ≥2H reversal confirms.
Risk On / Risk Off Indicator context: Neutral Sell — confirms the risk-off push and argues for patience on longs unless the cluster defends with real follow-through.
__________________________________________________________________________________
Trading Playbook
__________________________________________________________________________________
We operate in a corrective, risk-off tape pressing into HTF demand; take a tactical stance and let ≥2H confirmation lead.
Global bias: Neutral Sell while under 98,000–100,000; key invalidation for shorts = reclaim and close above 98,000 with follow-through.
Opportunities:
- Buy: Only on a ≥2H bullish reversal from 95,800–95,900; target 96,600–97,000 then 97,800–98,200.
- Breakout: Reclaim >98,000 with momentum → ride into 100,000 then 101,600–103,000.
- Tactical sell: Fade failed retests at 97,800–98,200 or a ≥2H close below 95,800 with a failed retest.
Risk zones / invalidations: A sustained ≥2H close below 95,800 would invalidate the bounce idea and open 95,200–95,000, then 92,000.
Macro catalysts (Twitter, Perplexity, news): Heavy spot ETF outflows reinforce risk-off; global equities in broad risk-off; upcoming FOMC/CPI could shift dollar/liquidity and the crypto beta.
Harvest Plan (Inverse Pyramid):
- Palier 1 (12.5%): 95,900 (Cluster A) + reversal ≥2H → entry
- Palier 2 (+12.5%): 92,100–90,100 (-4/-6% below Palier 1)
- TP: 50% at +12–18% from PMP → recycle cash
- Runner: hold if break & hold first R HTF (97,800–98,200 zone)
- Invalidation: < HTF Pivot Low 95,000 or 96h no momentum
- Hedge (1x): Short first R HTF on rejection (97,800–98,200) + bearish trend → neutralize below R
__________________________________________________________________________________
Multi-Timeframe Insights
__________________________________________________________________________________
HTF uptrend (1D) conflicts with intraday downtrends, placing the burden of proof on buyers at the 95.8–95.9k shelf.
12H/6H/4H/2H/1H/30m/15m: Downtrends with very high sell-side volume; repeated tests of 95.8–95.9k raise risk of a flush if it fails, while failed breakdowns can spring sharp squeezes into 97.3–98.2k.
1D: Still up but losing momentum; the 95.8–96.0k cluster aligns with multiple prior pivot lows — a defendable shelf if buyers print a clean reversal and reclaim 97.8–98.2k.
Divergences/confluences: ISPD DIV = BUY at the cluster while Risk On / Risk Off Indicator = Neutral Sell — confluence for reactive bounces only, not blind catching; wait for ≥2H confirmation.
__________________________________________________________________________________
Macro & On-Chain Drivers
__________________________________________________________________________________
Macro risk-off and ETF outflows pressure BTC; the path hinges on whether flows stabilize and the 95.8–95.9k shelf holds.
Macro events: Global equities are risk-off; energy/geopolitics keep volatility elevated; upcoming FOMC/CPI loom as catalysts that can swing liquidity and risk appetite.
Bitcoin analysis: Breakdown below 100k with a six-month low near ~97k; weekly close vs ~101k is pivotal. Heavy ETF outflows and liquidations weigh unless key resistances are reclaimed.
On-chain data: Long-term holders have been distributing, but sellers show signs of exhaustion — a setup for relief if flows stabilize and levels reclaim.
Expected impact: If the shelf holds and outflows cool, a relief bounce toward 97.8–98.2k and 100k is likely; otherwise, a clean failure risks 95.0k then 92k.
__________________________________________________________________________________
Key Takeaways
__________________________________________________________________________________
We are in a corrective, high-volatility test of a dense demand cluster.
- Trend: Intraday bearish within a mixed HTF context; respect 12H Down unless ≥2H prints a clean reversal.
- Best setup: Reactive long only on a ≥2H reversal at 95.8–95.9k; otherwise fade failed retests at 97.8–98.2k.
- Macro factor: ETF outflows are the main headwind; watch FOMC/CPI for a regime nudge.
Stay patient, let the shelf prove itself, and treat each move like a boss fight — confirm the phase before committing.
Bitcoin Playbook: Neutral‑Sell Below 106.5k, Buy Floors__________________________________________________________________________________
Market Overview
__________________________________________________________________________________
Price is compressing beneath overhead supply as a rebound from sub‑$100k meets the 2H/1D resistance shelf. Momentum is tactically capped unless 104.8k converts to support; dips into HTF floors remain the higher‑quality rotations.
Momentum: Cautiously bearish tilt (range‑within‑compression) as bounces probe 104.8k supply while 12H/6H trends point down.
Key levels:
- Resistances (2H/1D/HTF): 104,845 (2H pivot) • 106,460 (1D pivot high) • 111,577 (HTF band)
- Supports (1D/12H/4H–6H): 101,550–100,395 (near‑cluster) • 99,241–99,396 (tight 4H/6H cluster) • 98,243 (weekly pivot low)
Volumes: Normal overall; 12H shows moderate spikes only as an amplifier near key levels.
Multi-timeframe signals: 1D = Up vs 12H/6H/4H/2H = Down; structure favors fading 104.8k–106.5k unless 2H/1D acceptance prints. Longs are higher quality on 101.6k–100.4k reactions with ≥2H confirmation.
Harvest zones: 99,300 (Cluster A) / 96,800–97,300 (Cluster B). Ideal dip‑buy areas for inverse pyramiding with confirmation, using Cluster A as the initial anchor.
Risk On / Risk Off Indicator context: Neutral sell bias; this risk‑off tilt confirms the preference to sell rallies into resistance and be selective on dips.
__________________________________________________________________________________
Trading Playbook
__________________________________________________________________________________
The dominant stance is neutral‑sell while price sits under 104.8k–106.5k; lean short into supply and buy only confirmed HTF floors.
Global bias: Neutral‑sell below 106,460; upside bias resumes only on daily acceptance above 106,460.
Opportunities:
- Tactical sell: Fade 104,845 on rejection with 15m–2H confirmation; target 103,500 then 101,550–100,395.
- Tactical buy: Sweep/reclaim 101,550–100,395 with ≥2H bullish close; target 104,845 then 106,460.
- Breakout buy: Reclaim/hold above 104,845 on 1H–2H and buy the successful retest toward 106,460.
Risk zones / invalidations:
- Break and daily hold above 106,460 would invalidate near‑term shorts and unlock higher.
- Sustained closes below 100,395 would invalidate tactical longs and expose the 99.4k cluster or worse.
Macro catalysts (Twitter, Perplexity, news):
- Easier funding backdrop (lower SOFR/MOVE) supports risk but remains conditional.
- Potential US shutdown resolution and policy chatter on leveraged spot crypto trading = headline volatility risk.
- Fed cut with a hawkish tone keeps cross‑asset risk mixed; wait for confirmations at levels.
Harvest Plan (Inverse Pyramid):
- Palier 1 (12.5%): 99,300 (Cluster A) + reversal ≥2H → entry
- Palier 2 (+12.5%): 95,300–93,300 (-4/-6% below Palier 1)
- TP: 50% at +12–18% from PMP → recycle cash
- Runner: hold if break & hold first R HTF (104,845)
- Invalidation: < HTF Pivot Low or 96h no momentum
- Hedge (1x): Short first R HTF on rejection + bearish trend → neutralize below R
__________________________________________________________________________________
Multi-Timeframe Insights
__________________________________________________________________________________
Across TFs, growth impulses are capped by 104.8k–106.5k while high‑quality demand sits at 101.6k–100.4k and 99.4k.
1D: Uptrend attempt but still beneath 106,460; acceptance above that level would open room to unwind the HTF supply.
12H/6H/4H: Downtrend bias; current leg is a rally into 104,845 resistance. Failure here typically rotates price back into 101,550–100,395, with 99,241–99,396 as secondary demand.
2H/1H/30m/15m: Execution battleground at 104,845; LTF momentum can trap unless 104,845 flips to support. Look for wick rejections at resistance or strong reclaim signals at HTF floors.
Major divergence: 1D Up vs 12H Down keeps conviction muted; trade level‑to‑level with confirmation.
__________________________________________________________________________________
Macro & On-Chain Drivers
__________________________________________________________________________________
Macro is cautiously supportive via easier funding but headline‑driven; crypto policy chatter could catalyze volatility around range edges.
Macro events: Lower SOFR/MOVE ease financial conditions, but a potential US shutdown resolution and ongoing Fed communication keep risk skittish; volatility pockets likely around key data and policy headlines.
Bitcoin analysis: Price coiling in a ~$98k–$108k window; topside requires 104k+ acceptance, while loss of 98.5k would degrade structure. HTF floors align with the technical buy zones.
On-chain data: Mixed signals and sporadic supply awakenings; no decisive impulse, reinforcing the need to trade from well‑defined levels.
Expected impact: Macro/on‑chain are not overriding; they reinforce a neutral‑sell technical bias and level‑driven executions.
__________________________________________________________________________________
Key Takeaways
__________________________________________________________________________________
BTC is compressing under resistance with a risk‑off tilt; patience at levels remains the edge.
- Trend: Neutral with bearish lean until 104,845 flips and 106,460 holds.
- Best setup: Fade 104,845 rejections; buy only confirmed reactions at 101,550–100,395 and, if needed, 99,241–99,396.
- Macro: Easier funding helps, but policy headlines can quickly shift tone.
Stay disciplined: harvest volatility at the edges and let confirmation lead, not anticipation.

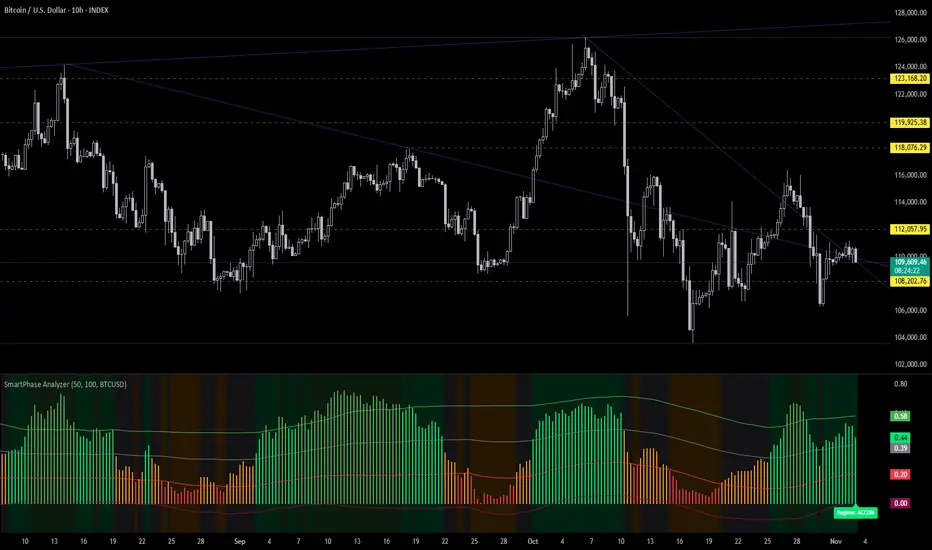
Temporal Drift Alpha | Rotating Volatility | Hidden Rhythm🧠 Deep Dive: Hidden Alpha in Odd Intraday Charts
Been experimenting lately with non-standard intraday timeframes on TradingView — specifically the 10-hour chart — and it’s producing some really interesting results.
My 1D strategies only needed minor calibration to fit intraday conditions (mainly risk and signal sensitivity tweaks), but once adjusted, they started performing significantly better on 10H than on standard 4H / 12H / 1D setups.
Here’s why I think it’s happening 👇
⚙️ 1. Uneven time alignment = session drift
10H doesn’t divide evenly into 24H, so candle start times rotate across the global trading cycle (Asia → London → NY).
That means each bar is pulling from a different combination of regional liquidity and volatility windows — you’re not seeing the same “slice” of the day over and over.
- 06:00 → overlaps Asia close + London open
- 16:00 → overlaps US open
- 20:00 → catches late NY + early Asia handoff
This rotation keeps repeating every couple of days, giving you asynchronous snapshots of how the market behaves between sessions — and that’s where inefficiencies tend to hide.
📊 2. Structural alpha exposure
By breaking away from the standard 8H / 12H / 1D alignment, you end up:
- Capturing transition volatility (session overlaps)
- Avoiding compressed daily smoothing
- Getting more responsive structure shifts for trend/momentum setups
It’s basically giving you a rotating volatility lens. You’re still seeing the full picture, but through different angles each cycle.
🧩 3. Strategy behavior differences
On the 10H:
- Momentum filters trigger cleaner — fewer false breaks
- Mean reversion signals reset faster after exhaustion
- BB, RSI, EMA-type systems react smoother, since the noise from hard session resets (like 00:00 UTC) is reduced
I’m seeing way fewer “dead zones” between signals — and overall smoother PnL curves, even with identical logic.
📈 4. Practical takeaway
Odd-hour timeframes like 10H act like a “rotating frame sampler” for the market.
They shift through liquidity regimes automatically — giving you a natural form of temporal diversification.
If your 1D systems are solid but a bit laggy or overly smoothed, try re-anchoring them on 10H, 14H, or 22H and recalibrating your risk and confirmation filters slightly.
There’s legit structural alpha buried in how these bars cut across the global cycle.
🧠 TL;DR
10H charts = not random noise.
They’re asynchronous time slices that expose unbalanced session transitions — something most backtests miss.
I’ll be running deeper tests on return bias and volatility clustering per candle start hour (06:00, 16:00, 20:00, etc.), but early signs point to repeatable behavior .
This could be one of those tiny structural edges that compounds over time.
Sometimes alpha isn’t in new indicators — it’s in how we slice time. ⏳⚡️
Why Bitcoin’s 4-Year Cycle Might Be Its Biggest LimitationFor years, traders have treated Bitcoin’s 4-year halving as sacred — a mechanical driver of boom and bust. But what if the real reason these cycles repeat isn’t the code… but the crowd?
Mechanically, Bitcoin’s issuance schedule is a smooth, predictable decline. The halving simply adjusts the slope of supply — it doesn’t dictate price. Yet, like clockwork, markets rise and fall every four years. Why?
Because we expect them to.
This expectation creates a self-fulfilling feedback loop:
- Pre-halving optimism fuels accumulation and speculative positioning.
- Post-halving euphoria drives parabolic rallies as new participants flood in.
- Overvaluation and leverage eventually unwind, triggering brutal corrections.
The halving became the metronome of market psychology — a narrative so powerful that it shaped behavior more than fundamentals ever did.
🧠 The Institutional Shift
Now, that narrative is being rewritten.
Institutions don’t trade on memes or cycles — they trade on models, liquidity, and risk.
Unlike retail investors, institutions hate volatility. They don’t chase euphoria; they manage exposure.
- ETFs and funds accumulate steadily through structured inflows.
- Option and futures desks hedge risk dynamically, suppressing volatility.
- Algorithmic allocators rebalance based on Sharpe ratios, not halving hype.
This structural participation acts as a volatility dampener — flattening the amplitude of Bitcoin’s historic boom-bust waves.
🌍 From “Halving Cycle” to “Liquidity Cycle”
As Bitcoin matures, the real driver of its price action is shifting away from internal events and toward macro liquidity conditions :
- When global liquidity expands (rate cuts, QE, easing credit), Bitcoin thrives.
- When liquidity contracts (rate hikes, QT, risk-off sentiment), Bitcoin cools.
In this new phase, the halving’s scarcity still matters — but it’s no longer the heartbeat.
Instead, Bitcoin is syncing to the rhythm of global capital flows.
📈 The New Market Identity
We’re watching Bitcoin transition from a reflexive narrative asset to a macro-integrated store of value .
If this continues, the implications are profound:
- Shallower drawdowns and fewer liquidation cascades.
- More consistent accumulation across cycles.
- Higher institutional allocation as volatility compresses.
Ironically, the same psychological loop that once fueled Bitcoin’s meteoric rise may now be what caps its potential.
The halving didn’t make Bitcoin cyclical — investor behavior did .
And as smart money takes over, that feedback loop may finally be breaking.
🚀 What This Might Mean for Future Bull Runs
If institutions continue to dominate Bitcoin’s liquidity, the next bull runs may look less like fireworks and more like steady expansion — smoother, slower, but more sustainable.
Instead of 12-month parabolas followed by multi-year winters, we could see:
- Extended accumulation phases where price grinds higher over longer horizons.
- More efficient corrections that reset leverage without catastrophic selloffs.
- Reduced retail blow-off tops as narrative-based speculation loses power.
That doesn’t mean the explosive upside is gone — it means the path to higher valuations might look more like a compound growth curve than a recurring bubble.
The next phase of Bitcoin’s evolution isn’t about chasing the halving — it’s about understanding liquidity, positioning, and psychology on a global scale.
- The crowd traded Bitcoin like a story.
- Institutions are turning it into a system.

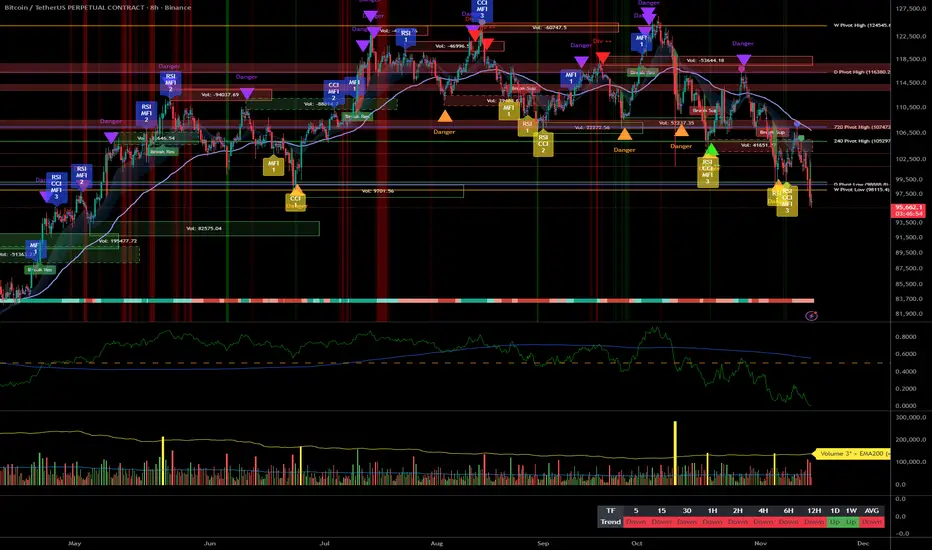
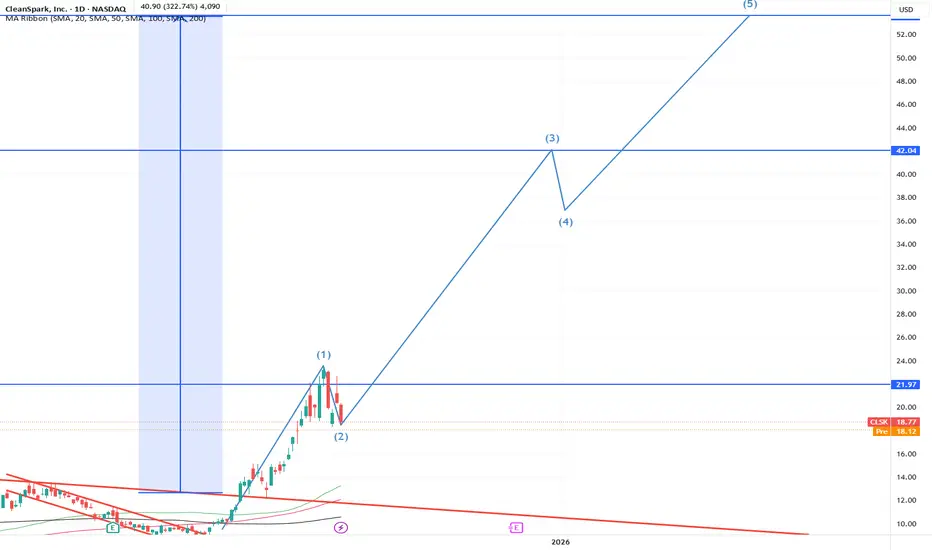
CLSK, Gold and implied volatility highest since 2021 - get readyDJT inflated the volatility balloon. We can see that on all asset classes. VIX(SPX) and DVOL(BTC) implied volatility shows price target of 7100pts and 144kUSD per BTC accordingly by EOY. That means that big move is ahead of us.
Yesterday, there was a large profit-taking in gold and seems gold will stay relatively muted for some time.
Now the question is where money from gold will go into? Also fed announced faster rate cut pace - Bonds will have much lower premium.
So my expectation is that money will flow from gold and bonds market to the risk assets like SPX, emerging markets na BTC. I dont need to explain how higher BTC price will influence CLSK share price.
STAY PUT !
Long, medium term CLSK is glued to BTC performance. But... daily/weekly CLSK tends to be leading indicator to BTC not BTC to CLSK like most people think. We can see it right now - Yesterday BTC was up but miners were down and today BTC is again back below 110k. That's due to much lower liquidity
don't get fooled by short term moves huge bull run is ahead of us !
Not financial advice just sharing my observations and thoughts.
P.S. I put money where my words are - Yesterday I bought additional ~500 shares.
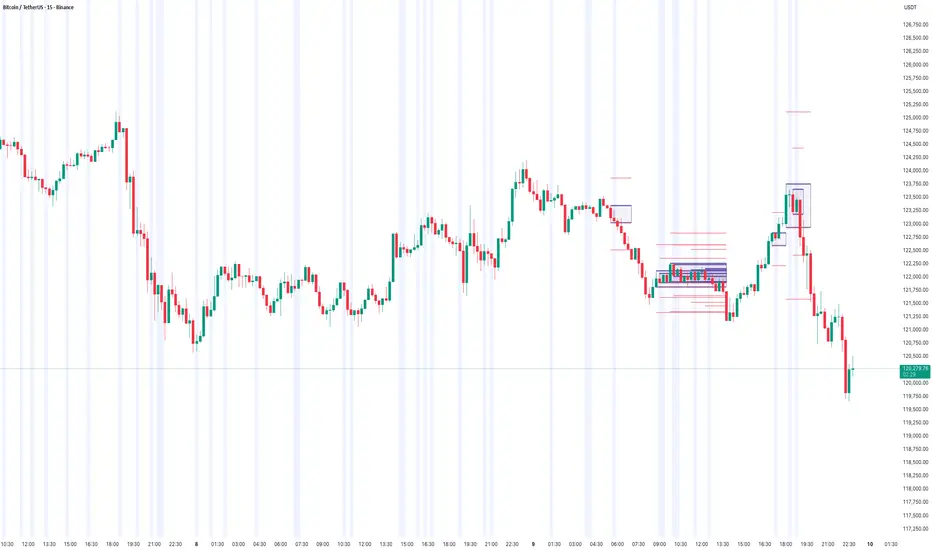
How to use Candle Range Detector – Fibo-Based Volatility mapping🧠 Concept Overview
The Candle Range Detector (CRD) visualizes how market volatility expands and contracts across time.
Instead of using a static multiplier, it applies Fibonacci ratios (0.618, 1.0, 1.618, 2.618, etc.) to dynamically scale candle ranges, helping traders spot where price might react or exhaust.
Each detected candle range forms a zone or band representing potential continuation or reversal interest areas.
This adaptive approach captures market rhythm more naturally than uniform multipliers.
⸻
⚙️ How It Works
1. Range Detection:
The indicator measures the true range (high–low) of key candles and maps them forward on the chart.
2. Fibonacci Expansion Logic:
Instead of a normal “x times range” multiplier, Fibonacci levels are used to project natural extensions and contractions from each candle’s body or wick.
3. Zone Formation:
Each candle’s range forms a rectangular area (as shown on your chart).
• Thicker Boxes: Represent strong impulsive candles or high-volume bars.
• Lighter Boxes: Represent pullback or resting candles.
4. Automatic Overlap Handling:
When two zones overlap, the indicator visually merges them, highlighting confluence where multiple candle ranges align — a sign of strong market memory.
⸻
📊 How to Interpret
• When price revisits a previously detected Fibonacci expansion zone, it often reacts (pause or reversal).
• A cluster of zones at similar levels acts like a dynamic supply/demand region.
• Breakouts beyond upper/lower Fibonacci bands may indicate trend continuation.
• Tight clusters of small ranges suggest compression – potential breakout setup.
⸻
💡 Practical Use-Cases
• Identify where short-term volatility clusters before big moves.
• Spot pullback re-entries aligned with prior expansion zones.
• Detect imbalance areas that later act as resistance/support.
• Enhance confluence with volume, VWAP, or order flow indicators.
⸻
🧩 Customization Tips
• Fib Ratios: You can select or deselect Fibonacci levels from the settings panel. Right now its set to 1.618
• Zone Opacity: Adjust transparency to visualize overlaps better.
• Lookback Range: Control how many historical ranges are plotted for context.
⸻
🏁 Summary
The Candle Range Detector (Fibonacci Mode) transforms traditional range analysis into a visual map of volatility zones.
By using Fibonacci expansion instead of arbitrary multipliers, it synchronizes with natural market rhythm and highlights where liquidity and volatility converge.
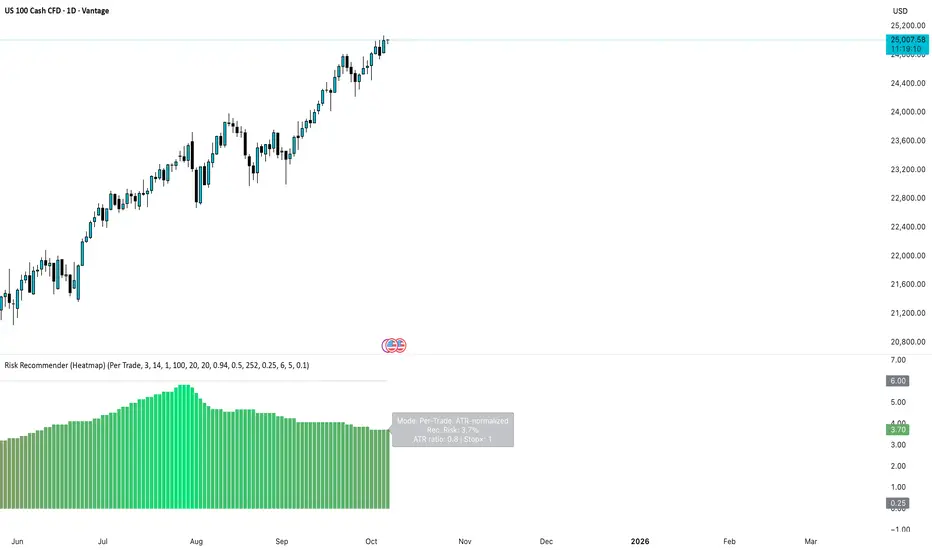
Stop Guessing Risk — Start Measuring It Like a QuantStop deciding risk based on emotion or setup. Do what quants do. Measure volatility and let it define your risk.
Most traders size positions emotionally:
• "This setup looks strong, I’ll double size."
• "I’m not sure, so I’ll go small."
→ Both are inconsistent and lead to unstable performance.
Professionals and systematic traders use a simple principle:
Risk is not a feeling, it’s a function of volatility.
⚙️ The concept
Markets breathe in volatility cycles. When volatility expands, risk should contract.
When volatility contracts, risk can expand.
Your position size should adapt automatically to those cycles.
This Idea demonstrates the logic behind the new 📊 Risk Recommender — (Heatmap) indicator, a tool that quantifies how much of your equity to risk at any time.
🧮 How it works
The indicator offers two complementary modes:
1️⃣ Per-Trade (ATR-based)
• Compares current volatility (ATR) to a long-term baseline.
• When market noise increases, it suggests smaller risk per trade.
• When conditions are quiet, it recommends scaling up—within your own floor and ceiling limits.
2️⃣ Annualized (Volatility Targeting)
• Computes realized and forecast volatility (EWMA-style).
• Adjusts your base risk so your overall exposure stays near a target annualized volatility (e.g., 20%).
• The same math used in institutional risk models and CTA frameworks.
🎨 Visual interpretation
The heatmap column acts as a “risk thermometer”:
• 🟥 Red = High volatility → scale down
• 🟩 Green = Low volatility → scale up
• Smoothed and bounded between your chosen floor and ceiling risk levels.
• The label shows current mode, recommended risk %, and volatility context.
💡 Why this matters
Risk should *never* depend on how confident you feel about a trade.
It should depend on how loud or quiet the market is.
Volatility is the market’s volume knob and this indicator helps you tune your exposure to the same frequency.
📈 Example use case
• NASDAQ volatility spikes → recommended risk drops from 3.0% → 1.2%
• SPX volatility compresses → risk rises gradually → 4.5%
You stay consistent while others overreact.
🚀 Automating it
My invite-only strategy applies this logic automatically to manage exposure in real time.
Combine it with the Risk Recommender indicator for full transparency and adaptive position sizing.
🎯 Summary
✅ Stop guessing risk size.
✅ Let volatility guide you.
✅ Keep risk constant, results consistent.
That’s how quants survive. That’s how traders evolve.
#RiskManagement #Volatility #ATR #PositionSizing #Quant #TradingStrategy #AlgorithmicTrading #SystematicTrading #Portfolio #EWMA #RiskControl
Short Volatility during rare spikes using leveraged ETF $UVXYOverview
Volatility represents how greatly an asset’s prices swing around the mean price. Historically there are rarely brief volatility flare-ups that present trading opportunities. Trying to anticipate volatile events can be costly, because other market participants generally expect the same well known events, and one never knows how big a volatility spike might arise from a given event. Instead if one merely awaits extreme volatility events, which historically are ephemeral, there's a higher probability trade in shorting it. I've thought about this previously, and took the opportunity with Liberation Day to successfully short volatility.
Volatility Instrument Selection
Choosing an appropriate instrument can aid in the likelihood of a successful short position. Among the options CBOE:UVXY looks attractive for the trade, because it's a leveraged ETF, is highly liquid, and provides options with granular strike prices and expiration dates. Leveraged ETFs are known to decline over time due to
Daily rebalancing and compounding effects
Volatility drag
Cost of leverage
Management fees and expenses
Path dependency
These characteristics of leveraged ETFs provide a structural tailwind to a short position, because the instrument naturally declines over time. This phenomenon easy enough to see on a CBOE:UVXY weekly chart
Moreover selection of a liquid product is prudent. At the time of writing CBOE:UVXY has an average daily volume north of $22 million dollars for the past 30 days.
Trade execution
Execution of the trade starts with recognition of a highly volatile event, this is both technical and discretionary. From there a trader is advised to use their preferred tactics to select entry, stop-loss and exit points. Personally I like to use chart patterns across different timeframes in tandem with Relative Strength Index, and to a lesser extent volume to identify trading setups. I use longer term charts to identify a trend, and shorter timeframe charts to determine entry and exit points. The timeframe(s) depend on the particular instrument and what the charts look like at the time of the trade.
During the Liberation Day Volatility Short trade, I've been using 1W, 1D, 4H and 1H charts.
The 1H chart has been suitable for entering an exiting trades. Head & Shoulders patterns have manifested both on price and momentum alongside declining volume. I've posted a couple CBOE:UVXY minds along the way.
Additional Thoughts
Volatility can also be used generally to anticipate moves in other asset classes, such as stocks, bonds, crypto and commodities. Using the levels from that last chart fed into successful NASDAQ:TQQQ & NASDAQ:SQQQ trades in the aftermath of Liberation Day.

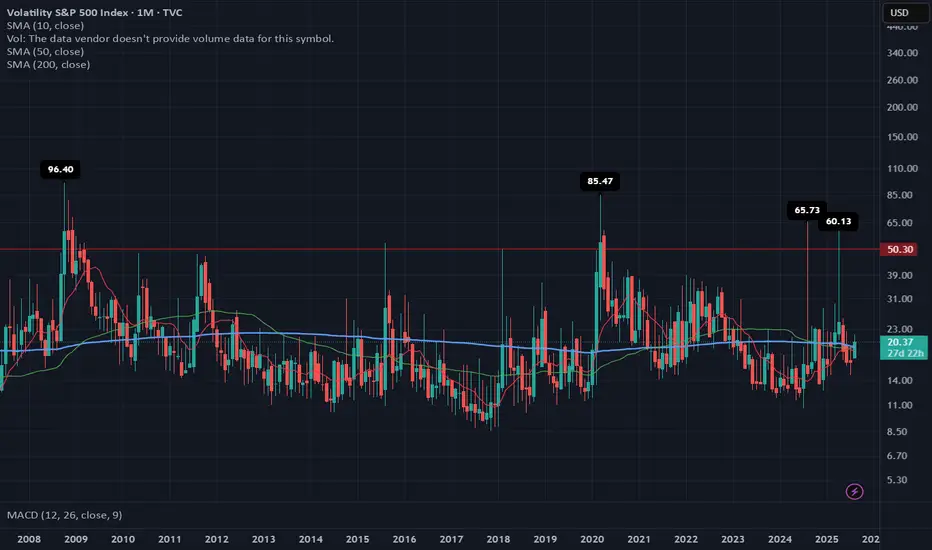
VIX: From “Calm Tension” to a ReboundWhy does a small uptick matter today… if we’ve already seen 60+ readings four times in the past 17 years?
The first week of August 2025 brought back a familiar market force: volatility.
The VIX, which tracks expected fluctuations in the S&P 500, jumped 21% in just a few days, rising from 17.4 to 20.37, with an intraday high of 21.9 on August 1.
At first glance, the move may seem minor. But it broke through key long-term moving averages (SMA 50 and 200) and exited its recent comfort zone (14–19 pts). That alone is enough to make portfolio managers and traders pay attention again.
🔙 Historical context: when the VIX truly spiked
📅 Date 🔺 VIX intraday 🧨 Trigger
Oct 1, 2008 96.40 Subprime mortgage crisis, Lehman collapse, AIG bailout
Mar 2, 2020 85.47 COVID-19 global spread, border shutdowns
Aug 5, 2024 65.73 Surprise Fed rate hike + overheated jobs data
Apr 7, 2025 60.13 Panic over new U.S. tariffs on global partners
Compared to those moments, today's VIX levels look “mild.” But the technical and macroeconomic signals suggest that volatility may be establishing a new baseline.
1. 📊 Breakdown: First week of August 2025
Weekly increase: from 17.4 → 20.37 (+21%).
Technical breakout: monthly close above both the 50-day and 200-day simple moving averages (SMA 19.25 and 19.45).
MACD on the monthly chart has flipped positive for the first time since March 2023.
Key drivers:
🏛️ The Fed left interest rates unchanged on July 30, but two dissenting votes favored a rate cut.
👷♂️ Softening jobs data: July NFP came in at only +73,000 jobs (vs. +110,000 expected).
🧾 New U.S. tariffs, announced on August 1, reignited inflation concerns.
2. ⚖️ Comparing August 2025 to the August 2024 storm
Factor August 2024 August 2025 (Week 1)
🔺 VIX peak 65.73 21.9
🏛️ Fed stance Surprise 25 bp rate hike Rates unchanged, internal division
👷 Labor market Hot, wage pressures Cooling down
📉 S&P 500 reaction −12% in 3 weeks Approx. −3% decline underway
💧 Market liquidity Very low (pre-market) Normal
Conclusion:
2024 was a systemic shock.
2025 is more of a volatility warning sign—but one that matters for risk management.
3. 📍 Technical signals to monitor
The monthly MACD just turned positive, which historically precedes sustained volatility spikes.
Key short-term range: 18–22 pts. A sustained close above 22 could trigger heavy selling in high-beta stocks.
Options expiration (OPEX, Aug 16) may amplify moves via gamma flows.
4. 🔮 What could move the VIX next?
📅 Date 📌 Event ⚠️ Volatility Risk
Aug 14 Core CPI (July) Reading above 0.3% m/m could reignite hawkish Fed bets
Aug 22–23 Jackson Hole Symposium Powell’s speech could reset the policy outlook
End of Aug Q2 GDP revision Confirm whether slowdown = soft landing or stagflation
📌 Note: The VIX cannot be traded directly. Exposure is typically obtained through futures, options, or ETNs—each with specific risks like contango, low liquidity, and roll decay.
📌 Final thoughts
The VIX doesn’t need to hit 60 to send a message.
The fact that it’s breaking above long-term averages, reacting sharply to macro data, and threatening key levels is enough to suggest that the era of ultra-low volatility may be ending.
History shows us that major VIX spikes come fast and unannounced.
If you remember 2008, 2020, or even April 2025—you know that preparation beats prediction.
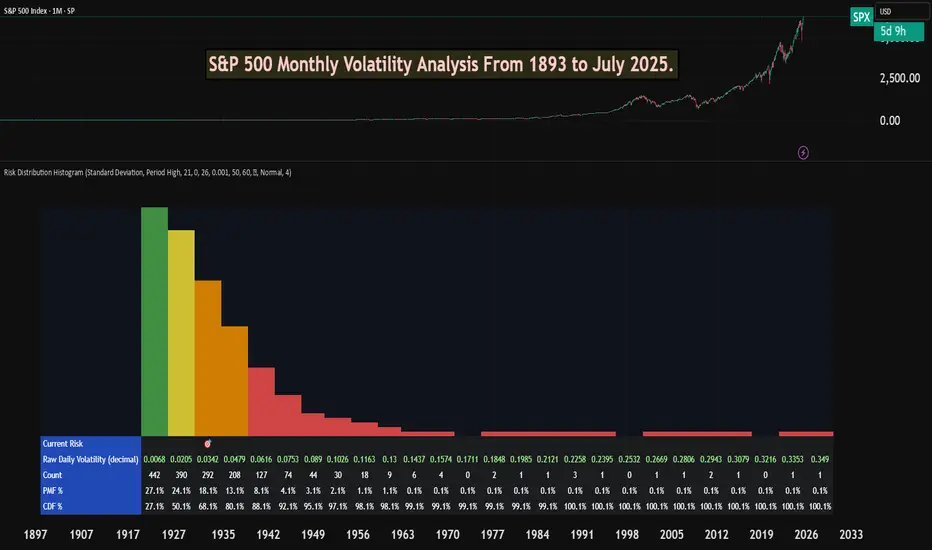
S&P 500 Monthly Volatility Analysis From 1893 to July 2025Most of the time, the S&P 500 is seen as a low-volatility index when compared to most individual stocks, small-cap indexes, or indexes from other countries.
However, most investors don't know exactly what volatility to expect from a statistical perspective.
The Risk Distribution Histogram allows us to understand exactly how risk is distributed.
S&P 500 Statistical Risk Distribution
Here are some highlights from what we get from the analysis. Some of this data might actually surprise investors. The data is monthly:
27% of all months have volatility under 0.68%
80% of all months' volatility was under 4.79%
5% of all months had a volatility of over 7%
If we can call a volatility over 25% a severe crash or "grey" swan, we had 7 of those events
3 months with extreme volatility over 30%
This allows us to understand tail risk and plan ahead. While most times the S&P 500 is in the low volatility zone, extreme events can happen.
What can we learn from this?
Prepare for rare but possible high-volatility events.
Understand the 80/20 rule. Most months are very low volatility, but 20% of them will have a volatility higher than 5% approximately.
Avoid overconfidence in stability
Plan for long-term horizons. High volatility tends to "dissipate" in the long term.
This is why it's important not to discard rare high-volatility events, especially when the investor is in need of liquidity.
This risk analysis can be done for any ticker.
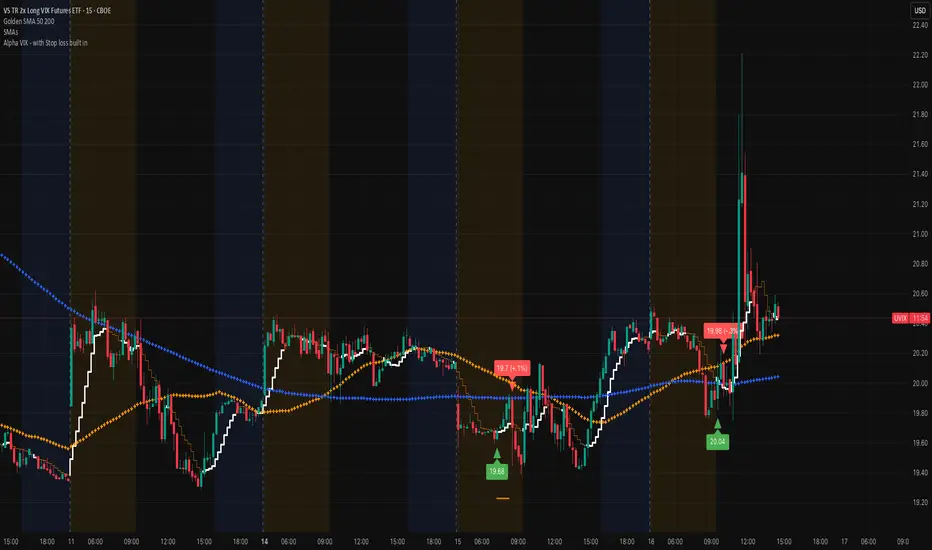
UVIX marching on (VIX proxy)Very nice spike this morning, that's typically a sign that there's more volatility in the works. Remember that we are at record lows on the VIX and that doesn't stay in this region for a long time. Add the Alpha VIX indicator to help you get an entry. The economy is brittle and staying focused on the VIX is a very nice play!
Best of luck and DM if you have any questions.....