Long Idea on Natural Gas (NG1!)Based on :
- Quantitative analysis
- Propietary temperature shock european model
- Vp and Avwap
Volumeanalysis

Approaching a Major Inflection Point After 2.5‑Year DowntrendNHC is shaping up for a meaningful breakout after a ~2.5‑year downtrend.
We’ve still got a few days left in the monthly candle, but a close above $4.71 would strengthen the probability of a sustained trend reversal.
Why the setup is interesting
- Price has reacted cleanly from a macro 50% retracement (ATL → ATH).
- It’s also sitting right on the major 50% level from the COVID low to ATH.
- Price is currently resting on the old ATH region, turning prior resistance into support.
- We’re seeing a potential first test and impulsive break of the yearly pivot (need to see spike of volume relative by end of month with larger candle spread)
- Volume has been declining for ~2 years, hinting at seller exhaustion rather than active distribution.
Where caution is still warranted
- The monthly candle hasn’t closed, and price is pressing into the yearly pivot for the first time.
- Coming in sideways increases the chance of a rejection wick before any true breakout.
- A sharp pullback into S1 wouldn’t be unusual, especially if the pivot acts as initial resistance before a stronger rally and eventual breakout attempt.
Overall, the structure is improving, the higher‑timeframe levels are doing their job, and the pivot interaction will likely dictate whether we break now or after a cleaner retest.

Short Idea on Crude Oil (CL1!)Based on :
- avwap and vp levels
- Bond yield spikes
- quantitative analysis
- 2 supply zones for potential entries

Silver Buy Direction Currently price move down side its come down at 87.75173 point , where have a FVG , Fixed volume Value low Level and also have a Fibonacci 77% Zone. here we need clear lower time clear conformation then we takes a Buy Entry.
DISCLAIMER
This is made for educational and informational purposes only.
It is not financial, investment, or trading advice.
Trading involves risk, and past performance doesn't guarantee future results.
Always do your own research or consult a licensed financial advisor
before making any trading or investment decisions.
The creator is not responsible for any profit or loss from your actions.
We don't offer paid signals or account management services.
Beware of scammers using our name - we are not connected to them.

Short Idea On US30 (Dow Jones)Based on :
-quantitative analysis
- vp and avwap levels
- correlations misprice model
- IV deviation bands models

$FIL / Filecoin FundamentalsThis is one of my favorite cryptos, Filecoin. I like it because of its practical use and utilization, as well as its tenure in the blockchain, over 5 years.
It has been hit the hardest as other coins have, but sometimes you have to remind yourself of the fundamentals.
I used Grok to quickly perform a fundamental analysis with metrics and visuals of Filecoin and found several items encouraging, like its increasing storage utilization rate and total committed storage capacity. Also, the development has not stopped.
With privacy & AI being in the spotlight, I feel as though it's just a matter of time for FIL.
Would I buy right now?
No, I wouldn't, not based on the technicals currently. Price has to successfully reclaim $1.50 weekly level and base before I have confidence in a potential reversal. But even though I wouldn't add it now, keep your eye out for one of the crypto OGs.

UROY | Nuclear Energy Sources Will Rise | LONGUranium Royalty Corp. operates as an exploration company, which engages in acquiring and assembling a portfolio of royalties, and investing in companies with exposure to uranium and physical uranium. The company was founded by Amir Adnani on April 21, 2017 and is headquartered in Vancouver, Canada.

CVX | Houston, We Have A Problem | LONGChevron Corp. engages in the provision of oil and gas energy solutions. It provides crude oil and natural gas, manufactures transportation fuels, lubricants, petrochemicals, and additives, and develops technologies that enhance business and the industry. It operates through the Upstream and Downstream segments. The Upstream segment consists of the exploration, development, and production of crude oil and natural gas, the liquefaction, transportation, and regasification associated with liquefied natural gas, the transporting of crude oil by major international oil export pipelines, the processing, transporting, storage, and marketing of natural gas, and a gas-to-liquids plant. The Downstream segment consists of the refining of crude oil into petroleum products, the marketing of crude oil and refined products, the transporting of crude oil and refined products by pipeline, marine vessel, motor equipment, and rail car, and the manufacturing and marketing of commodity petrochemicals and plastics for industrial uses and fuel & lubricant additives. The company was founded on September 10, 1879 and is headquartered in Houston, TX.

OVID Therapeutics (OVID) - Biotech with strong nervesOVID Therapeutics is a biotech company focused on developing treatments for rare neurological and genetic disorders.
On the monthly chart, OVID has broken above a long-term descending trendline and is currently retesting it from above. The key support zone sits at 1.45, while the latest close at 1.67 confirms structure preservation. Volume expanded on the breakout and faded during the pullback, indicating a healthy retest. Monthly MACD remains above zero and shows bullish divergence, while RSI holds above 50, confirming a shift in market phase. Volume profile suggests a potential magnet zone above current prices if support continues to hold.
Fundamentally, the company remains unprofitable, which is typical for a development-stage biotech. Q4 2025 EPS is expected at −0.11, revenues are minimal, but debt levels are manageable and cash reserves provide operational runway.
This is a higher-timeframe positioning idea, where the market begins to reassess the asset after a prolonged downtrend. Biotech is never comfortable, but this is how monthly reversals usually start.

Long Idea On Canola (RS1!)Based on :
- Cot commercial extremes
- Volume profile,avwap and 2 demand zones

Bearish Regime — Waiting for AVWAP Rally
Regime: Bearish
HTF Bias: Bearish
Position: Flat
STRUCTURE
Price below AVWAP. Rejected from 92.8k zone. Now chopping between AVWAP and POC.
Classic bearish behavior — rallies get sold.
KEY LEVELS
AVWAP → 92,834 (resistance, short zone)
Current → 89,797
POC → 87,616 (support)
-1σ → 85,724 (target if breakdown)
CVD READ
Trending higher. Buying pressure building but price not confirming.
Could be accumulation. Could be short covering. We wait for clarity.
SIGNAL
Last signal: 2. Low confluence.
Not enough for a new position. The edges pay, the middle chops.
THE PLAY
Waiting for rally to AVWAP (92.8k) for short entry. Or break below POC (87.6k) for continuation.
No trade at current levels. Patience is the position.
Daily analysis with all setups in bio.

XAUUSD M30 CHART ANALYSIS I 01/081. Price Structure and Technical Analysis
The chart shows that Gold is in a short-term corrective phase after hitting a strong resistance level:
Trend Overview: Following a sharp rally from below 4,350, gold prices peaked around 4,500 and have begun to consolidate or decrease slightly.
Trendlines: The price is trading near an ascending trendline starting from January 6. Currently, the price is moving sideways at the intersection of this ascending trendline and a short-term descending trendline from the 4,500 peak.
Volume Profile: The highest concentration of trading volume (POC) is located around 4,445 - 4,461. The current price (4,436) is sitting just below this zone, indicating that selling pressure has a slight edge in the short term.
2. Key Levels to Watch
Resistance Zones:
4,445 - 4,460: This is the POC area and the immediate barrier the price must overcome to regain bullish momentum.
4,500: A critical psychological level. Failing to break this level in previous sessions has led to profit-taking.
Support Zones:
4,427 - 4,434: The nearest support zone (the light blue demand zone on your chart). If this level breaks, the price could drop further.
4,370 - 4,380: A stronger support zone below if a deeper correction occurs.
3. Market Update for January 8, 2026
According to updated data, global gold prices have trended slightly lower today:
The price is trading around 4,442 - 4,446 USD/ounce, down approximately 0.48% to 0.87% compared to the previous session.
Drivers: Investors are taking profits after the extended rally, and the USD is showing signs of slight strengthening. The market is also cautious ahead of Friday's US Non-Farm Payrolls (NFP) data for further clues on monetary policy.
4. Forecast Scenarios
Scenario 1 (Bullish Accumulation): If the price stays firm above the 4,427 support and moves above 4,460, gold could return to challenge the 4,500 mark again.
Scenario 2 (Deeper Correction): If the 30m candle closes below 4,420, a short-term downtrend will be confirmed, with the next target likely being the 4,370 area.
Observation: In the short term, prioritize watching the price reaction at the current support zone (4,430 - 4,436). Avoid chasing "Buy" orders until the price clearly breaks above the 4,460 resistance with high volume.

BTC/USD CHART ANALYSIS M30 I 01/071. Price Pattern: Symmetrical Triangle
The price is currently consolidating within two converging trendlines:
Upper Bound (Resistance): Connecting lower highs, indicating downward selling pressure.
Lower Bound (Support): Connecting higher lows, showing buying interest stepping in at higher levels.
Observation: The price is approaching the "apex" (tip) of the triangle. This usually signals a period of accumulation that precedes a major breakout.
2. Volume Profile Analysis (Key Levels)
The highlighted blue zones represent the "Value Area," where most trading activity has occurred:
VAH Zone (Value Area High - ~$94,000): This acts as the overhead resistance. A breakout above this level suggests the market is ready to find new highs.
POC Zone (Point of Control - ~$92,500): Marked by the red dashed line. This is the price level with the highest traded volume. Currently, BTC is hovering right around this area ($92,767), showing a temporary state of equilibrium (sideways movement).
VAL Zone (Value Area Low - ~$92,250): This is the immediate support. If the price drops below this, it could trigger a faster decline as it exits the high-volume cluster.
3. Potential Scenarios
Bullish Scenario: If price breaks above the triangle's resistance and closes above $94,000 (VAH), the next targets would likely be $95,500 – $96,000.
Bearish Scenario: If price breaks the lower support of the triangle and loses the $92,250 (VAL) level, it will likely drop quickly toward the previous support at $91,500 or even $90,500 (where the lower pink volume bars are located).
Summary & Strategy
Current State: Market is moving sideways within the triangle. Entering a large position at the POC is risky because of potential "whipsaws" (fakeouts).
Action Plan: Wait for a decisive breakout with high volume outside of the triangle boundaries to confirm the next direction.

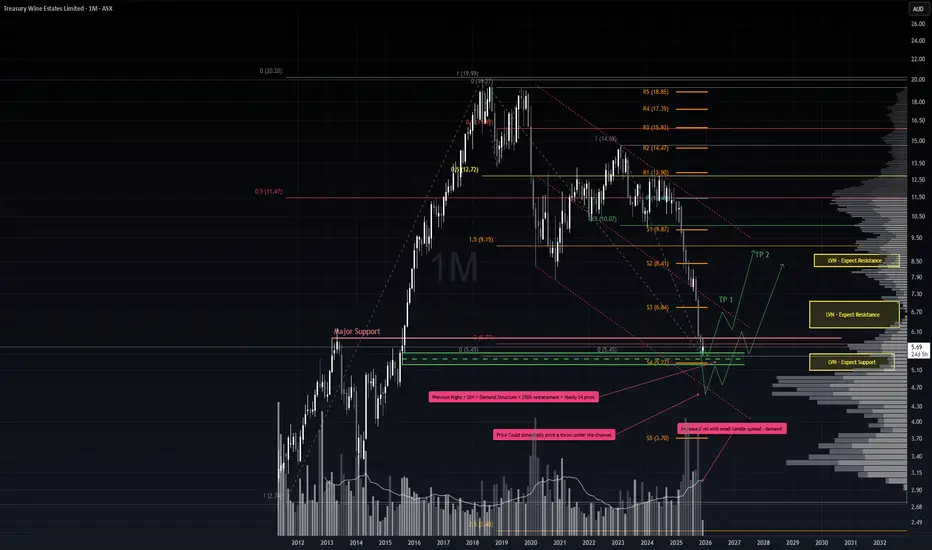
Relief Rally Incoming?It’s been a punishing stretch for TWE holders, but price action has now pulled back into a critical zone where a relief rally could emerge. The broader trend remains bearish, so any positioning here must respect that context.
Key Support Factors
1. 200% retracement from the 2018 double top.
2. Low Volume Node (LVN) zone, indicating limited price acceptance and potential for sharp moves.
3. Demand structure anchored by the August 2015 candle.
4. Historical tops acting as structural support.
5. November monthly candle showed notable demand — high volume on a narrow spread.
6. 11 consecutive weeks down in a single swing, aligning with Gann’s 7–10 bar exhaustion principle.
7. Proximity to the yearly S4 pivot, reinforcing the demand zone.
Trade Scenario 1 – Aggressive Entry
Setup: Despite no confirmed trend reversal, risk-tolerant traders could begin scaling in here, supported by the confluence of demand factors.
Stop Loss: 5.22 — just beneath the demand structure and S4 pivot.
Take Profit: Initial target at the midline (EQ) of the downward channel. If price breaks cleanly above, extend targets toward the upper bounds of the channel.
Trade Scenario 2 – Throw-Under Reversal
Setup: If the S4 pivot and demand structure fail, watch for a throw-under pattern whereby price dips below support but quickly reclaims the range.
Confirmation: A bullish hammer or doji on surging volume, ideally accompanied by negative sentiment, would strengthen the reversal case.
Take Profit: Similar roadmap to Scenario 1 — first target at the channel EQ, then potentially the upper boundary if momentum builds.
Summary
This is a high-risk, counter-trend play. The confluence of structural supports, exhaustion signals, and pivot proximity offers a tactical window for relief. However, discipline around stops and scaling is essential, as the long-term bear market backdrop remains intact.
* Note, price pathing is not time based, just the overall price movement
SEAMEC LTD - Weekly Falling Trendline Breakout📊 SEAMEC LTD – Weekly Falling Trendline Breakout Attempt 🚀
📅 Updated: Dec 03, 2025 | ⏱️ Timeframe: 1W
CMP: ₹987.85 (+2.81%)
Ticker: NSE:SEAMECLTD
🔍 Technical Overview
SEAMEC is showing strong bullish momentum on the weekly timeframe, attempting a breakout above a 1.5-year falling trendline drawn from 2024 highs.
A strong base formation is also visible:
🟦 Demand Zone (Support Block): ₹830–₹870
Price has respected this demand zone multiple times, creating a rounded accumulation base.
📈 Current Move:
Breakout candle touching the trendline
Higher lows forming since August 2025
Volume expansion on recent bullish candles indicating accumulation
A confirmed breakout above the falling trendline could mark the beginning of a fresh medium-term uptrend.
🎯 Chart Summary
SEAMEC is showing signs of reversing its prolonged downtrend.
Breakout confirmation above ₹1,030 may open the path toward:
🎯 Targets:
₹1,120 (supply zone)
₹1,210 (swing high)
A close above the trendline with volume would validate the reversal.
⚠️ Disclaimer
This analysis is for educational and chart-study purposes only. Not financial advice. Always do your own research before trading.

BTC Take OFF for a BUYNow at this time we are little late to take buy entry but we have still opperunity for BUY . Price Down at 93518.15 and we find a buy conformation in any 5,3 and 1M time ,other details I share in chart where price gone

RTY: Small Caps Stuck Between Growth Optimism & Macro OutlookRTY Overview and Recent Macro Backdrop
RTY, or Russell 2000 futures, track the performance of the Russell 2000 Index, which represents approximately two thousand U.S. small cap companies. These constituents are drawn from the lower end of the Russell 3000 Index and typically reflect firms with smaller market capitalizations, greater domestic revenue exposure, and higher sensitivity to economic conditions than their large cap peers. The primary deciding factor for inclusion in RTY versus the S&P 500 is market capitalization. The Russell 2000 consists of the smallest two thousand companies within the Russell 3000, while the S&P 500 is a committee selected index composed of roughly five hundred large cap companies that must meet additional criteria such as profitability, liquidity, sector balance, and sustained earnings. Although market cap thresholds shift annually, Russell 2000 constituents generally fall well below the market cap range of S&P 500 companies and are reconstituted mechanically each year based on size rankings.
As the market settles into the new year, RTY has been trading within a more nuanced macro environment shaped by early year repositioning and reassessment of economic expectations. Price action over the past month has been increasingly influenced by evolving views on monetary policy, credit conditions, and the durability of U.S. growth. While recent inflation data has shown signs of moderation, it has remained uneven, keeping rate cut expectations fluid rather than fully priced in. This has limited sustained directional momentum in small caps, as higher borrowing costs continue to pressure balance sheets and earnings visibility. At the same time, resilient employment data and stable consumer demand have helped contain downside risk, allowing buyers to engage at value rather than chase extension. The result has been a rotational and range bound market structure, reflecting cautious positioning and a wait and see approach, with RTY acting as a battleground between early year growth optimism and ongoing policy and financing constraints.
What the Market has done
• Market reversed higher and entered an uptrend after concerns surrounding Trump’s liberation day tariffs eased in April 2025.
• In July 2025, the market consolidated and formed bid block 1, which buyers used as a base to drive price higher toward the 2585 area, a key daily resistance established in 2021 and the 2024 yearly high.
• Sellers responded at the 2585 area and offered prices back down toward the 2440 area, aligning with daily support and the 24 Nov weekly HVN.
• Buyers attempted to defend the 2440 area but failed, resulting in a downside auction to the 2320 area, corresponding to the bid block 1 high.
• Buyers defended and initiated at the 2320 area, bidding prices back up to the 2585 area, where sellers remained active.
• Markets have since rotated between the 2585 and 2490 areas.
What to expect in the coming week
The key level to monitor is the 48650 area, which aligns with the previous week’s VPOC and the 15 December weekly Value Area High
Bullish scenario
• If the market is able to hold above the previous week’s settlement, an initial move toward the 2555 area is expected, which aligns with the 22 Dec weekly VAL, the 3 Dec weekly VAH, and the 0.5 weekly SD high.
• If price is able to accept above the 2555 area, continuation toward the 2585 area becomes likely.
• Sellers are expected to respond around the 2585 area based on prior failed auctions and higher timeframe resistance.
• If sellers fail to gain control, the market could extend higher toward the 2620 area, which marks the 8 Dec weekly high.
Neutral scenario
• In the absence of a major news or data catalyst, the market may continue to auction two ways
• A rotational consolidation between the 2490 and 2555 areas would signal continued balance and acceptance of value within this range.
Bearish scenario
• If buyers are unable to defend and hold the 2490 area, expect a move down toward the 2460 area, which aligns with the 1 weekly SD high.
• Continued selling pressure could cause markets to auction prices further down to the 2440 area, which remains a key daily support and the 24 Nov weekly HVN.
Conclusion
In conclusion, RTY remains in a balanced yet highly responsive state, with higher timeframe reference levels clearly defended and defended by both buyers and sellers. The 2490 area is the line in the sand for the coming week, and traders should remain flexible and responsive to acceptance or rejection around this zone. As always, patience and execution around key levels will matter more than prediction.
If you found this breakdown useful, feel free to give a boost, comment, or share your own levels and scenarios below.
Disclaimer: This is not financial advice. Analysis is for educational purposes only; trade your own plan and manage risk.

ORIENT CERATECH LTD - WEEKLY TRENDLINE BREAKOUT📊 ORIENT CERATECH LTD – Weekly Trendline Breakout Attempt 🔥
📅 Date: Jan 01, 2026
⏱️ Timeframe: 1W
💰 CMP: ₹52.51 (+21.64%)
📌 Exchange: NSE
🔍 Technical Structure Overview
Orient Ceratech has been trading under a long-term descending trendline, forming a broad consolidation / corrective phase after its previous rally.
Recent price action shows strong bullish momentum, with a high-volume bullish candle attempting to break above the falling trendline — a classic early sign of trend reversal.
This move becomes technically significant as it occurs after:
Higher lows formation
Demand stepping in near ₹32–35 zone
Strong weekly close near highs
🎯 Possible Scenarios
✅ Bullish Case:
Weekly close above ₹56
Retest and hold of breakout level
Targets: ₹65 → ₹72 → ₹80
⚠️ Caution Case:
Rejection near trendline
Sideways consolidation between ₹46–56
📌 Chart Summary
Orient Ceratech is at a critical inflection point on the weekly timeframe.
The stock is showing early trend reversal signals, supported by strong volume and price expansion. A confirmed breakout could open doors for a fresh medium-term uptrend.
⚠️ Disclaimer
This analysis is for educational purposes only. Not financial advice.

ICICIPRULI–Short-Term Breakout.Mid & Long-Term Technical OutlookICICIPRULI – Multi-Timeframe Technical View
Daily Timeframe | Long-Term Perspective
ICICIPRULI is trading within a well-defined structure and continues to move inside a clear parallel channel, reflecting a healthy long-term trend.
The stock has a strong long-term support zone near 590–610, where:
Volume expanded significantly
Price showed a clear reversal from support
Historically, the stock has delivered returns of ~60% and ~34% from similar structures.
If price action repeats this nature, a long-term upside toward 780 and 940 remains a strong possibility.
Mid-Term View | Structure & Pattern
On the mid-term timeframe, the stock previously formed a falling wedge near the support zone, indicating accumulation.
Post that, ICICIPRULI appears to be developing an ascending broadening formation, suggesting expanding momentum.
Key Levels:
Support: 620–630
Short- to Mid-term Resistance / Target: 680–700

BTC/USD CHART ANALYSIS I 12/311. Price Structure & Trend
Symmetrical Triangle Pattern: The price is currently compressing tightly within a triangle formed by a descending trendline from above and an ascending trendline from below.
Current State: Trading at 88,428, the price is sitting right at the upper boundary of the triangle and the VAH resistance. This is a high-tension zone, signaling an imminent breakout.
2. Volume Profile Analysis
Liquidity zones are clearly defined on the chart:
VAH Zone (88,506): This is the "Value Area High." The price is currently reacting here. A decisive break above this level would mean BTC has exited its accumulation phase, likely heading toward 90,000+.
POC Zone (87,314): The "Point of Control" (highest volume) sits below current prices. This acts as a primary magnet and support floor; if a correction occurs, buyers are expected to step in here.
VAL Zone (86,933): The "Value Area Low" serves as the final line of defense for the current bullish structure.
3. Potential Scenarios
Bullish Breakout: If an hourly candle closes firmly above 88,500 and the descending trendline, the uptrend is confirmed. Short-term targets would be the previous highs around 90,000 - 90,400.
Rejection/Correction: If the price fails to break the VAH and drops below the ascending trendline, it will likely seek liquidity at the POC (87,314) before making its next move.
💡 Tactical Summary:
The market is in a "Wait for Confirmation" state.
Bulls: Have a slight edge as they continue to maintain higher lows (the rising trendline).
Bears: Are putting up a strong fight to defend the 88,500 psychological level.
Strategy: It is best to wait for a clear candle close outside of the triangle. Entering exactly at the "apex" (the tip) of the triangle carries a high risk of being caught in a "fakeout" or stop-loss hunt.

CLBT | This Software Tech Stock Will Rise | LONGCellebrite DI Ltd. engages in the provision of digital investigative solutions for the public and private sectors, empowering organizations in mastering the complexities of legally sanctioned digital investigations by streamlining intelligence processes. Its services include training and advisory, value realization, advanced services, and technical customer support. The firm also offers software solutions and analytic tools designed to accelerate digital investigations and address the growing complexity of handling crime and security challenges in the digital era. The company was founded on April 13, 1999 and is headquartered in Petach Tikva, Israel.

SLV | Next Leg Higher Is Here | LONGiShares Silver Trust seeks to reflect generally the performance of the price of silver. The Trust seeks to reflect such performance before payment of the Trust's expenses and liabilities. It is not actively managed. The Trust does not engage in any activities designed to obtain a profit from, or to ameliorate losses caused by, changes in the price of silver.

IE | Copper Companies Are Going Parabolic Soon | LONGIvanhoe Electric, Inc. is a minerals exploration and development company which focuses on developing mines from mineral deposits. Its projects include Santa Cruz Copper and Tintic Copper-Gold Projects. It operates through the following segments: Santa Cruz Project, Critical Metals, Data Processing, and Energy Storage. The Santa Cruz Project and Critical Metals segment handles mineral project exploration and development with a focus on identifying and developing mineral projects, and ultimately mines, associated with the metals necessary for electrification. The Data Processing segment provides data analytics, geophysical modeling, and artificial intelligence services for mineral, oil and gas, and water exploration industries. The Energy Storage segment develops, manufactures, and installs vanadium flow batteries for grid-scale energy storage. The company was founded on July 14, 2020 and is headquartered in Tempe, AZ.
