Bitcoin falling trendline soon will break and Bulls will lead Bitcoin is currently trading within an ascending channel, encountering resistance near both the channel's upper boundary and a significant historical descending trendline. While this confluence of resistance has prompted a short-term pullback, the overall structure suggests a potential breakout attempt in the near term.
A decisive move above the falling trendline would signal a shift in market structure, likely invalidating the bearish momentum and transitioning the market into either a consolidation range or a renewed bullish phase .
Following a confirmed breakout, the technical setup would support the potential for further upward movement, with progress expected to become more sustained once this key resistance zone is cleared.
So get Ready also other paths mentioned on the chart too what may happen in your view comment below !!
DISCLAIMER: ((trade based on your own decision))
<<press like👍 if you enjoy💚
VOLUMEBREAKOUT

Volume EPO – One bar, seven volume stories Volume EPO – One bar, seven volume stories (VAKFN, Borsa Istanbul)
This idea illustrates how different volume-classification methods can produce very different interpretations of the same bar. The Volume EPO overlay is used as a research tool to display seven methods side by side in a compact HUD.
The example is taken from VAKFN on Borsa Istanbul. On this market, TradingView provides extended intrabar volume data (BIST volume data plan), which allows the Intrabar row of the table to be built from lower-timeframe up/down volume and used as a high-precision benchmark.
Price is shown on the daily chart inside an ascending channel. The last daily bar in that structure is analyzed with the Volume EPO table on the right. Total volume on that bar is the same for every row (66.49M), but each method splits it into buy / sell / delta differently:
- Intrabar (Ref) – lower-timeframe up/down volume
≈ 36.66M buy vs 29.83M sell → delta +6.83M (moderate net buying; benchmark “truth layer”).
- BVC (Smart) – probabilistic split via normal CDF on normalized price change
Delta ≈ +7.61M, very close to Intrabar (Diff ≈ 1.1%), confirming a mild buy imbalance.
- Tick Rule – classic uptick/downtick classifier
Because the close is above the previous close, the whole 66.49M is classified as buy volume
→ delta +66.49M (Diff ≈ 90%), an extremely bullish reading.
- Lee-Ready Style – delayed midpoint quote test with Tick fallback
On this bar the close falls on the sell side of the delayed midpoint, so the entire volume is classified as selling
→ delta −66.49M (Diff ≈ 110%), the exact opposite of Tick Rule.
- Wick Imbalance – geometric supply/demand from upper vs lower wicks
A strong upper wick and weak close again lead to a full sell reading
→ delta −66.49M (Diff ≈ 110%).
- ML-Logit – logistic model of normalized return and volume deviation
Shows only a small negative imbalance
→ delta ≈ −1.38M (Diff ≈ 12.1%), close to neutral flow.
- Geometry – legacy CLV-style candle approximation
With the close near the low of the range, more volume is assigned to sellers
→ delta ≈ −33.25M (Diff ≈ 60.1%), strong selling.
On this single daily bar of VAKFN, the conclusions range from “mild net buying” (Intrabar, BVC) to “massive buying” (Tick Rule), “massive selling” (Lee-Ready Style, Wick Imbalance), “almost neutral” (ML-Logit), and “strong selling” (Geometry).
Only the Intrabar row uses actual lower-timeframe up/down volume from TradingView; all other rows are models built on top of OHLCV. Access to deeper intrabar history on small timeframes (such as 1s/5s, depending on data plan and subscription level for BIST) strengthens this benchmark layer and makes it easier to see which methods stay close to the underlying flow and which ones drift away.
This idea is presented as a research and educational example on VAKFN, not as a trade signal or financial advice.

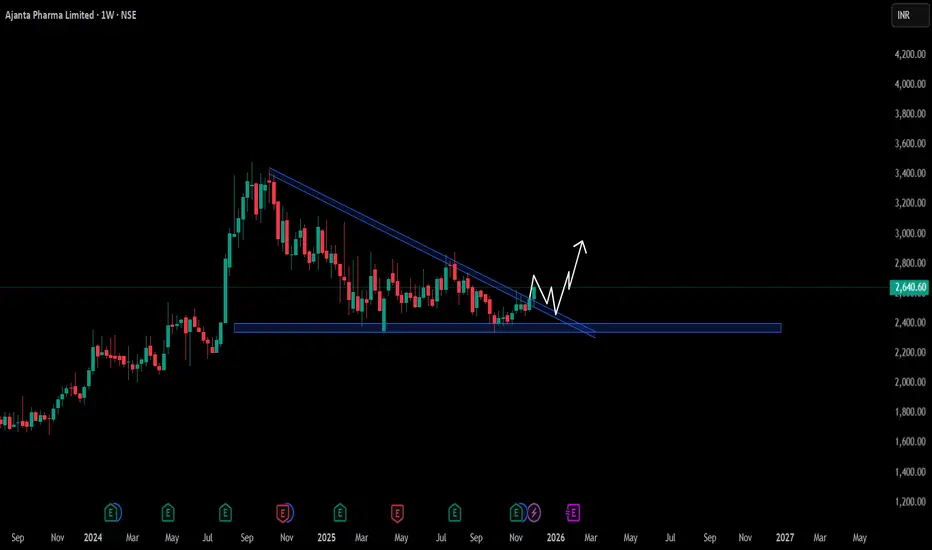
Ajanta Pharma – Breakout Confirmation Zone AheadPrice has broken above the descending trendline after a long consolidation phase.
Structure shows higher lows forming near support, indicating buyers stepping in.
A small retest of the trendline or support zone (₹2,400–₹2,480) is possible before continuation.
If the retest holds, price can resume upward momentum toward higher resistance levels.
Overall: Setup is bullish as long as price stays above the breakout zone.
⚠️ Disclaimer
This is purely educational technical analysis, not financial advice. Always manage your own risk before taking any trade.
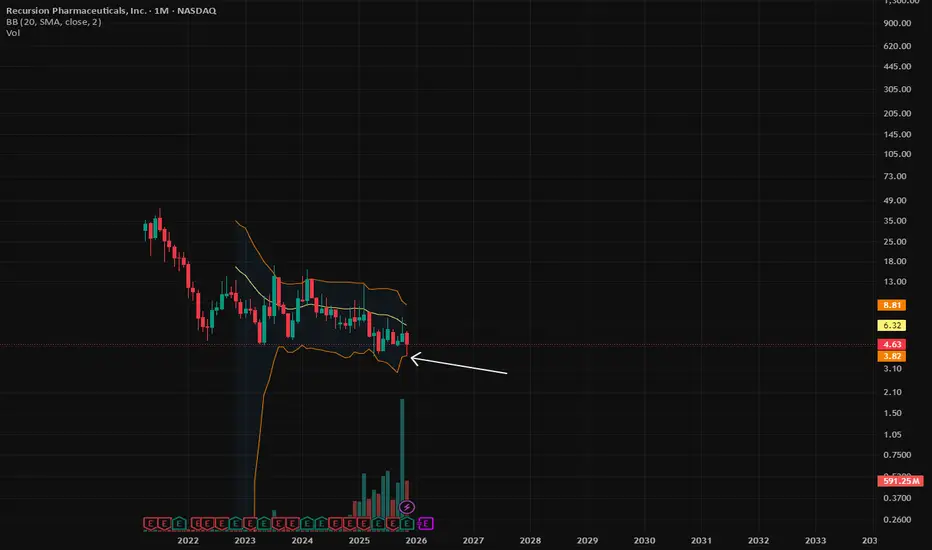
RXRX monthly close.www.tradingview.com
RXRX MC. Touched the lower BB, but got bought heavily. IMHO price is going to reclaim the 20ma MA in the upcoming month(s). Sell volume is dropping while buy volume is increasing. Institutions keep on buying as well. Shake out before breakout!
XAUUSD WXAUUSD is in an uptrend and may retest the marked area. After that, the trend is likely to continue. Key levels are important to monitor to see how the market reacts from this point.

SBI Life Insurance: Breaking 420-Day Consolidation BUY Setup 🛡️
Entry: ₹1,936-1,945 (Current Level)
Target 1: ₹1,984-1,990
Target 2: ₹2,019-2,030
Target 3: ₹2,056-2,075 (Extended)
Stop Loss: ₹1,910
Technical Rationale:
MAJOR BREAKOUT after 420 days of consolidation (highlighted in cyan)
Breaking above long-term resistance at 1,930 level with strong momentum
Weekly chart showing powerful +5.27% surge
Volume buildup visible (highlighted) - institutional accumulation
Price breaking above descending trendline from 2024 highs
Trading above both EMAs indicating strong bullish trend
Rounding bottom formation on weekly - classic bullish reversal
High volume (5.03M) confirming breakout authenticity
RSI trending upward with room for further upside
Insurance sector showing relative strength
Clear support base at 1,876-1,910 zone
Risk-Reward: Excellent 1:4+ ratio
Pattern: Multi-month base breakout + Rounding bottom - extremely reliable bullish setup on weekly timeframe
Strategy: Positional/long-term - Book 25% at T1 (1,990), 25% at T2 (2,025), trail remaining 50% with SL at 1,950 after T1 achieved
Key Levels:
Breakout Zone: 1,930-1,945 (critical resistance broken)
Strong Resistance: 1,984, 2,019, 2,056
Major Support: 1,910, 1,876
Major Catalyst:
420-day consolidation breakout = huge pent-up energy
Volume accumulation phase complete
Financial sector strength
Disclaimer: For educational purposes only. Not SEBI registered. 420-day base breakout is significant - these typically lead to sustained moves. Weekly chart for medium to long-term position. Manage risk appropriately and conduct thorough research before investing.

$BTC BOTTOM IN - Dragonfly Doji Reversal CandleBOTTOM IS IN
⚠️ Need to reclaim ~$95k within the next couple days to confirm, but I’m confident.
🐉 Printed a Dragonfly Doji Reversal candlestick with a Volume breakout to accompany.
🐉 RSI also sitting at lowest since Liberation Day.
🐉 Death Cross historically marks bottoms.
🐉 This 29% correction lines up perfectly with prior ones before next impulsive move up.

BSE Ltd: Breaking 6-Month Downtrend | Major Reversal SetupSTRONG BUY Setup 📈
Entry: ₹2,678-2,690 (Current Level)
Target 1: ₹2,720-2,740
Target 2: ₹2,777-2,800
Target 3: ₹2,826-2,850
Target 4: ₹2,875-2,900+ (Extended)
Stop Loss: ₹2,636
Technical Rationale:
MASSIVE BREAKOUT from 6-month falling wedge/channel (blue shaded area)
Explosive +9.07% surge with exceptional volume spike (20.3M - highlighted in cyan)
Breaking above descending trendline resistance decisively
Breaking out of "Breakout Zone" (2,500-2,636) marked on chart
Trading well above EMA (2,452.55) - strong bullish reversal
RSI at 69.05 - strong momentum with room before overbought
Price reclaiming all key moving averages
Financial services stock benefiting from market rallies
Volume is highest in months - institutional accumulation
Multiple resistance levels mapped: 2,720, 2,777, 2,826, 2,875
Clear support at breakout zone 2,636-2,650
Classic falling wedge breakout - one of most reliable bullish patterns
Risk-Reward: Excellent 1:5+ ratio for extended targets
Pattern: Falling Wedge Breakout on Daily Chart - extremely bullish reversal pattern after months of consolidation
Strategy: Medium-term swing to positional (weeks)
Book 20% at T1 (2,730), 20% at T2 (2,790), 20% at T3 (2,840), trail remaining 40% with SL at 2,700 after T1
This could be start of major uptrend
Key Levels:
Breakout Zone: 2,636-2,650 (critical support now)
Strong Resistance: 2,720, 2,777, 2,826, 2,875
Major Support: 2,636, 2,600
Timeframe: Daily chart - suitable for swing/positional traders
Volume Analysis: Exceptional volume spike (20.3M) - highest since May/June - confirms breakout authenticity and institutional buying
Sector: Financial Services/Exchange - benefits from market activity and volumes
Historical Pattern: Orange circles show previous resistance zones that were tested - now breaking out decisively
Measured Move: From wedge height, target extends to 2,900-3,000 zone
Disclaimer: For educational purposes only. Not SEBI registered.

Cello World Ltd – Weekly Inverted Head & Shoulders Breakout📊 Cello World Ltd – Weekly Inverted Head & Shoulders Breakout 🧩
📅 Chart Date: October 29, 2025 | Timeframe: Weekly
📈 CMP: ₹660.60 (+4.74%)
📍 Symbol: NSE:CELLO
🔍 Technical Overview
📉 Pattern: Inverted Head & Shoulders (Reversal Pattern)
The stock formed a clear inverted H&S structure after a long downtrend, signalling potential trend reversal.
Neckline breakout seen near ₹645, accompanied by rising volume momentum — suggesting buyer dominance.
💥 Volume Confirmation (🔊)
Weekly volume surged to 3.2M, up significantly from the average of 1.02M, validating the breakout.
📈 Next Resistance Zone: ₹745–₹780
📉 Immediate Support: ₹640 (neckline zone)
⚠️ Disclaimer
This analysis is for educational and charting purposes only. Not a buy/sell recommendation. Always do your own research before trading or investing

#BHARATFORG - VCP BO in DTFScript: BHARATFORG
Key highlights: 💡⚡
📈 W Bottom Patter in the WTF
📈 VCP BO in DTF
📈 Volume spike seen during Breakout
📈 MACD Bounce
⚠️ Important: Always Exit the trade before any Event.
⚠️ Important: Always maintain your Risk:Reward Ratio as 1:2, with this RR, you only need a 33% win rate to Breakeven.
✅Boost and follow to never miss a new idea! ✅
Disclaimer: I am not SEBI Registered Advisor. My posts are purely for training and educational purposes.
Eat🍜 Sleep😴 TradingView📈 Repeat 🔁

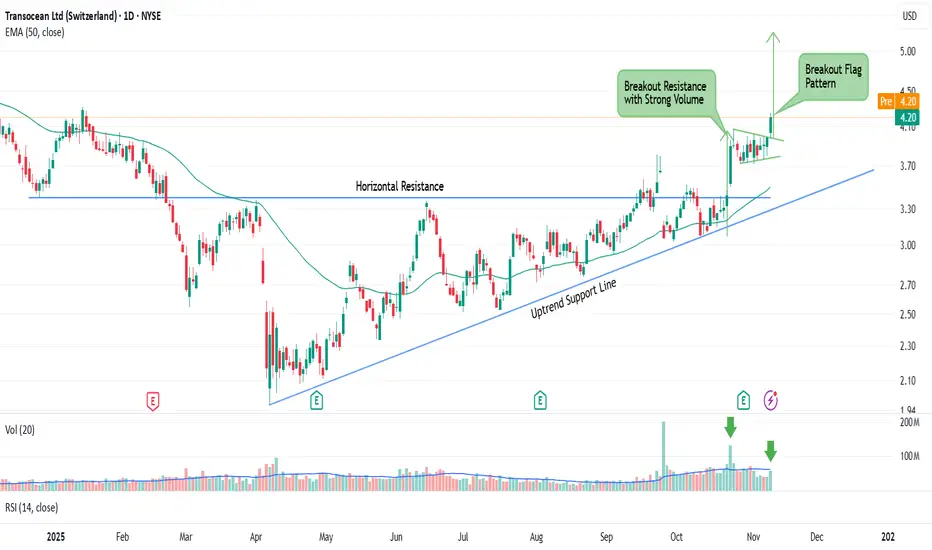
Transocean Ltd (RIG) – Bullish BreakoutSummary:
RIG has broken out of long consolidation and strong resistance at 3.40 with high volume , showing strong buyer interest.
After the breakout, price pulled back and formed a flag pattern , then broke out again yesterday , confirming bullish continuation .
Trading Plan:
Entry: 4.20
Support: 3.72
Target: 5.20
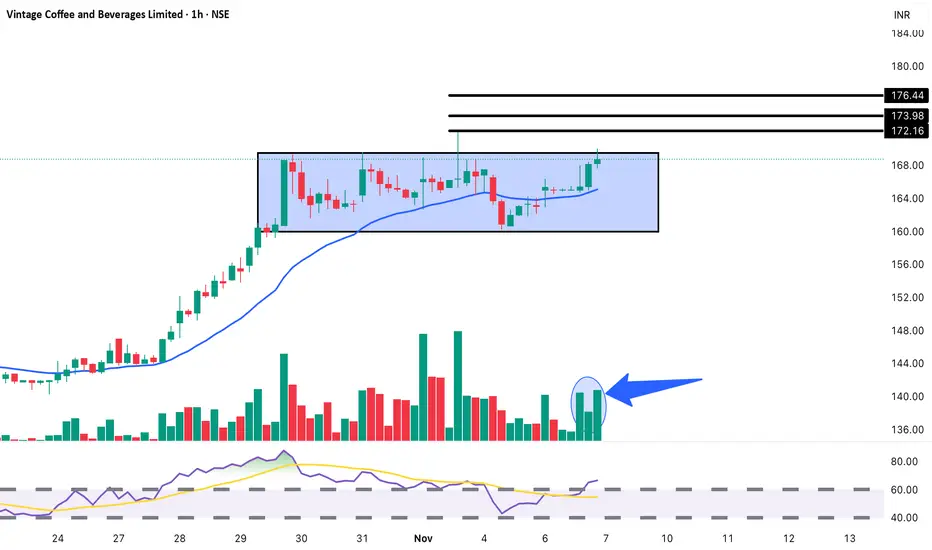
Vintage Coffee & Beverages: Rectangle Pattern Swing Trade SetupBUY Setup ☕
Entry: ₹168-169 (Current Level)
Target 1: ₹172-173
Target 2: ₹174-176
Target 3: ₹180+ (Breakout Extension)
Stop Loss: ₹164
Technical Rationale:
Rectangle consolidation pattern (160-169) visible on 1-hour chart (blue shaded zone)
Holding strong at upper range of consolidation
Volume spike highlighted (blue arrow) - showing buying interest
Strong uptrend from 144 to current levels
Trading above rising EMA - bullish trend intact
RSI trending upward around 70 - strong momentum
Small-cap F&B stock showing resilience
Volume at 1.31M - decent for 1H timeframe
Multiple resistance levels clearly marked: 172, 174, 176
Support well-established at 164-165 zone
Coiling pattern - compression before expansion
Risk-Reward: Good 1:3+ ratio
Pattern: Rectangle consolidation on 1H chart - typically a continuation pattern after strong uptrend
Strategy: Intraday to short-term swing (1-3 days)
Book 40% at T1 (172.50), 30% at T2 (175), trail remaining with SL at 169 after T1
Aggressive traders can add on break above 169.50 with volume
Key Levels:
Breakout Zone: 169-170 (upper rectangle boundary)
Strong Resistance: 172, 174, 176
Critical Support: 164, 162, 160 (rectangle base)
Timeframe: 1-hour chart - suitable for intraday/swing traders
Volume Analysis: Recent volume spike (highlighted) suggests accumulation at upper range - bullish sign
Sector: F&B/FMCG - relatively defensive sector
Note: Currently showing strength with +0.36% gain. Watch for breakout above 169.50 with volume for confirmation.
Disclaimer: For educational purposes only. Not SEBI registered.
Gap-Up Alert: Hind Rectifiers | Rectangle Breakout ConfirmedBUY Setup ⚡
Entry: ₹1,803-1,810 (Current Level)
Target 1: ₹1,832-1,840
Target 2: ₹1,851-1,860
Target 3: ₹1,875-1,890 (Extended)
Stop Loss: ₹1,775
Technical Rationale:
Massive breakout from rectangle consolidation (1,600-1,800 range)
Explosive +5.00% surge with exceptional volume (84.66K)
Breaking above long-term resistance at 1,800 with strong conviction
RSI spiking to 69.43 - strong bullish momentum
Gap-up opening showing institutional buying interest
Trading well above EMA (1,663.41) confirming uptrend
V-shaped recovery from October lows
Power electronics/rectifier sector gaining traction
Multiple resistance levels mapped: 1,832, 1,851, 1,875
Clear support established at 1,747-1,775 zone
Volume significantly above average confirming breakout
Risk-Reward: Good 1:2.5+ ratio
Pattern: Rectangle breakout + Gap-up - powerful combination for continuation
Strategy: Short to medium-term swing - Book 35% at T1 (1,835), 35% at T2 (1,855), trail remaining with SL at 1,810 after T1
Key Levels:
Breakout Zone: 1,800 (critical level crossed)
Strong Resistance: 1,832, 1,851, 1,875
Major Support: 1,775, 1,747, 1,720
Sector Catalyst:
Power sector demand increasing
Electronics manufacturing push
Infrastructure spending
Caution: Already up 5% today - consider waiting for minor pullback to 1,790-1,795 for better entry, or enter in tranches
Disclaimer: For educational purposes only. Not SEBI registered.

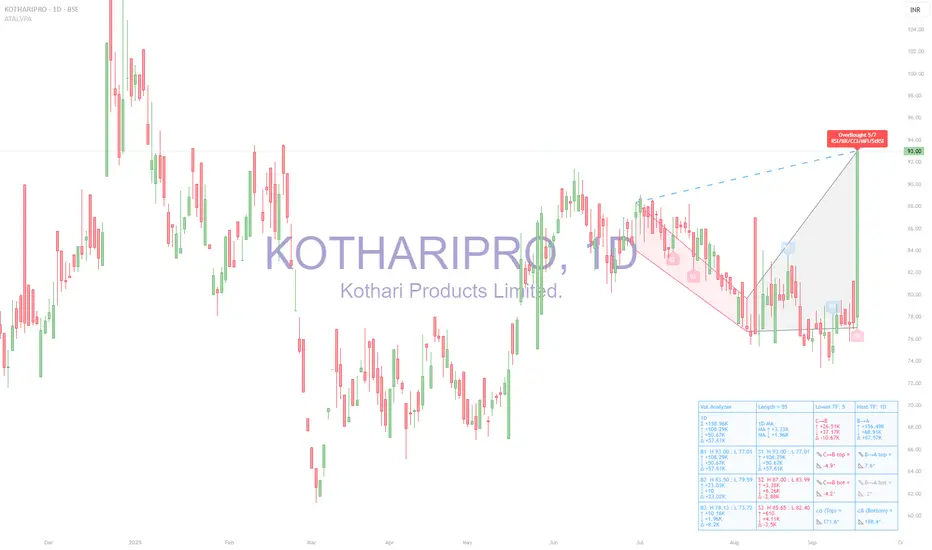
KOTHARIPRO (BSE: 1D) — Volume Pressure Analyzer | OB 5/7 Tool used
Analysis made with ATAI Volume Pressure Analyzer (VPA), which decomposes daily flows into buy/sell volume, prints half-window deltas (C→B vs B→A), ATR-normalized wing slopes, α/β geometry at vertex B, and OverBought/OverSold spike labels confirmed by a 7-oscillator vote
1) Snapshot from HUD
◉ OB 5/7 fired on today’s +20% candle (RSI/Stoch/CCI/MFI/StRSI cluster).
◉ C→B (earlier half): Δ −14.21 → seller-tilted.
◉ B→A (recent half): Δ +72.25K → buyers in control.
◉ Angles: C→B wing both <0° (down), B→A wing both >0° (up).
◉ α=171.6°, β=188.4° → no red flags (thresholds are α>180 or β<180).
◉ Ranked zones:
- B1 High 93.0 / Low 77.0 (resistance)
- S1 Low 83.9 (support)
2) Interpretation
◉ The OB 5/7 tag warns of short-term exhaustion after an impulsive surge.
◉ Yet the right wing (B→A) shows positive deltas and slopes, meaning structure still favors buyers.
◉ No α/β stress flags, so the geometry is not “over-stretched.”
◉ The zone map is clean: B1 = resistance (93.0) and S1 = first support (83.9).
3) Scenarios
A) Base case — Pullback / Digestion
◉ Likely reaction into the S1 zone (≈84–87) after OB tag.
◉ Watch Δ(B→A): if it fades to ≤0 and wings flatten, pullback deepens.
B) Bullish continuation
◉ Requires daily acceptance above 93 with a buy-spike (TF_buy / SMA ≥1.6 or Z≥1.8).
◉ Validation = B→A Δ stays >0 and right wing >0°.
C) Bearish rotation
◉ Triggers if B→A Δ flips negative and right wing turns gray/red.
◉ Breakdown below 83.9 on a sell-spike would confirm shift.
4) Conclusion
Bias: Constructive with pullback risk.
◉ Immediate OB tag suggests a pause; however, the buyer regime in the recent half (B→A) is still active.
◉ Key invalidation = loss of 83.9 (S1) with negative Δ.
◉ Key confirmation = acceptance above 93 with buy-spike absorption.
The points above are the technical and educational details from the ATAI Volume Pressure Analyzer (VPA). Put simply, the takeaway is this:
The stock made a sharp +20% move today up to 93, and the indicator flagged an “OverBought” condition. That means buying pressure was unusually strong and the market may need to cool off with a pause or short pullback. Still, the recent volume balance shows buyers remain in control, so the broader structure is still constructive.
If price can hold above 93 with renewed strong buy-side volume, continuation to the upside is favored. But if it slips below 84 and selling pressure grows, that would mark the start of a deeper correction. In simple terms: the main trend is still positive, but after today’s surge it makes sense to expect some digestion before the next leg.
[b]New All Time High for DOGE [/b]New All Time High for DOGE
Cup & handle on weekly timeframe on $DOGEUSD. This aligns perfectly with a squeeze from Bollinger Bands, top of Elliot Waves, solid support from next Fibonacci level and the launch of the ETF tomorrow! Run DOJE Run!

KC | Massive Break Out Incoming | LONGKingsoft Cloud Holdings Ltd. provides cloud storage and cloud computation services. It offers cloud platform consisting of cloud infrastructure, cutting-edge cloud products and architected industry-specific solutions across public cloud, enterprise cloud and AIoT cloud services. The firm's products include computing, networking, storage & CDN, database, data analysis and security. It offers medical & healthcare solutions, supply chain finance solutions, e-government solutions, internet of vehicles solutions, media cloud solutions, big data education & training solutions, cloud integrated service and cloud gaming service. The company was founded in 2012 and is headquartered in Beijing, China.

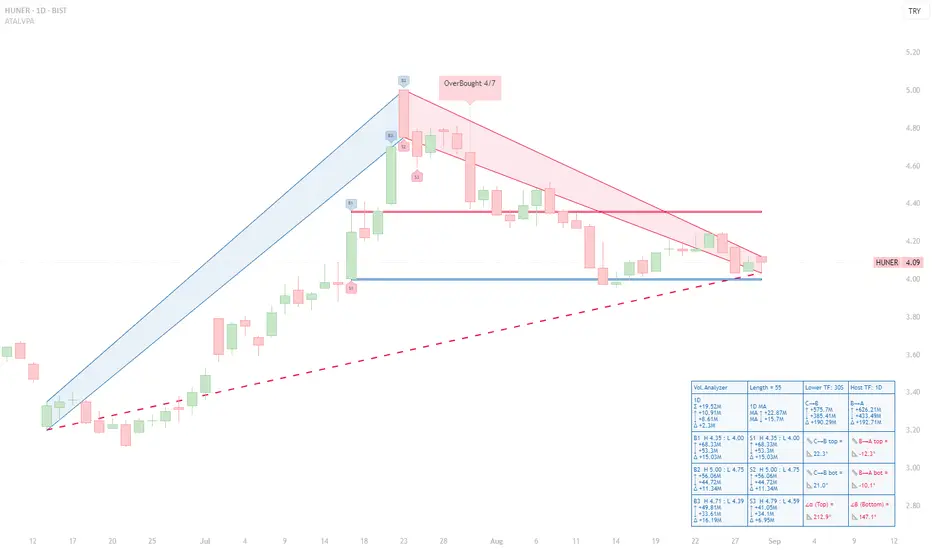
HUNER (1D) — Seller Bias After OB Cluster; Descending BA SlopesHUNER (1D) — Seller Bias After OB Cluster; Descending BA Slopes, 4.00 Support Under Test
Executive read (VPA, 55-bar window)
◉ OB/OS: An OverBought 4/7 tag printed at the apex; no confirmed OS on the right edge. That OB cluster preceded the entire red B→A leg and frames the current risk.
◉ Ranked volume peaks (Top-3):
- B1 (H 4.35/L 4.00) ↑ 68.33M, ↓ 53.3M, Δ +15.03M.
- B2 (H 5.00/L 4.75) ↑ 56.06M, ↓ 44.72M, Δ +11.34M.
- B3 (H 4.71/L 4.39) ↑ 49.81M, ↓ 33.61M, Δ +16.19M.
- S3 (H 4.79/L 4.59) ↑ 41.05M, ↓ 34.1M, Δ +6.95M.
Takeaway: Buying peaks were heavy, but subsequent price action failed to sustain higher highs; sellers have since controlled the B→A leg.
◉ Segment diagnostics:
- C→B advance: top/bottom slopes +22.3° / +21.0° → mature but constructive.
- B→A decline: top/bottom slopes –12.3° / –10.1° → persistent downside pressure.
- Orientation at B: α 212.9° (red) / β 147.1° (red) confirm the bearish state of the current swing geometry.
◉ Levels & structure:
- Support: the S1 low ≈ 4.00 is the active horizontal shelf repeatedly defended.
- Resistance: 4.35 (B1/S1 pivot), 4.71–4.79 (B3/S3 band), then 5.00 (B2). The descending B→A trendline caps bounces before these levels.
Actionable interpretation (educational):
Bias stays bearish-to-neutral while price trades beneath the B→A upper line and below 4.35. A credible shift would require (i) a fresh B-ranked bar with positive Δ near the right edge, and (ii) a close back above the B→A top. Failure to reclaim 4.35 after bounces leaves 4.00 vulnerable; a daily close below 4.00 would validate extension into the S-zones. Conversely, an OS print near 4.00 coupled with flattening BA slopes would set up a tactical mean-reversion toward 4.35 → 4.71/4.79.
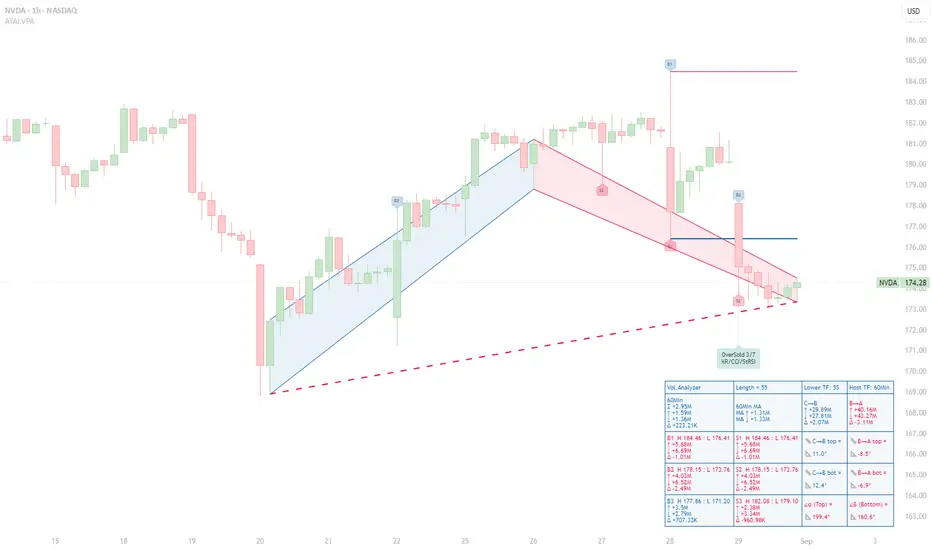
NVDA Under Pressure: Sellers Dominate as Volume Spikes Fail NVDA Under Pressure: Sellers Dominate as Volume Spikes Fail to Sustain Price Gains
Context – This 60‑minute NVDA chart uses the ATAI Volume Pressure Analyzer (VPA) on a 55‑bar window. The indicator plots an A→B→C structure: the blue C→B segment tracks the preceding advance and the red B→A segment the subsequent pull‑back. Up‑volume and down‑volume are calculated on a lower time frame and then aggregated into host‑time‑frame bars to expose buying and selling pressure.
Volume ranking – Within this window the indicator labels the three largest buying and selling bars (B1–B3 and S1–S3) and reports their statistics in a HUD. The most prominent bar, B1, spans H 184.46 to L 176.41 and shows 5.68 M up‑volume versus 6.69 M down‑volume, producing a –1.01 M delta. B2 (H 178.15–L 173.76) is even more bearish, with 4.03 M up‑volume and 6.52 M down‑volume (delta –2.49 M). B3 (H 177.86–L 171.20) is the only buying bar with a positive delta: 3.50 M up‑volume, 2.79 M down‑volume and a +0.71 M surplus. On the sell side, S1 and S2 coincide with B1 and B2 and mirror their negative deltas. S3 (H 182.08–L 179.10) registers 2.38 M up‑volume against 3.34 M down‑volume for a –0.96 M delta. Collectively, the pattern shows that peaks in buying volume have not yielded higher closes; sellers control all but one of the ranked bars.
Segment behaviour – The C→B rally accumulated roughly 29.89 M up‑volume versus 27.81 M down‑volume, a modest +2.07 M delta. In contrast, the B→A decline logged 40.16 M up‑volume against 43.27 M down‑volume, giving a –3.11 M deficit. The slopes of the trend lines accentuate the story: the advance has gentle positive slopes (~+11° top, +12.4° bottom), whereas the pull‑back slopes downward (–8.5° and –6.9°). Sellers have pushed prices lower more decisively than buyers previously drove them higher.
Price structure and implications – Price currently trades around 174.28 USD. Resistance sits near 178.15 (B2/S2) and 184.46 (B1/S1). As long as price remains beneath these pivot highs and subsequent B‑ranked bars fail to show a positive delta, the selling bias persists. The red dashed guide, connecting recent lows, continues to slope downward, confirming the bearish tilt. Only a flattening or reversal of this guide—coupled with a new B‑ranked bar sporting a positive delta—would hint at a shift in momentum.
Risk management – This analysis is intended for educational purposes. It illustrates how separating up‑ and down‑volume on lower time frames can reveal hidden pressures in intraday charts. It is not a recommendation to buy or sell NVDA stock. Always consult your own trading plan and risk tolerance before acting.
RELAXO FOOTWEARS A GOOD 2X CANDIDATE Relaxo Footwears Ltd, one of India’s leading footwear companies
👟 Brand Portfolio
Relaxo operates under several well-known sub-brands:
- Sparx – Sporty and casual shoes
- Flite – Lightweight slippers and sandals
- Bahamas – Youth-centric flip-flops
- Schoolmate – School shoes
- Boston, Belle, Mary Jane, Kid’s Fun – Niche and seasonal offering
🌍 Market Position
- Largest footwear manufacturer in India by volume
- Second-largest by revenue
- Ranked among India’s Top 500 Most Valuable Companies
- Strong presence in value segment (non-leather products like EVA/rubber slippers and canvas shoes)
TECHNICAL
- Momentum: Strong short-term bullish breakout
- Trend: Above key moving averages with RSI and MFI confirming strength
- Watch Zone: 500–510 for resistance; 470–480 as support
SHORT TERM TGT- 575-600
LONG TERMG TGT- 750-900

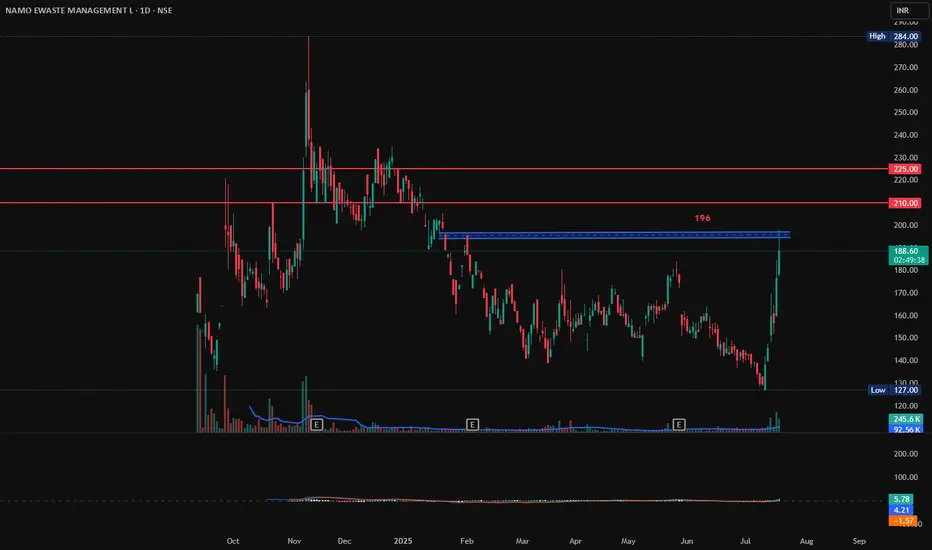
NAMO EWASTE MANAGEMENT, Long, Breakout, 1DNAMO EWASTE MANAGEMENT has gain 6% today with good volumes. If it breaks and sustains 196 with Bullish candlestick patterns like Bullish Engulfing, Hammer & Inverted Hammer, Piercing Line, Morning Star, Three White Soldiers, Tweezer Bottoms or Bullish Harami, then there are good chances for it to go further up from here. First target will be 210 and second target 225.
Entry: 196 (on Bullish candlestick pattern)
Target1: 210
Target2: 225.
SL: 185
MRPL, Bullish Momentum, Large Volumes, Long, 1DMRPL is showing very Bullish momentum with large volumes. If it breaks 160 with Bullish candlesticks then enter in the trade for the target of 170 and 180.
Entry: 160 (only on Bullish CandleStick)
Target1: 170
Target2: 180.

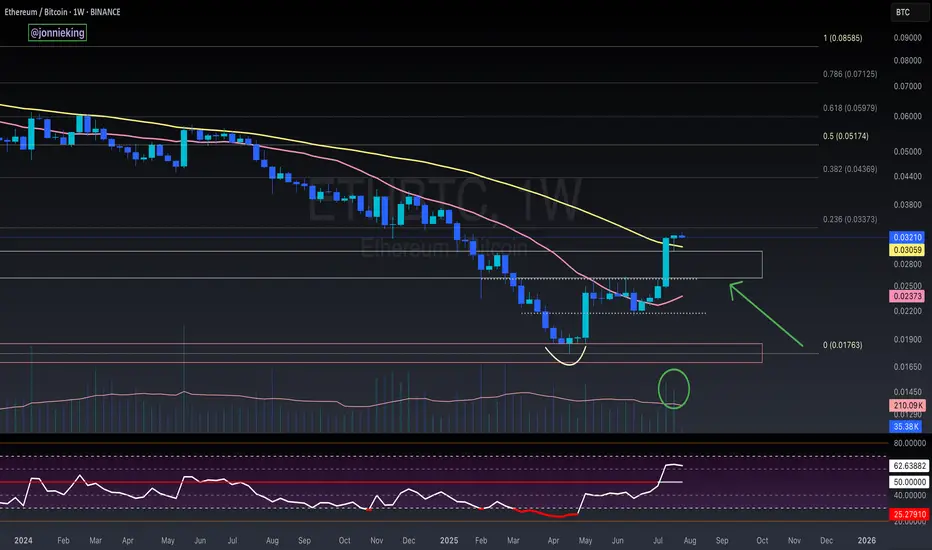
$ETH 2nd Weekly Close Above 50MA = Alt Season2nd Consecutive Weekly Close
above the 50MA for CRYPTOCAP:ETH
✅ Volume to confirm the breakout.
✅ RSI has bottomed.
WHAT TO WATCH 👀
┛Bullish Cross on the 20/50MA to confirm the next leg up.
┛Approaching some resistance ahead at the .236 Fib
┛Expect a small pullback in the next week or two so make sure to get your bids in.
Remember the rotation:
✅ BTC > ✅ ETH > Large Caps > Mid Caps > Micro Caps.
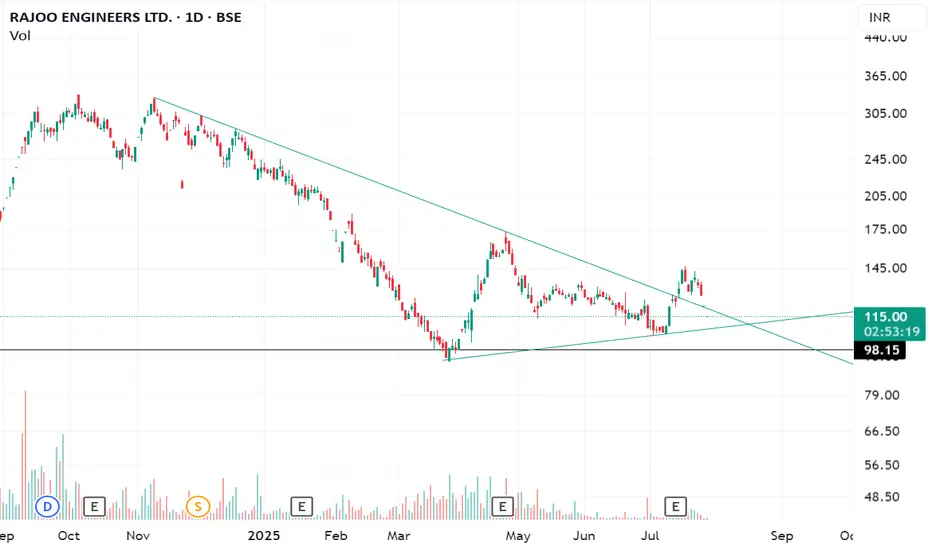
Symmetrical Triangle Pattern BreakoutThe stock has broken symmetrical triangle pattern with 3.5x volumes on 14July and now has retraced and is at a massive support. Buy at 115 for a target of 327. Use a 1:3 risk reward ratio