CAD/JPY Volume Profile 📊 and Price action analysis 📋Hello guys,
today, I would like to have a closer look at the CAD/JPY.
There has been quite a strong sell-off in the Asian session today. Such sell-off indicates strong and aggressive institutional Sellers manipulating the price downwards.
If you use my Flexible Volume Profile on the CAD/JPY chart, then you will see, that there were massive volumes accumulated around 86.76.
This is also the place where the strong sell-off started.
It appears, that strong institutional Sellers were building up their Short positions in that rotation around 86.76 and then they manipulated the price downwards.
Now we know, that there were strong Sellers around 86.76 and that they placed a lot of their Short positions there.
When the price makes a pullback into this area again, then it should work as a strong Resistance.
The reason is that the strong Sellers should defend this zone as it is important for them. Why? Because they placed a lot of their shorts there before.
They will defend it by placing aggressive Market Orders in order to push the price downwards from this place again.
This is what will make the zone around 86.76 a strong day-trading Resistance.
The setup i used here is called the “ Volume Profile: Accumulation Setup ”.
Weekly Point Of Control (POC)
A nice addition to this, is that the zone around 86.76 is also the Weekly Point Of Control (POC).
This means that the heaviest volumes throughout the current week have been traded there.
Weekly POC is by itself a very strong zone the market reacts to.
Here, it also adds strength to our 86.76 Resistance.
I hope you guys liked my analysis! Let me know what you think in the comments below!
Happy trading,
-Dale
Volumeindicator

Hifi Finance MFTUSDT - Bull flag, MASSIVE wedge +2000% gains!- Hifi (formerly Mainframe) - Rank #333 - is a Lending Protocol that allows anyone to borrow against their crypto.
- On the chart we can see a wedge and a bull flag, which is very bullish!
- Profit target is top of the wedge for massive gains.
- Bullish volume is higher than bearish at this moment.
- For expected duration of the trade, probability, stop loss, profit target, entry price and risk to reward ratio (RRR) - please check my signature below ↓
- If you want to see more of these ideas, hit "Like" & "Follow"!
MLong

Stacks STXUSDT - Head and shoulders + NEW ATH + 600%!- STX is forming an inverse head and shoulders pattern on the daily candles, which is a bullish reversal pattern.
- Volume favors bulls, as there is not any selling pressure.
- All time high resistance 2.85 can act as a resistance.
- The price is above a trendline from 2020.
- For expected duration of the trade, probability, stop loss, profit target, entry price and risk to reward ratio (RRR) - please check my signature below ↓
- If you want to see more of these ideas, hit "Like" & "Follow"!

Waves WAVESUSDT - Major Millennium Ascending Channel!- WAVES Rank #53, Volume 24h $171,458,661.
- On the weekly chart we can see an major ascending channel (9 touches up/down total)!
- But waves is very bullish and holding 20 weekly moving average.
- Next target is 0.618 trend-based FIB extension.
- For expected duration of the trade, probability, stop loss, profit target, entry price and risk to reward ratio (RRR) - please check my signature below ↓
- If you want to see more of these ideas, hit "Like" & "Follow"!
WLong

Audius AUDIOUSD - Head and Shoulders + Strong coin! NEW ATH- Audius - AUDIO Rank #221, Volume 24h $23,243,503.
- The price is forming an head and shoudlers pattern on the daily chart!
- Currently the price is above the 200 Moving average!
- ALL TIME HIGH resistance is the first target, but i belieave we can do much more.
- For expected duration of the trade, probability, stop loss, profit target, entry price and risk to reward ratio (RRR) - please check my signature below ↓
- If you want to see more of these ideas, hit "Like" & "Follow"!

Alpha Finance Lab - ALPHAUSD- Head and Shoulders!- Alpha Finance Lab - Rank #132, Volume 24h $62,118,554.
- On the chart we can clearly see and Head and Shoulders bullish pattern.
- Target is previous swing high & HaS & 1.1618 FIB!
- We can also spot a bullish volume, which dominates!
- For expected duration of the trade, probability, stop loss, profit target, entry price and risk to reward ratio (RRR) - please check my signature below ↓
- If you want to see more of these ideas, hit "Like" & "Follow"!
ALong

NIKE ✔️ : Volume Profile 📊 and Price Action Analysis 📋In today’s analysis, I will show you something similar as I am going to be talking about in the webinar.
I will show you how to use Volume Profile to identify the best trade entries for long-term investments. In this case, I will discuss the stock of the US company NIKE.
NIKE – Volume Profile Analysis
As many US companies NIKE is in the uptrend. One of the big reasons so many US companies are in an uptrend is that the FED is pumping free money into the US economy and this helps stocks to shoot higher and higher.
I am not a huge fan of buying a stock when it is at its all-time highs. What I prefer, is to wait for a pullback and then jump in.
A pullback to where? To heavy volume area.
The reason heavy volume areas are so important in an uptrend is that they work as strong Supports.
What they represent are places where the BIG trading institutions were adding massively to their Long positions.
When the price makes a pullback into such heavy volume area, then those BIG trading institutions will want to defend such zone.
Why Are Heavy Volume Areas Important?
Those areas are important for them. The reason is they placed a lot of volumes there. If the price drops below such heavy volume area, then their Long positions will go to red numbers. They obviously don’t want that. They want to make money on their stocks and they need them to go higher and higher.
So, what those BIG guys do is they defend such heavy volume areas. They also use them to add some more to their Longs as those places are places with huge liquidity.
All this makes the heavy volume areas strong Supports.
Heavy Volume Area On NIKE
Such a Support is also on NIKE. If you look at the chart (Weekly time frame) and use my Flexible Volume Profile there, then you should clearly see the strong volume area that formed there. This is our Support (starting around 137.00).
This is in my opinion the ideal place to jump in and participate in the uptrend.
Don’t enter at the all-time high. Wait for a discount 😉
The Volume Profile setup I used here is called the “ Trend Setup “. That’s a setup I use when there is a trend.
I hope you guys liked my analysis! Let me know what you think in the comments below!
Happy trading,
-Dale

USD/CAD strong sell-off 👇On USD/CAD is nice to see strong sell-off from the price 1.25190 , there are nice to see strong volume area....
Where is lot of contract accumulated...
I thing that sellers from this area will be defend this short position...
and when the price come back to this area, strong sellers will be push down the market again...
Support from the past + Strong Downtrend + Strong volume area is my mainly reason for this short trade....
Happy trading
Dale

AUD/CHF continue with the Downtrend 👇On AUD/CHF is nice to see strong sell-off from the price 0.66710 and 0.66950 , there are nice to see strong volume area....
Where is lot of contract accumulated...
I thing that sellers from this area will be defend this short position...
and when the price come back to this area, strong sellers will be push down the market again...
Strong Downtrend + Strong volume area is my mainly reason for this short trade....
Happy trading
Dale

CHF/JPY Day Trading Analysis 📋On CHF/JPY is nice to see strong buying reaction from the price 120.330 , there is nice to see strong volume area....
Where is lot of contract accumulated...
I thing that buyers from this area will be defend this long position...
and when the price come back to this area, strong buyers will be push up the market again...
Uptrend + Strong buying activity + Strong volume area is my mainly reason for this long trade....
Happy trading
Dale

EUR/GBP Volume areas 📊 And Price Action AnalysisHello guys,
today, I will have a closer look at the EUR/GBP.
What caught my eye at first was a strong selling activity yesterday (that huge red candle you can see in the picture below).
Such a strong and rapid sell-off is a sign of aggressive sellers.
Those sellers were most likely building up their Short positions in the rotation that took place before the sell-off.
Those heavy volumes that were accumulated before the sell-off are quite important and I think those were the BIG institutional traders getting ready before manipulating the price downwards.
When the price makes a pullback into this area again (starting around 0.8546) then those BIG guys will want to defend this zone and push the price downwards again.
This is what should make this zone a strong Resistance.
A Two-Week POC
Another nice addition to this Resistance is that it is a very significant volume-based level even from the bigger perspective.
This Resistance also represents a place where the heaviest volumes throughout the last two weeks got traded! This means it is a two-week POC ( Point Of Control ).
You can see that on the picture below, where I merged two weekly Volume Profiles into one two-week Volume Profile.
This is another thing that adds strength to our Resistance around 0.8546.
I hope you guys liked my analysis! Let me know what you think in the comments below!
Happy trading,
-Dale

NZD/JPY: Day Trading Analysis With Volume Profile 📊 On NZD/JPY is nice to see strong buying reaction from the price 77.890 and 77.610 , there is nice to see strong volume areas....
Where is lot of contract accumulated...
I thing that buyers from this area will be defend this long position...
and when the price come back to this area, strong buyers will be push up the market again...
Strong buying activity + Strong volume area is my mainly reason for this long trade....
Happy trading
Dale

AUD/CAD: Volume Profile And Price Action Swing Trading AnalysisHello guys,
today, we will have a look at a swing trading analysis on AUD/CAD.
For swing trading analysis I like to use 4-hour charts or Daily charts. Today, I will do the whole thing on the Daily chart as it is really nicely visible and easy to understand there.
So, why have I picked AUD/CAD? Because there is a nice and strong trend. If you have been following me for some time then you know that I like to look for significant volumes that were traded inside such trends.
I look for those using my Flexible Volume Profile .
Volume Profile Setu p
In this case, I used my Flexible Volume Profile to look into the downtrend area. It revealed a strong Volume Cluster.
Such Volume Cluster represents a place where strong Sellers were adding to their Short positions – it reveals their big, institutional volumes.
When the price makes it back to this Volume Cluster area (starting at 0.9473) then those strong institutional traders should defend it. They will defend it because they placed a lot of their Shorts there before (this place is important for them).
This is why this zone should work as a strong Resistance.
This setup is called “ Volume Profile: Trend Setup “
Price Action Setup
Another reason this 0.9473 zone should work as a Resistance is that it worked as a strong Support in the past.
How can I tell? Because the price bounced off this zone twice, and always very strongly.
When this Support got breached it became a Resistance. This is my favorite Price Action setup that I like to use as a combo with my Volume Profile setups.
You can learn more about this setup here:
Price Action Setup: Support → Resistance
What I like about this is that those two setups (Volume Profile and Price Action setups) nicely align and both point to the same Resistance area around 0.9473.
I hope you guys liked my analysis! Let me know what you think in the comments below!
Happy trading,
-Dale

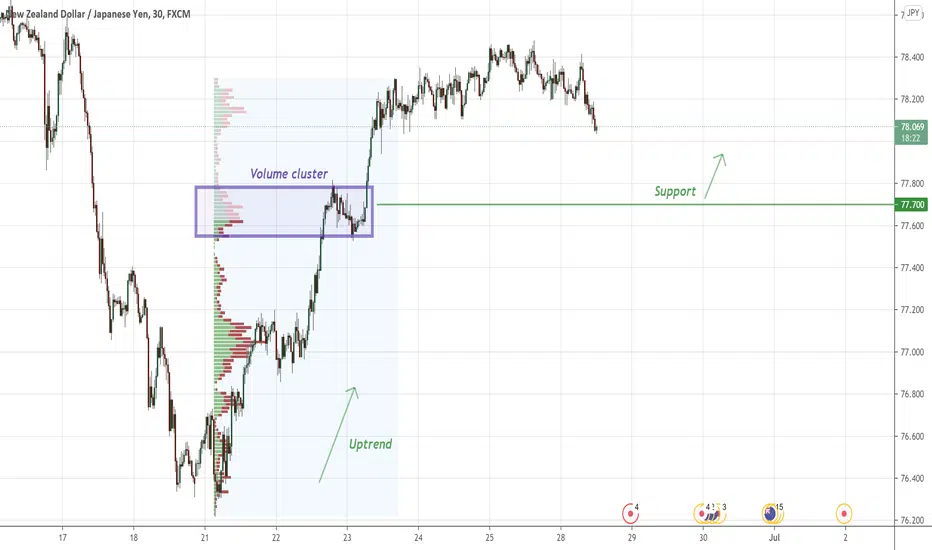
NZD/JPY: Day Trading Analysis With Volume Profile 📊 On NZD/JPY is nice to see strong buying reaction from the price 77.7 , there is nice to see strong volume areas....
Where is lot of contract accumulated...
I thing that buyers from this area will be defend this long position...
and when the price come back to this area, strong buyers will be push up the market again...
Uptrend +Strong buying activity + Strong volume area is my mainly reason for this long trade....
Happy trading
Dale
NZD/CAD: Day Trading Analysis With Volume Profile 📊
On NZD/CAD is nice to see strong sell-off from the price 0.8676 , there are nice to see strong volume area....
Where is lot of contract accumulated...
I thing that sellers from this area will be defend this short position...
and when the price come back to this area, strong sellers will be push down the market again...
Strong sellers + Downtrend + Support from the past is my mainly reason for this short trade....
I placed in the graph how this trade should be managed correctly..
I moved Take profit to another significant cluster volume ..
Happy trading
Dale

EUR/CHF Resistance 🔪
On EUR/CHF is nice to see strong sell-off from the price 1.1009 , there are nice to see strong volume area....
Where is lot of contract accumulated...
I thing that sellers from this area will be defend this short position...
and when the price come back to this area, strong sellers will be push down the market again...
Rejection of higher prices + Downtrend + Strong volume area is my mainly reason for this short trade....
Happy trading
Dale

AUD/JPY: Volume Profile and Price Action Day Trading AnalysisHello guys,
in today’s intraday trading analysis I will focus on AUD/JPY.
There was a trend day yesterday and the AUD/JPY went down. Now there seems there may be a correction and the price is heading towards a pretty significant Resistance level. So let me talk about that.
Before the strong selling yesterday, there was a rotation. In that rotation heavy volumes got traded. You can see it if you use my Flexible Volume Profile.
I think that in this volume area strong Sellers were building up their Short positions. Then they pushed the price aggressively downwards.
This tells us that this zone (around 84.78) should be important for strong institutional Sellers . That’s why I think that if there is a pullback to this zone again, it will work as a Resistance.
This Volume Profile setup I used is called the “ Volume Accumulation Setup “.
Weekly Point Of Control
What adds strength to this Resistance around 84.78 is that it is also the Point Of Control (POC) of this week. This means that the heaviest volumes throughout this week were traded at this specific price level. This definitely adds significance to this level and it’s a nice confluence to have there.
Support Becoming Resistance (Price Action Setup)
Another nice addition to add strength to our Resistance is a simple Price Action setup called “ Support → Resistance “.
As you can see from the picture below, our Resistance at 84.78 worked as a strong Support in the past. The price bounced off it several times.
This Support is now breached. When it got breached and the price started to move below it, then it became a Resistance.
That’s what this Price Action setup is all about – a Support that got breached becomes a Resistance.
The thing I like here is that all those three signals line up nicely together and they all point to our 84.78 Resistance.
I hope you guys liked this day trading analysis! Let me know your thoughts in the comments below!
Happy trading,
-Dale
P.S. If you are with my for some time, maybe you have noticed one more nice setup that played out recently on AUD/JPY. It was a trade based on the Volume Profile Trend Setup .

🟨 GOLD: Market Profile 📊 and Price Action Analysis 📋Today, I am also going to do a Swing trading analysis. This time on Gold!
As I wrote in the yesterday’s post, I do my Swing trade analysis using mostly Daily time frame. Today, I also used 4-Hour time frame.
What initially caught my eye on Gold was the newly formed uptrend that has been on Gold since the start of this month. Big trading institutions are clearly pushing the price of Gold upwards.
GOLD: Volume Profile Analysis
I used my Volume Profile (MT4 Volume Profile) to look into the current uptrend. The Profile showed a significant volume area around 1170 – 1790.
This is a valuable information because it tells us that strong Buyers used this zone to add to their Long positions. Then they pushed the price even higher.
Even though the price has already left this zone and it is moving above it, this zone is still important. It is so because strong Buyers placed a lot of their Longs there.
If the price comes back, then those Buyers will mostly want to use this zone again – to add to their Longs and to push the price up again.
This is why it should work as a strong Support. Now we just need to wait for a pullback.
The setup I used is called the “ Trend Setup “. I like to trade it when there is a trend.
Daily Time Frame
The whole situation is maybe a bit easier to read on a Daily chart. The reason I used 4 Hour chart is that I used TPO Profile. TPO profile is always more detailed and precise if you use it on a faster time frame.
If you want to know what is the difference between Volume Profile and TPO (Market Profile) then check out this video:
Volume Profile vs. Market Profile – What Is The Difference?
I hope you guys liked today’s Swing trade analysis! Let me know what you think in the comments below!
Happy trading,
-Dale

USD/CAD Swing Volume Profile 📊 and Price Action Analysis 📋Hello guys,
today’s post will be a Swing trade analysis of USD/CAD.
With Swing trades, I do my analysis mostly using Daily charts. This allows me to see the bigger picture. I need the bigger picture to see what the BIG trading institutions do on the higher time frames.
With Swing trades, I also use way wider Take Profits and Stop Losses than with day trading levels.
What caught my eye on the USD/CAD was a strong downtrend that started in April and continues until now.
USD/CAD: Volume Profile Analysis
With a trend like this, I am always interested in how the volumes were distributed there – within the trend area. For this I use my Flexible Volume Profile indicator. I simply drag it over the whole trend area – like in the picture below.
As you can see from the picture, there is a couple of “volume bumps” which I call the Volume Clusters. Those Volume Clusters represent places where heavy volumes were traded. I am always after the heavy volumes because heavy volumes = Big institutions.
In the picture above I selected a Volume Cluster around 1.2275. Heavy volumes were traded there and then, after a couple of days, the sell-off continued.
It seems that the BIG institutions were adding to their Short positions in that Volume Cluster. Then they pushed the price downwards again.
When the price makes it back into the 1.2275 area it is pretty likely that those strong institutional Sellers will want to defend this zone. It is an important zone for them since they placed a lot of their new Shorts there.
So, what I think will happen is that they will want to push (manipulate) the price downwards from this place again. This is why I think this will make the area around 1.2275 a strong Resistance.
I call this setup the “ Trend Setup “. I trade it when there is a trend.
I hope you guys liked today’s analysis! Let me know what you think in the comments below.
Happy trading,
-Dale

CAD/JPY Volume Profile analysis 📊
On CAD/JPY is nice to see strong buying reaction from the price 88.21, there is nice to see strong volume areas....
Where is lot of contract accumulated...
I thing that buyers from this area will be defend this long position...
and when the price come back to this area, strong buyers will be push up the market again...
Uptend + Strong buying activity + Strong volume area is my mainly reason for this long trade....
Happy trading
Dale

NZD/CAD: Day Trading Analysis With Volume Profile 📊 On NZD/CAD is nice to see strong sell-off from the price 0.8895 , there are nice to see strong volume area....
Where is lot of contract accumulated...
I thing that sellers from this area will be defend this short position...
and when the price come back to this area, strong sellers will be push down the market again...
Strong sellers + Downtrend + Strong volume area is my mainly reason for this short trade....
Happy trading
Dale

GBP/USD: Volume Profile Analysis 📊
On GBP/USD is nice to see strong sell-off from the price 1.3906 , there are nice to see strong volume area....
Where is lot of contract accumulated...
I thing that sellers from this area will be defend this short position...
and when the price come back to this area, strong sellers will be push down the market again...
Strong sellers + Downtrend + Strong volume area + POC of the Week is my mainly reason for this short trade....
Happy trading
Dale

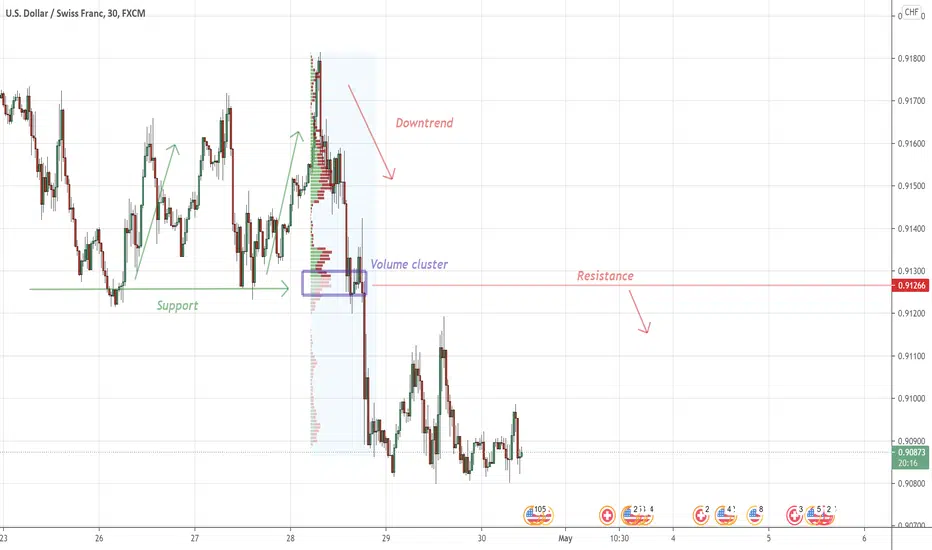
USD/CHF: Volume Profile 📊 Analysis
On USD/CHF is nice to see strong sell-off from the price 0.91266 , there are nice to see strong volume area....
Where is lot of contract accumulated...
I thing that sellers from this area will be defend this short position...
and when the price come back to this area, strong sellers will be push down the market again...
Strong Support from the past + Strong sellers + Downtrend + Strong volume area is my mainly reason for this short trade....
Happy trading
Dale