Stock Market Trap: Why Your Stop Loss is Just a Pie CrustIn the global theater of financial markets, many retail traders feel like protagonists in a psychological thriller. You identify a pristine support level, set your stop loss with surgical precision, and wait.
Suddenly, a violent candle "hunts" your level, triggers your exit, and—as if by magic—the market reverses and rallies in your original direction.
You feel watched. You feel targeted by "Operators."
This is not a conspiracy; it is the Sovereign Reality of Liquidity.
1. The Institutional Paradox: The "Big Fish" Problem
To understand why you are being hunted, you must understand the Inertia of Size.
Imagine a massive Institution (FII) attempting to deploy huge capital. They are like a Blue Whale in a shallow pond.
The Constraint: If they execute a market order, they will exhaust all available sellers and drive the price up against themselves (Slippage).
The Requirement: To enter a massive LONG position without slippage, they require an equally massive pool of Sell Orders at a specific price.
The Trap:
Your Stop Loss (on a Long position) is technically a Sell Market Order.
When thousands of retail traders place their stops at a predictable level, they create a Liquidity Cluster.
The Big Players don’t "see" your account; they see a concentrated pool of liquidity. They utilize algorithmic precision to drive price into that pool, "harvesting" your sell orders to fill their massive buy orders at a wholesale price.
2. The Analogy: The Fragile Crust
Think of Market Structure like a Pie or Samosa.
The "Support Level" is the golden, crispy crust. It appears solid.
But for the Smart Money, the crust is merely an obstacle to the filling (The Liquidity) inside.
They must break the crust (trigger the stops) to access the liquidity that fuels their move. Once the crust is shattered and the liquidity is absorbed, the shell is discarded, and the market rallies.
3. Engineering Your Edge
To evolve from "Retail Prey" to "Institutional Aligned," you must stop trading the lines and start trading the volume.
A. The Ceiling (High Volume Node) When price approaches a massive volume shelf from below, do not buy the breakout immediately. The trapped buyers from the past will sell to exit at breakeven. This is often a Shorting Zone.
B. The Floor (Liquidity Trap) When price drops into a historical volume cluster, do not panic sell.
The Professional Reaction: Wait for the "Crust" break (a dip below the level to hunt stops).
The Trigger: Watch for a strong 1-hour candle close back ABOVE the level. This is the Swing Failure Pattern (SFP).
🏛 Case Study: Nifty 50 Index
(Please refer to the chart image above)
We can see this mechanic playing out live on the Nifty 50:
The Operator's Fortress: Note the massive Volume Shelf (HVN) at the top. This acts as a supply zone.
The Psychological Level (25,000): This is a round number where most retail stops are hiding.
The Plan: We do not blind buy 25,000. We wait for the "Stop Hunt" into the 24,900 zone, followed by a sharp reclamation. That is the Institutional Entry.
💻 BONUS: The "Wick Detector" Script (Free)
I have written a custom Pine Script tool for the TradeX Guru community. This tool automatically highlights candles that "break the crust" (long lower wicks) and reject price.
@version=6
indicator("Wick Detector", overlay=true)
// Calculate the size of the lower wick relative to the body
wickRatio = (math.min(open, close) - low) / (high - low)
// Identify if the lower wick is > 50% of the candle (The Liquidity Grab)
isLiquidityGrab = wickRatio > 0.50
plotshape(isLiquidityGrab, title="Grab", location=location.belowbar, color=color.teal, style=shape.diamond)
// —————————————————————————————————————————————————————————————————————————————
// BRAND MARK
// —————————————————————————————————————————————————————————————————————————————
var table wMark = table.new(position.top_center, 1, 1)
if barstate.islast
table.cell(wMark, 0, 0, "TradeX Guru", text_color=color.new(#f5a733, 20), text_size=size.huge)
The Math: It measures the lower wick (the tail) of every candle.
The Trigger: If the lower wick is larger than 50% of the total candle size, it prints a Teal Diamond (💎) below that candle.
How to Learn Trade With It (The Strategy)
Do not buy every diamond you see. Use this 3-step filter:
Step 1: Check the Location (Context) Only look at the Diamond if it appears at a Key Level:
Is price at a strong Support zone?
Is price near a round number (like 25,000 on Nifty)?
If a diamond appears in the middle of nowhere, ignore it.
Step 2: The Signal
Wait for the candle with the Teal Diamond to close.
This confirms the "Stop Hunt" is finished. The "Whale" has absorbed the sellers.
Step 3: The Entry & Stop Loss
Entry: Buy on the next candle if it stays above the diamond candle's low.
Stop Loss: Place your SL just below the Low of the diamond candle. (If price breaks this low, the setup failed).
The Meaning: A long lower wick means sellers tried to push the price down (breaking the crust), but buyers aggressively pushed it back up. This is a classic Liquidity Grab.
The Axiom: The market is not a charitable organization. It is an efficiency engine designed to transfer capital from the Impatient to the Disciplined.
Disclaimer: This analysis is for educational purposes only and does not constitute financial advice. Trading involves significant risk.
Volumeprofileindicator

How to Trade with Volume Profile in TradingView Master Volume Profile using TradingView's powerful charting tools in this step-by-step tutorial from Optimus Futures.
Volume Profile is an advanced charting indicator that helps traders identify key support and resistance levels, areas of price acceptance, and potential breakout zones by showing where trading activity is concentrated at different price levels.
What You'll Learn:
Understanding Volume Profile as a price-based volume tool that displays trading activity horizontally across price levels
How the Point of Control (POC) represents the price level with the highest traded volume
How the Value Area encompasses approximately 70% of all traded volume, bounded by the Value Area High (VAH) and Value Area Low (VAL)
Why High Volume Nodes signal areas of price acceptance and potential support or resistance
Why Low Volume Nodes signal areas of price rejection where markets tend to move quickly
Recognizing when price trades above or below the previous session's Value Area for directional bias
Why these levels aren't automatic buy or sell triggers, and how to confirm them with other tools like traditional support/resistance or trend analysis
Identifying the "low volume node breakout," a setup where price accelerates through thin areas
Spotting potential mean-reversion trades when price returns to the POC after an extended move
How to add Volume Profile tools on TradingView via the drawing tools panel
Understanding Fixed Range, Anchored, and Session Volume Profile options and when to use each
Practical examples using futures charts
Applying Volume Profile across daily, weekly, and intraday timeframes for market structure analysis and trade planning
Learn more about futures trading with TradingView:
optimusfutures.com
Disclaimer
There is a substantial risk of loss in futures trading. Past performance is not indicative of future results. Please trade only with risk capital. We are not responsible for any third-party links, comments, or content shared on TradingView. Any opinions, links, or messages posted by users on TradingView do not represent our views or recommendations. Please exercise your own judgment and due diligence when engaging with any external content or user commentary.
This video represents the opinion of Optimus Futures and is intended for educational purposes only. Chart interpretations are presented solely to illustrate objective technical concepts and should not be viewed as predictive of future market behavior. In our opinion, charts are analytical tools — not forecasting instruments.

How to Read Volume Profile + AVWAP — A Complete GuideVolume Profile is one of the most underutilized tools in technical analysis. This guide breaks down how to read it and combine it with AVWAP for a complete market structure framework.
VOLUME PROFILE BASICS
Most traders use volume over time (the bars at the bottom). Volume Profile shows volume at price — where buyers and sellers actually agreed.
Point of Control (POC)
The price with the highest volume. The market's "fair value." Price above POC = bullish bias. Price below = bearish.
Value Area (70%)
The range where most trading occurred. Inside = balance. Outside = imbalance seeking new value.
High Volume Nodes (HVN)
Heavy volume zones. Expect slowdown or reversal. Positions were built here — traders defend them.
Low Volume Nodes (LVN)
Thin volume zones. Price rejected these levels. When price returns, expect fast movement.
ADDING AVWAP
Anchor VWAP to the last significant swing. This shows the average cost basis for everyone who entered during this move.
Price above AVWAP = longs in profit, dips get bought
Price below AVWAP = longs underwater, rallies get sold
The confluence:
POC + AVWAP alignment = high-probability zone
POC + AVWAP divergence = expect reversion
THE FRAMEWORK
Identify POC, VAH, VAL
Mark nearest HVN/LVN above and below
Anchor AVWAP to the swing that started the current move
Determine regime: price above or below AVWAP?
Now you have:
Structure (where will price react?)
Bias (which direction is favored?)
APPLYING THIS DAILY
This is the framework I use every day in my market analysis.
I publish a daily newsletter that applies Volume Profile, AVWAP, and regime analysis to real markets — with specific levels and scenarios for the session ahead.
Happy trading!

Seeing What Price Alone Can’t Show: The Power of Volume ProfileElements of a Volume Profile
The Volume Profile is a powerful charting tool that shows how trading volume is distributed across different price levels.
While normal volume bars appear below the chart showing activity per candle, the Volume Profile appears horizontally on the price scale, showing where most buying and selling took place.
It helps traders understand which price levels attracted the most interest, and where the market might find support or resistance in the future.
Price and Volume Relationship
The core idea of a Volume Profile is that price levels with high volume indicate fair value zones, where both buyers and sellers agree on a price.
On the other hand, low-volume areas indicate rejection zones, where price moved quickly because there was little interest to trade there.
Value Area (VA)
This is one of the most important parts of the profile.
The Value Area represents the range of price where approximately 70% of total trading volume occurred during a selected period.
Value Area High (VAH): The upper boundary of the value area.
→ Above this level, price is considered expensive or overvalued.
Value Area Low (VAL): The lower boundary of the value area.
→ Below this level, price is considered cheap or undervalued.
When price sustains out of the value area, it often indicates that new momentum or trend activity is beginning.
Point of Control (POC)
The POC is the price level with the highest traded volume within the profile.
It represents the price where the market spent the most time and volume. The level often acts as a magnet for future price movements.
Traders watch this level closely as it often becomes a strong support or resistance zone.
High Volume Nodes (HVN)
These are thick areas on the Volume Profile, showing where the market traded heavily (less than POC)
They indicate acceptance zones that is, the price levels where many transactions happened because buyers and sellers agreed on value.
When price returns to an HVN, it often pauses or consolidates before choosing direction again
Low Volume Nodes (LVN)
These are thin or narrow areas on the profile where very little trading occurred.
They mark rejection zones that is, the areas where price moved quickly without much interest.
When price approaches an LVN, it often moves rapidly through it again, because there is less resistance.
Profile Shapes
The overall shape of the Volume Profile also tells a story about market behavior:
D-shaped Profile: Balanced market - fair value established (typical during consolidation).
P-shaped Profile: Short-covering rally - bullish bias
b-shaped Profile: Long liquidation - bearish bias
Double Distribution: Two separate areas of interest - potential trend continuation.
For more on Volume Profile shapes refer
Key Takeaways
The Volume Profile helps traders see where the market traded most heavily at each price level.
Key elements such as the Value Area, POC, High and Low Volume Nodes, and profile shape reveal how the market perceives value and interest.
Understanding these elements helps traders identify strong support/resistance zones, potential breakout areas, and market balance or imbalance situations.
Do you use Volume Profile in your trading? Share your thoughts in the comments below!

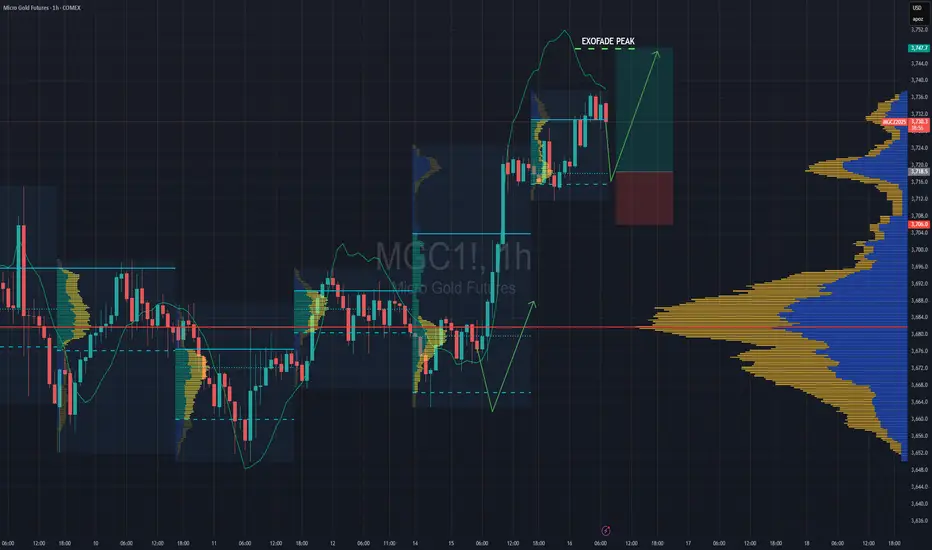
Market on Fire: S&P 500 & Nasdaq Rally Towards New HighsWe have a beautiful P-Shape volume profile formed at the top and we broke and closed above it.
The P-shape volume profile is bullish profile that is formed when large volumes are transacted at the highs meaning participants a willing to pay premium price . You can see the POC so close to the top of the VAH
I checked the CVD of the volume on a footprint chart and i see the volume has -ve Delta , which means alot of aggressive sellers transacted there trying to push the price down. Now that they are being squeezed slowly and start closing out their positions, it should fuel the uptrend. i entered the trade soon as we broke and closed above the value area.
Food for thought.. Who was willing to pay the high price to buy from the aggressive sellers?
DEFINITIONS
POC- point of control
VAH- Value area high
CVD- Cumulative Volume Delta
Target is the ExoFade area..Lets see how this trade goes

Gold Futures Day Trade Long EntryDont have enough time to go too into details on this one.
-Trade entry is based on Session Volume profile
- LVN on Visible range profile
- Entry at VAL - will likely get triggered during NY session today
- Weekly & Daily VWAP levels
Enjoy !!
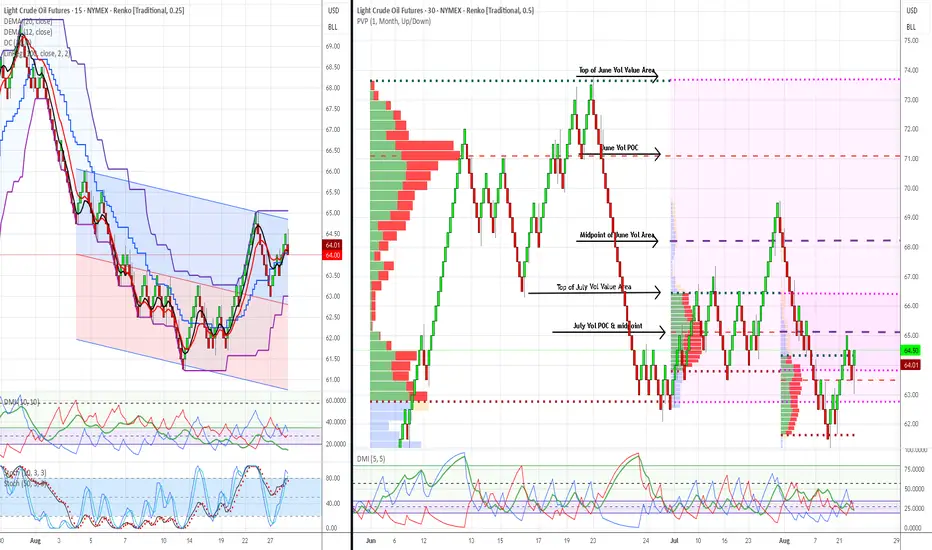
WTI Crude Oil Trading Analysis: 02-September-2025Week Ahead Plan: September 2-6, 2025
Analysis Period : August 26-30, 2025 Review | September 2-6, 2025 Outlook
Market : WTI Crude Oil Futures (CL1!)
Methodology : Dual Renko Chart System ($0.25/15min + $0.50/30min)
Current Price : $64.00 (August 30, 2025)
________________________________________
Strategic Outlook & Market Setup
Primary Scenario (70% Probability): Pullback First, Then Recovery
What to Expect : Market opens lower Tuesday ($63.00-63.50 range) due to bearish signal on short-term chart. This creates a buying opportunity if support holds.
Trading Plan:
Tuesday Opening : Expect gap down - don't panic, this was anticipated
Buy Zone : Look for entries between $62.00-63.50 (strong institutional support)
Confirmation Needed : Wait for short-term trend to flip bullish again before buying
Target : Still aiming for $66.50 but may take extra 3-5 days to get there
Secondary Scenario (25% Probability): Sideways Consolidation
What to Expect : Market trades in $63.50-64.50 range for several days while technical signals realign.
Trading Plan:
Strategy: Be patient - don't force trades in choppy conditions
Wait For: Clear breakout above $64.50 with volume
Risk: Could waste 1-2 weeks in sideways action
Low Probability Scenario (5% Probability): Immediate Continuation Up
What to Expect : Market gaps up above $64.25 and keeps rising.
Trading Plan:
Verify: Make sure both short-term and long-term signals turn bullish
Caution: Be skeptical without strong volume confirmation
Action: Can buy but use smaller position sizes until confirmed
________________________________________
Market Risk Factors & Monitoring
Critical Support Level : $62.00
Why Important: Massive institutional buying occurred here - if it breaks, the bullish case is dead
Action If Broken: Exit all long positions immediately, wait for new setup
Probability of Break: Low (15%) but must be respected
Key Events This Week :
Tuesday: ISM Services data (economic health indicator)
Wednesday: Weekly oil inventory report (could cause volatility)
Friday: Jobs report (affects overall market sentiment)
Warning Signs to Watch:
Technical: Short-term trend staying bearish for more than 3 days
Volume: Declining volume on any bounce attempts
Support: Any trading below $62.50 for extended periods
Time: No progress toward $66.50 target within 10 total trading days
Positive Signs to Look For :
Technical: Short-term trend flipping back to bullish (key confirmation)
Volume: Above-average volume on any recovery moves
Support: Strong buying interest at $62-63 zone
Momentum: Clean breakout above $64.50 with follow-through
________________________________________
Forward-Looking Adjustments
Modified Risk Management :
Position Size: Use 50% of normal position size until both timeframes align bullish
Stop Loss: Tighter stops at $62.75 (just below support zone)
Entry Patience: Don't chase - wait for pullback to support levels
Profit Taking: Be more aggressive taking profits at first target ($66.50)
Revised Entry Strategy:
Before Buying, Confirm ALL Three:
Price: Trading at or near $62-63 support zone
Technical: Short-term trend signal flips back to bullish
Volume: Above-average buying interest visible
Timeline Expectations :
Days 1-3: Expect pullback/consolidation phase
Days 4-5: Look for bullish confirmation signals
Days 6-10: Resume advance toward $66.50 target if signals align
Beyond Day 10: If no progress, reassess entire strategy
Success Metrics:
Minimum Goal: Protect capital during pullback phase
Primary Target: $66.50 within 2 weeks (revised from 1 week)
Risk Limit: Maximum 2% account loss if support fails
Time Limit: Exit strategy if no directional progress within 10 days total
Simplified Decision Framework :
Green Light to Buy: Price near $62-63 + Short-term trend bullish + Good volume Yellow Light (Wait): Mixed signals, choppy price action, low volume
Red Light (Exit): Price below $62, bearish trend continuing, time limit exceeded
________________________________________
Bottom Line : The bigger picture remains bullish, but short-term signals suggest a pullback first. Use any weakness to $62-63 as a buying opportunity, but only with proper confirmation. Be patient - the setup is still valid but timing may be delayed by a few days.
________________________________________
Document Classification : Trading Analysis
Next Update : September 6, 2025 (Weekly Review)
Risk Level : Moderate (controlled institutional setup)
This analysis represents continued validation of a systematic, institutional-grade trading methodology with demonstrated predictive accuracy and risk control capabilities. This is a view that represents possible scenarios but ultimate responsibility is with each individual trader.
Risk Disclaimer: Past performance does not guarantee future results. All trading involves risk of loss.
Pushing Hard To RisePrice has been butting up against the 1.1585 level for days. I believe a large breakout is brewing.
Weekly point of control and the dailies are all in a similar area. Still that huge fair value gap from last week below, but I believe this will stay for now.
I believe the highs at 1.1800 will be tested again and possibly broken. There seems to be little faith in the USD at the moment.

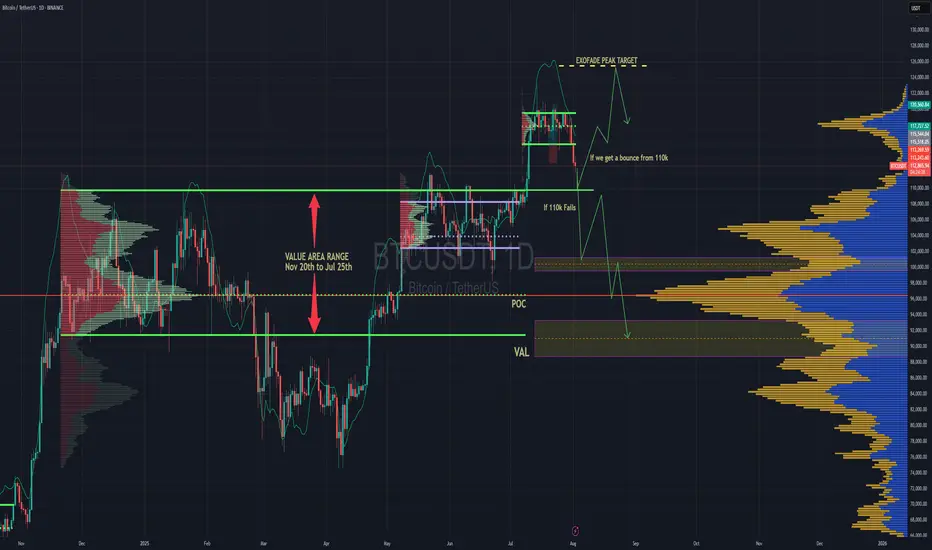
BTC Forecast For August & September. The Only Roadmap You Need !This is one is so obvious, its a no brainer , and would likely be very easy to trade as long as you follow this road map i have provided.
The Value Area High at 110k price range is most important upcoming battle line between bull vs bear. If bulls fail to get a strong bounce from 110k and we close at least 2 daily candles below it. Then it would mean bears have full control and the implication of that is that since we would at that point be closing back inside an established Value Area range, formed between Nov 20th to Jul 25th, then it would mean the probability of price selling all the way down to re-test the VAL (value area low) at $91.6k would instantly become very very high.
After re-testing $91.6k we'll watch and see what happens.
It'll either hold after grabbing some liquidity below and stay in the Value Area Range until further notice Or we lose it and the sell off continues. Bear market will be in full swing if that happens and you can bet a ton of weak hands will start to exit due to max pain & cascading long liquidations. Fear index will be back in the red at that point as capitulation starts to set in. Alot of new alts and meme coins will be completely obliterated.
Bullish Continuation Scenario
If bulls get a strong bounce from 110k and don't close back inside the Value Area Range below, then we could continue up to a make a new ATH for a classic trend pullback continuation trade. Once we get back above 115.4k, the dream of a new ATH will become much more realistic. There is an UFA(Unfinished Auction) at 120.8k which is only visible to traders using the market profile or footprint chart. This make poor high and needs to be taking out at some point.
For the Price target to the upside, we would be using the peak formation line of the ExoFade indicator.
BTC Balanced Volume Profile BTC is now trading in a textbook D-Shape Volume Profile. In english - Buyers & Sellers are happy to transact here and will stay inside the value area & consolidating sideways until further notice.
Consolidation at POC is a signature of this profile, and one of the easiest and least stressful trade setups because now, your mission, should you chose to accept. Is to fade the Highs (VAH) and Lows (VAL) and avoid the middle unless you love donating money to the market.
I'll have buy limit orders waiting right below the VAL where we have the single prints. It doesn't get any easier than this.
Doesn't mean price cant rip through, but this is always the best entry with less risk, especially when the single prints have not been tested yet..
BINANCE:BTCUSD CME:MBT1!

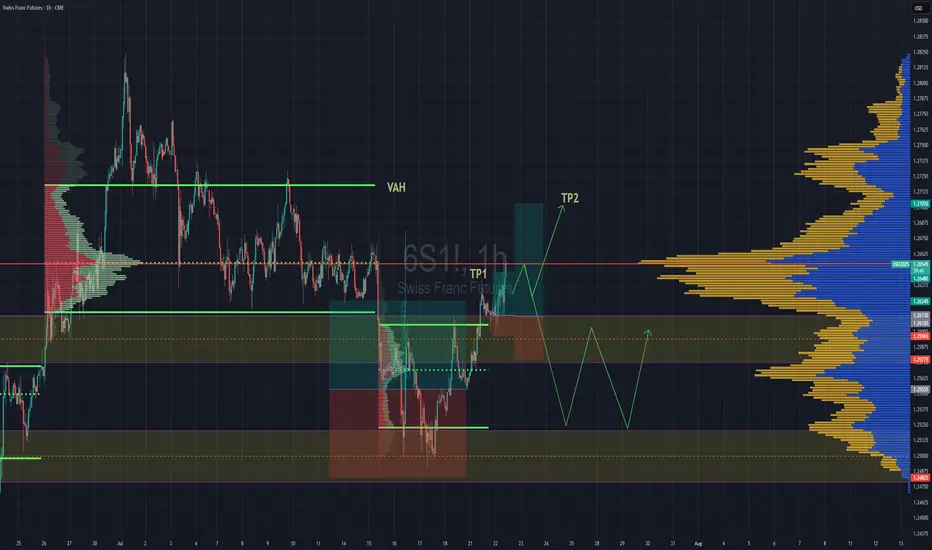
Swiss Gaining Momentum Against The DollarSwiss futures gaining strength against the dollar. We have broken back into previous rotation that was somewhat balanced, but still leaning towards a "b" style volume profile . If we are able to get above the POC, then we''ll go straight for TP2 close to Value are high.
If the POC is really strong and we reject hard from the POC then we might lose the value area and fall back down to previous value area to continue consolidation there until further notice.
Profit Target/Reverse on EUR/USDOld volume accumulation from April about to be approached at 11463 area. This area should be a natural resistance and a good take profit on buy trades.

XAUUSD LONG AND SHORT Hi Guys,
Weekly VP prints out some important levels, which I have marked on the chart. Each of those levels acts as a support level therefore buyers showing up is expected. Break below 294 and confirmation would result in price further dropping to 272.
Also 316 and levels above it have been marked as resistance and seller showing up is expected.
Make sure add your own logic into this before taking any position.
Be honorable

Nifty (Spot) Range playI expect Nifty to remain in the 24150-23750 range. This is a low-volume area and price will stay here.
Negation levels will be 24250 and 23600.

BTC & Volume Profile Settings⚡️ Explaining the daily levels on BTC as well as my current volume profile settings and why I have them this way
Share with a friend in need 🫡

INTRADAY SHORT CHANCE we expect another impact on gold we expect good an opportunity for short
just we have to follow the instructions
this is not financial advice that was my won analysis of my view any design you take under your own responsibility

The more time passes the more confident i amThe more time moves (i tried to catch the knife when i witnessed the reaction at 217)
i become increasingly more confident on an upmove (at least a gap close).
I wanted to make note that there's a baby head and shoulders bottom in this fractal change and we have bullish divs on RSI.
so it makes increasingly higher probability we will make a full rotation play to value high level (at about 250 usd) and fill the gap.
and i can make a lower timeframe trendline.
infinite money glitch here we GO
check my other posts on TSLA to enjoy my TA and the main idea for higher timeframes!

Technical Analysis of Super Micro Computer Inc (SMCI)Upon analyzing the stock SMCI , we observe a significant turning point starting in 2022, following a long period of sideways movement where the stock struggled to break above the $40 level.
After this prolonged sideways phase, the stock broke out with a clear upward trend, highlighted by the ascending trendline (green), characterized by higher highs and higher lows.
Following a year of gains, the stock entered a consolidation phase but then broke out again to the upside with strength, accompanied by a substantial increase in volume.
After reaching a peak in March 2024, the stock began a downward phase that is still ongoing.
Potential long entry points, where the stock might bounce or change trend direction, are found in the following two support areas:
Support area S1;
The POC 1 area.
If the stock begins to rally again, it will be crucial to monitor its behavior as it approaches the descending trendline (green), which could serve as a more conservative initial target.
More ambitious targets are POC 2 and resistance R1, both within a price range of $900 to $1,000.

Technical Analysis on Intel (INTC)Using long-term volume analysis with the Volume Profile, we observe that Intel's ( INTC ) current price has moved below a significant monthly Point of Control (POC). To gain a clearer perspective, it will be crucial to wait for the monthly close to determine whether the price remains above or below this POC level.
By zooming in to the daily or H4 timeframe, we notice a potential rounding formation in both the candlesticks and volume, indicating a possible shift in trend direction.
Bullish Scenario:
To confirm a bullish scenario, it will be necessary to wait for a monthly close above the POC. This signal will be strengthened if the volumes increase as well.
Bearish Scenario:
If the price stays below the POC, the bearish scenario suggests potential targets, as illustrated in the image below. It may be possible to consider short entries at the levels indicated as Target 2 and Target 3.

SQQQ is rising today LONG
SQQQ trended down the last two days of last week and especially Friday as the technology stocks surged
Yesterday had price consolidation and generally less trading volumes. I believe that
SQQQ will bounce at this level. It is supported by a cross above the POC line of the volume
profile. Under that line is the stop loss while the target is 17.95 at last week's pivot high
The relative volume void above 17.3 suggests that price may have great movement once
getting over that level. A confirmatory MACD line cross sets the reversal .

4015_Possible Trend reversal (Bullish setup)4015
**Bullish Points:**
Price at significant support level (Volume profile) confluence with 78% fib level
Bullish divergence is observed
Small entry can be taken now (Aggressive)
Further entry can be taken after descending channel breakout, or
at next support level 118.6 (DCA strategy)
**Bearish Points:**
Price is moving in downtrend, series of LH/LL
H&S pattern breakdown and retest of neckline
Current stop loss is specified
Trail stop loss if price goes up
Place SL below 118 (DCA strategy)

BTC Shot tearm analisysThe BTC has take the April's 20 POC, and the poc range POC.
The price should'ent going lower and then we can expet a back to 67.000
Wait for a higher low for confirmation.

CORRECTION WITH TREND SETUPafter we miss the chance for long with rejection setup at 4H chart we can see clear chance for short
with trend setup as shown on the chart also we have clear view for distribution level at 30 MIN
chart with dally volume profile so far so good for short
