XRPBTC Possibly The Most Bullish Chart In Crypto!I applied the fixed range volume profile tool to the history of XRPBTC pair on Bittrex on a weekly timeframe. It shows a very well defined clear level of support and resistance formed by the POC.
This has to be the most bullish chart out there. No doubt once XRPBTC breaks out of this zone, it will significantly outperform BTC.
This is a regular scale / nonlogarithmic chart, which I think gives you a better image of what XRP can do once it breaks out of this range.
Volumeprofileindicator

NQ - Volume Profile on Day Chart
Using a composite volume profile and setting the bars to significant lows in the last couple of years, you can see that the VPOCs (Volume Point of Control) are almost perfect.
By using a hollow Composite Volume Profile in conjunction with a Solid Volume Profile, you can spot-check where low and high volume nodes are on different time-scale profiles.
What does all of this mean? Basically, my thesis regarding volume profile, which is shared by some, is that liquidity will be attracted to the low volume profile nodes. Liquidity will find a presence in these depressions, causing prices to gravitate to the local area, filling in the node to build a shelf. This allows for a stronger base or foundation to continue its positive drift upward. However, caution is necessary, as this strategy can work against bulls if the price gets trapped under a substantial shelf, making it harder to climb upward.
Composite Volume Profile indicator below

Fixed Range Volume Profile, How do I use it?I can say that Fixed Range Volume Profile is strong tool to determine targets and stop loss, POC point of control as per my research represent a central price and bar close price is turning around it, so when you assign take profit and stop loss as per it, you reduce the risk and have a plan B to manage your trade.
as you see in above chart for BTCUSD, we have trend line on daily time frame, I cut the chart to 3 successive zones representing 3 cycle, 1 cycle is from the trend to trend and applied "Fixed Range Volume Profile" on all 3 ranges/cycles, last cycle has not finished yet, and I show POC1, POC2 and POC3 prices.
I consider this line as central price for a range and we can see how price keep moving above and down POC1 & POC2 prices.
for the last range/cycle (not completed yet because it has not reach the uptrend line yet, we see POC3 = $30,200 and the current price $29,590 so price is under POC3 and we can guess it is going to trend at approximately $27,750, this is 1st hint.
2nd hint is to take "Fixed Range Volume Profile" for the all uptrend, did you notice it? I think the price is going to POC(all range) = $28,300 (support)
Now we came to the best part of our subject, the what if question and how to set up a plan?:
what is stop loss?
we need a 1H bar close above POC3= $30,200+100= $30,300 (resistant) and we buy target $31,380 (you should know why!) and for stop loss, we need close price 1H again down $30,200
what is take profit?
we can set $28,300 for safe and $27,750 if you want to risk a little bit, this is first target, but what if bar 4h close down POC= $28,300? here we can set a 2nd take profit at $26,400 (you should know why!)
this is what I wanted to share with you and I will be glad to answer your questions.
I did go short for BTCUSD this morning, enter price $29,165 and I set a take profit at $29,322 because I am working on 15 min timeframe.

Can USD/JPY rally through this 300-pip liquidity gap?Divergent monetary policies between the Fed and BOJ have allowed USD/JPY to extend its bullish trend on the daily chart. Whilst the Fed are very close to their terminal rate, they have to keep the threat of further hikes on the table to tame inflation expectations. When coupled with the ultra-easy policies of the BOJ, we've seen USD/JPY return to its cycle highs.
However, the current resistance level around the November high marks the lows of a ~300-pip liquidity gap - and such areas can see prices move swiftly through them if revisited.
Soft US inflation data last November sent USD/JPY aggressively lower on the day, and left the liquidity gap to potentially be filled. The question now is whether bulls can persist and send prices within it, which could see USD/JPY head for the range highs around 145.
Of course, a building threat for bulls to keep in the back of their mind is that Japan's Ministry of Finance or the BOJ could become vocal about yen volatility to spook JPY bears. But until then, we prefer to buy dips on the daily chart or seek bullish continuation patterns on lower timeframes.

NRP ( Energy Stock) Reversal PatternNRP is an energy stock. Shown on a 15-minute chart it appears to have a reversal pattern.
The mass index indicator's value has risen above 27 and is about to trigger with a fall under
26.5. The normalized MACD shows a cross of the MACD and signal line well below the zero line.
The 28 period linear regression line has given a buy signal below the last candle. Importantly,
the analysis of the HA candles is they have changed from red to green and the indecision
candles with large wicks compared with the candle body have ended in favor of a larger
bodied green candle without predominant large wicks. I will look for a long entry on the
3 to 5 minute time frame expectant for a target at the POC line of the volume profile or
about 50 which would be a decent profit for this low risk trade.

BTCUSDT 5th wave downward of an ending diagonalAccording to my wave count, BTCUSDT is finishing an 5th wave expanded in an ending diagonal to complete wave 5 of the actual bearish impulsive wave of this cyclical bear market.

📊 Volume Profile: IndicatorsThere’s a reason why trading volume has been a standard indicator on every piece of charting software over the last 30 years… it provides a crucial edge.
Volume provides you with logical insight into the activity of market participants at varying price levels. Volume analysis helps traders to become more reactionary to price movements rather than trying to predict where price will go next, as is the case with most technical indicators.
📍Key takeaways about volume
Key takeaways about the normal volume indicator plotted on the X-axis in trading:
🔹Volume Indicator: The normal volume indicator measures the total number of shares or contracts traded during a given time period. It is commonly displayed as a histogram or line chart, with the X-axis representing time.
🔹Liquidity: Volume is a crucial metric as it provides insights into the liquidity of a security. Higher volume generally indicates greater market participation and liquidity, making it easier to buy or sell the asset without significantly impacting its price.
🔹Confirmation: Volume can confirm the validity of price movements. In an uptrend, increasing volume supports the bullish move, suggesting strength and conviction among buyers. Conversely, declining volume during an uptrend may signal weakness or lack of interest. The same principles apply to downtrends.
🔹 Breakouts and Reversals: Volume analysis is often used to identify breakouts and potential trend reversals. A significant increase in volume during a breakout suggests a higher probability of a sustained move, while decreasing volume near a support or resistance level might indicate a potential reversal.
🔹Divergence: Volume can reveal divergence between price and market sentiment. For example, if prices are rising but volume is decreasing, it could suggest that the rally is losing steam and a reversal may be imminent. Similarly, increasing volume during a price decline might indicate selling pressure and further downside potential.
🔹Confirmation of Patterns: Volume can provide confirmation or invalidation of chart patterns such as triangles, head and shoulders, or double tops/bottoms. Higher volume during pattern formations enhances their reliability, while low volume can cast doubt on the pattern's significance.
🔹Watch for Extreme Volume: Abnormal spikes in volume can indicate significant market events, such as earnings releases, news announcements, or institutional buying/selling. Unusual volume can lead to increased volatility and potentially offer trading opportunities.
🔹Relative Volume: Comparing current volume to historical average volume helps gauge the significance of the current trading activity. Higher volume relative to the average may imply increased interest, while lower volume might suggest a lack of conviction or reduced market participation.
👤 @AlgoBuddy
📅 Daily Ideas about market update, psychology & indicators
❤️ If you appreciate our work, please like, comment and follow ❤️

📊Volume Profile: Components & Concept📍What is a volume profile?
A Volume Profile is an advanced charting indicator that displays total volume traded at every price level over a user specified time period.
📍Volume Profiles Uses:
🔷 Identify Key Support and Resistance Levels for Setups
🔷 Determine Logical Take Profits and Stop Losses
🔷 Calculate Initial R Multiplier
🔷 Identify Balanced vs Imbalanced Markets
🔷 Determine Strength of Trends
📍Volume Profile Components:
🔹Point of Control (POC): Price level where the most volume traded for the session. Commonly referred to as the POC.
🔹Value Area (VA): Price range in which a user specified percentage volume was traded for a session. Volume profile traditionalist use 70% as it close to 1 standard deviation from the mean. The Point of Control is used as the mean on a volume profile.
🔹Volume Area High(VAH) : This represents the price level at which the highest volume of trades occurred during the analyzed period inside VA. It indicates a significant level of trading activity and is often considered a key resistance level.
🔹Volume Area Low(VAL): Conversely, the Volume Area Low represents the price level with the lowest volume of trades during the analyzed period inside VA. It signifies a level of low trading activity and is typically considered a support level.
👤 @AlgoBuddy
📅 Daily Ideas about market update, psychology & indicators
❤️ If you appreciate our work, please like, comment and follow ❤️

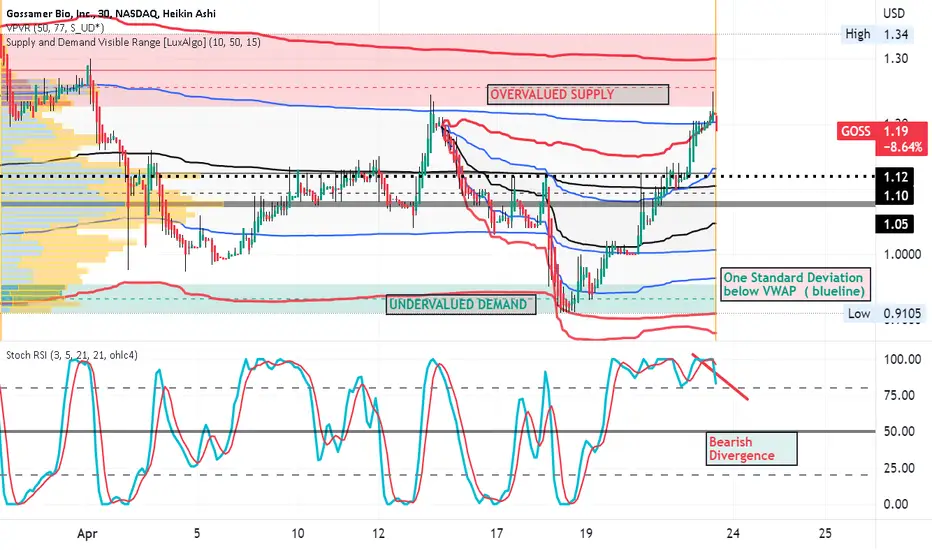
GOSS Penny Biotechology SHORTGOSS is a biotechnology penny stock without earnings valued based on future earnings
potential based on a "pipeline" which is subject to a long timeline of FDA regulation.
On the 30 minute chart. price is shown as being in the overvalued area in the upper VWAP
band and well above the POC line of the long-range volume profile. The RSI indicator is
now showing a bearish divergence as the relative strength is weakening. Price has bounced
down from the resistance of the line representing two standard deviations above VWAP.
The supply / demand zones are indicated by the Indicator applied which is authored by
Luxalgo. Price has hit the supply zone lower border and is now in an early reversal.
I see this as a swing short trade also played with taking put options. Stop loss is
in the upper area of the red supply zone. Targets include first the POC line of the volume
profile and then a final target at one STD below VWAP also being just above the demand zone.
Alternatively put options at the strike of $ 1.50 for the May monthly expiration of 5/18
This trade will benefit from any expected pullback in the general markets.
ES1 Price Action pending reactionPrice action tends to interact with AVWAP in confluence to the pending retest @ resistance. Fisher Transform oscillator on H4 suggesting the trajectory in time. An extensive wave inner impulsive bearish wave (iii) expected till local demand.

Bitcoin - Upcoming rejection from the 2021 Yearly POC?(The Volume Profiles Yearly POC is an important level for Bitcoin trading that you should look into .)
Bitcoin made a nice upwards move after successfully retesting the Yearly POC from 2022.
Our indicators are not heavily overbought yet so there's still room for some more upwards price action .
If Bitcoin manages to take out the high at 32.5k this would trigger a lot of stop losses , which is why I think there's a high probability that we're going to see BTC take out this level.
After this high a possible price point where Bitcoin then might get rejected is the 2021 Yearly POC .
Make sure to do your own research, this is no trading advice.
Forecasts and forward-looking statements always involve risks and uncertainties.

📊The Effects of Volume Cheatsheet📍 In trading, volume refers to the number of shares or contracts that are traded within a specific period of time. It is a key technical indicator used by traders and investors to analyze the strength and direction of price movements in the financial markets.
The volume of a security can be used to confirm trends, indicate potential reversals, and identify areas of support and resistance. For example, a sudden increase in trading volume for a particular stock may suggest that a significant news event has occurred or that there is an increase in investor interest. On the other hand, a decrease in volume may indicate that investors are losing interest or that a trend is weakening.
Volume is important in trading because it provides information about market activity and helps traders make informed decisions. By analyzing trading volume along with other technical indicators such as moving averages and price patterns, traders can gain insights into market trends and make more accurate predictions about future price movements.
💥Key Takeaway:
When prices are rising or falling with high volume , it suggests that there is strong participation in the market and that the price movement is likely to continue in that direction . Conversely, when prices are rising or falling with low volume, it may indicate that there is not enough market participation to sustain the price movement and that a reversal could occur.
👤 @AlgoBuddy
📅 Daily Ideas about market update, psychology & indicators
❤️ If you appreciate our work, please like, comment and follow ❤️

LIVE I QUICK NFP SCALPMake some quick money. in and out in a short amount of time. Good Friday has the market moving randomly

UNFIUSDT Possible bounce from an interest zone We are waiting for the price to return to the zone of strong market buyer profile. The zone will be protected at all costs. We only consider the first approach to the zone with a sharp rebound as a reaction. Open a long position from the target range of 4.628 - 5.0.

Harley is having a spring sale HOG LONG ?The chart shows HOG to have reversed above its intermediate-term support.
Price is just below the near-term POC line of the volume profile and 30 % below
the intermediate-term POC line where increased volatility could result in
a rejection bounce or alternatively a push higher into the low-volume area
above.
The zero-lag MACD shows the lines crossed under the histogram and crossed
over the zero line.
The Bolliger Bands indicator shows a buy signal with a price near to the lower
band.
Overall, this is a good place to take a long swing trade of stock or even
a call option of 4 weeks duration mindful that it might be strategic
to "ride" the anticipation of earnings on April 25th but close out the option contract
or stock position a few days before the earnings report.
For the stock trade, stop loss and target are drawn onto the chart.

$ES - Key levels - Beautify demonstration of trapped shortsFollowing up on my idea yesterday
Look at that~! Set up was BEAUTIFUL yesterday with shorts and bears over extended. And where do they find liquidity after the highs are broken? Nowhere but above 4011.

AUDUSD: Bearish signal below 0.6680AUDUSD pair successfully broke below the wedge pattern as I mentioned in the previous analysis. However, it seems that more liquidity is needed to support the downward movement. It's likely that the price will undergo a corrective movement towards the level of 0.6680, which is a very important level where the broken trendline, Fibonacci level 23.60, and the moving averages 50 and 100 on the 4-hour timeframe converge. Additionally, the point of control (POC) is also located at that level, as shown on the volume profile indicator. Any sign of reversal from this level will be considered a bearish signal towards 0.65970.
-------------------------------------------------------------------------
Let me know your thoughts in the comments, and show your support by liking the idea.
Please follow if you're interested in more ideas like this.
Your support is greatly appreciated!

Key levels for BTC - Big moves comingBTC has been consolidating this whole week, brewing for a big move. Looking at daily volume profiles.
26700 - 26800 level is key support, already bounced off twice
- if broken we likely see a bear run possibly down to 25000 level
Or we continue the Bullish trend started 2 weeks ago and heads toward 30000 level. Watch for break of recent highs.
Any thoughts?


Swing XAUUSD timeframes 1D As we can see 2 green candles has closed in valuable range. I prefer long for XAU now. 🟢🟢🟢
XAU/USD is currently trading at $1,830, which is just below the key resistance level of $1,874. However, the overall trend for gold is bullish, and there is a potential for a meeting at the resistance level. In addition, there is support at the $1,800 level, which could limit downside risk for traders in a long position. This suggests that there is potential for the price to break out above the resistance level, which could be favorable for traders in a long position
Entry: 1830
TP1: 1875
TP2: 1905
SL: 1800
Let see how it goes :) Happy trading guys!

Swing BTC daily 🟢🟢🟢Long position on Bitcoin was initiated between the price range of 20600 and 21600 with TP: 22150 or 23000. The trade has a SL set at 20150 to limit potential losses. It remains to be seen whether the price of Bitcoin will rise to the target levels or fall to trigger the SL.
SL: 20150
TP1: 22150
TP2: 23000
EN: 20600-21600
Happy trading guys! TraderB :)

BTC Support and ResistanceRecently I added VRVP (Volume Profile Visible Range) into my Support and Resistance BTC chart. Something I found interesting in this was the Point of Control (POC)
Previous cycle ATH is the most active price point for trading engagement. This provides me a fundamental insight that there were a lot of investors/trades were expecting retest of previous ATH. This is a common theory in technical analysis.
In addition it reflects that we are in an accumulation period for bitcoin. The big blue box shows my interpretation on accumulation zone.
VRVP (Volume Profile Visible Range): Reflects the amount of volume traded at certain price points. Generally most effective when trading larger-cap crypto assets.
POC (Point of Control) : is the node with the highest volume profile, and appears as the longest bar. This can be used as an important retest point or to calculate potential support and resistance. Orange Dash Line.
If you like this idea, please feel free to share some love. Also I welcome any and every sort of comments and criticisms as it helps me to improve my analysis.
If you are from Sri Lanka Please feel free to check out our local communities encouraging responsible investment cryptocurrencies.
Learn! Invest! Earn!

SWING EUR/USD 1D timeframe 💶The two specific levels mentioned are 1.03462 and 0.98358, which are referred to as support zones. These levels are important because they represent areas where there is significant demand for the currency pair.
🔴🔴🔴
In this scenario, My trade is entering a short position on the EUR/USD currency pair with an entry point of 1.06197 and a stop loss at 1.07967.
This means that I'm betting that the value of the EUR/USD will decrease.
Happy trading guys :) B
