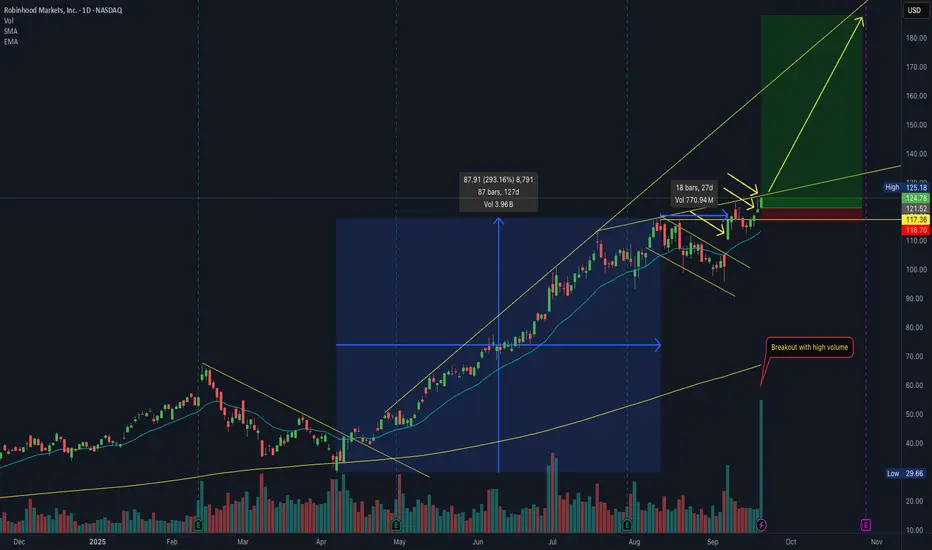
Potential Buy Setup – $HOOD Breakout on High VolumeKey points:
• Growth of 293% in the previous 4 months
• Consolidation phase of nearly 1 month after the growth, with low volume and respecting the EMA21
• Beginning of a flag breakout with average volume surging more than 50%
• Continuation breakout above the previous high with another volume surge
-------------
Dear friends,
I trade the markets using a structured, multi-stage strategy that combines technical analysis, price action, and market psychology. My approach includes key concepts such as candlestick patterns, trendlines, support & resistance, Elliott Wave theory, and price channels. I also integrate strategies from O’Neil’s CANSLIM, Minervini’s SEPA, Oliver Kell’s momentum trading, and Qullamaggie’s breakout setups.
Good luck!
Volume
Sellers in Control AfterEUR/USD hit a major resistance zone between 1.18500 – 1.19000, which aligns with the Monthly Volume Profile resistance area. Price has rejected this zone with lower highs and decreasing volume — a classic bearish signal.
This setup suggests that a Wave 4 correction may be underway, with potential to target 1.15500 and even 1.14500 if selling pressure accelerates.
Disclaimer: This analysis is for educational purposes only and does not constitute financial advice. Always conduct your own research and manage your risk appropriately.

Super Bear on NQ for week 22/10 - 03/11 2025This week will show if the bears are gonna step in! A lot of positivity in the markets due to rate cuts but I'm not buying it. Sell the news will be on. Predicting NQ back to 24000 till end of the month. Bearish setup only for the rest of the month.
Always remember, Caution, Patience and Risk!
GL!
If you like the content give me a follow on X!
Check Bio. Cheers!

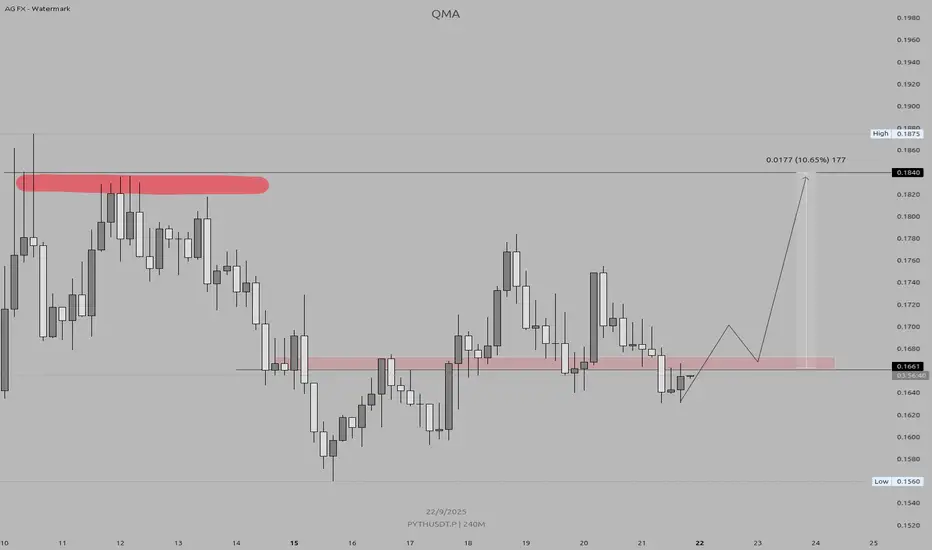
PYTH/USDT – Bullish Re-Test SetupKey Level: 0.167 (Previous Support → Now Resistance)
Target: 0.18 – 0.185
Timeframe: 4H (240M)
✅ Trade Conditions:
Price must reclaim and close above 0.167 on the 4-hour candle.
This confirms bullish strength and breaks the previous downtrend.
🎯 Action:
Enter on close above 0.167
Stop Loss: Below 0.160 (support breakdown)
Take Profit: 0.18 → 0.185
💡 Why?
The zone around 0.167 was strong support earlier. If bulls reclaim it with a strong close, it signals momentum shift. The path of least resistance is now toward 0.18, where prior resistance lies.
🔥 Watch for confirmation — no fakeouts. Only trade if the 4H candle closes cleanly above 0.167.
#PYTH #CryptoTrading #DayTrading #Breakout #TradingView
EURUSD: 1.19 Hit — Sellers Step In?Hi traders and investors!
This analysis is based on the Initiative Analysis concept (IA).
Buy patterns formed in the 1.1835–1.1830 zone, and then price reached 1.1900, as anticipated in the previous review. Got lucky on this one (see previous post).
Let’s take a closer look—this is an interesting setup.
Weekly chart
The last three buyer bars showed elevated volume but no result — the closes are inside the wicks.
Daily chart
The buyer broke above the initiative’s upper boundary at 1.18299 with a wide-spread, high-volume candle, but the seller pushed price back below 1.18299 and engulfed the buyer’s candle.
A sideways range is likely forming; a seller initiative is projected with a target at 1.15278.
There’s a sell signal on the chart — very interesting.
The Dollar Index, by the way, is turning in a mirror image.
Wishing you profitable trades!

XAUUSD – Gold Analysis & Trading Plan (Sep 21, 2025)1️⃣ Main Trend (H1)
- The short-term downtrend on H1 has been broken after the trendline was breached.
- Price is currently moving strongly toward the PW VAH zone at 3680–3685, confirming a bullish retracement.
- Overall: Gold remains in a larger uptrend, but at this stage it is experiencing a recovery pullback after the decline from 3700.
2️⃣ Key Price Zones
Near Resistance:
- 3680–3685 (PW VAH + previous supply zone).
- 3700 (previous top, strong resistance).
Key Support:
- 3640–3643 (PW POC – balance area & demand zone).
- 3634 (PW VAL – last weekly support).
3️⃣ Price Action
- After rebounding from 3640, price surged and broke the H1 downtrend line.
- Currently, it is approaching the VAH 3680–3685, an area where selling pressure has frequently emerged in previous moves.
- Buyers are in control, but the 3680–3700 zone may trigger profit-taking and spark new selling momentum.
4️⃣ Candlestick Patterns
- Strong bullish H1 candles with long bodies confirm clear buying pressure.
- The most recent candle touched VAH and left an upper wick → signal of supply pressure beginning to emerge.
- Further observation needed: if a bearish pin bar/engulfing forms in 3680–3700, the probability of a short-term reversal increases.
5️⃣ Trading Plan
* Scenario 1 – BUY at Support (priority setup)
- Entry: 3640–3643 (PW POC) if price retraces.
- Target: 3660 → 3680.
* Scenario 2 – SELL at Resistance (less priority)
- Entry: 3680–3685 or 3698–3700 if a bearish candlestick reversal forms.
- Target: 3660 → 3640.
* Scenario 3 – Breakout BUY (only if 3700 is broken)
- Entry: Buy once H1 closes above 3700 with strong volume.
- Target: 3715 → 3730.
🔓 Conclusion: In the short term, the recovery uptrend is dominating. However, 3680–3700 is a strong resistance zone.
- Priority: Buy at support or upon a successful breakout above 3700.
- Sell: Only when a clear reversal signal appears at resistance.

USD/JPY - Fake Breakout. Is price Distributing💹 USD/JPY – 4H Forecast
Weekly Structure:
Price is still holding strong above demand, with 151.0 acting as the big liquidity magnet.
Daily Structure:
We’ve been stuck in a wide consolidation range between 146.0 support and 150.9 resistance. Market keeps faking both sides, but bulls are slowly regaining control.
4H Structure:
Recent fake breakout/manipulation flushed stops before shifting bullish.
Imbalances (Daily + Weekly) got filled on the push up.
Price is now respecting the bullish structure, eyeing a move higher.
Buy Zone 1 (Preferred): 146.7 – 147.0
Buy Zone 2 (Needs confirmation): 146.1 – 146.2
Upside liquidity target sits around 150.9 – 151.0 BSL.
🔍 Outlook
Short-term: Pullback into demand zones.
Mid-term: Bullish continuation → eyes on 150.9 – 151.0.
Bias : Short-term retrace → Mid-term bullish.

Simple Trade Plan on Small Cap StrengthConfirmed, BU/LPS in Play
Another promising small cap chart showing strong technical alignment. After a healthy pullback, price has now printed a significant Higher Low (HL) right at the confluence of two major 50% retracement levels (macro and local). This zone has historically acted as a magnet for liquidity and trend continuation.
Adding to the bullish case:
We've seen a Jump Across the Creek (JAC), signaling strength
Followed by a clean Back Up / Last Point of Supply (BU/LPS), confirming the retest and potential for markup
Trade Strategy
Simple Execution Plan:
Entry: Current levels offer a solid entry opportunity
Stop Loss: Just below the BU/LPS zone. If price breaks below, reassess as this could signal a failed breakout or fakeout
Take Profit: Initial TP just below the R2 yearly pivot
Trend Management: Potential Trail stop loss beneath each new swing low to stay aligned with trend structure and maximize upside

High-Risk, High-Reward Play with Dual Entry StrategyAs always with nanocap stocks, extreme caution and disciplined risk management are essential. That said, the chart structure for AQD is showing promising signs of continuation, and there are a couple of strategic ways to approach this setup:
Conservative Entry Strategy
Trigger: Entry only if price breaks above the recent high at $0.068
Stop Loss: To be placed at the newly formed structural low once confirmed
Take Profit: Initial target would be the range high; depending on market structure, a more ambitious target could be the supply structure equilibrium zone near $0.315
Staggered Entry Strategy
Price has pulled back into a key area of interest, aligning with:
Range tops
A major 50% Fibonacci retracement from the swing high of $0.65 to the low of $0.005
Low Volume Node region
If the pullback continues:
Watch for price to find support within the Fair Value Gap (FVG), especially around the equilibrium zone
A well-formed doji or bullish hammer candle in this region would offer a fantastic opportunity to scale into the position.
If price doesn't pullback into the FVG then you are already positioned and can add to the winning position when $0.068 top is broken and trail stop loss at the new SL
Until a clear structural low is formed, the provisional stop loss must be placed at $0.007 therefore highlighting the importance of proper risk management.

Triângulo Simétrico ETHWait for breakout with volume to define strategy. Recommended trigger: Return test on one of the lines (HTL or BTL). Pivot below MM21 with Fibonacci projection.

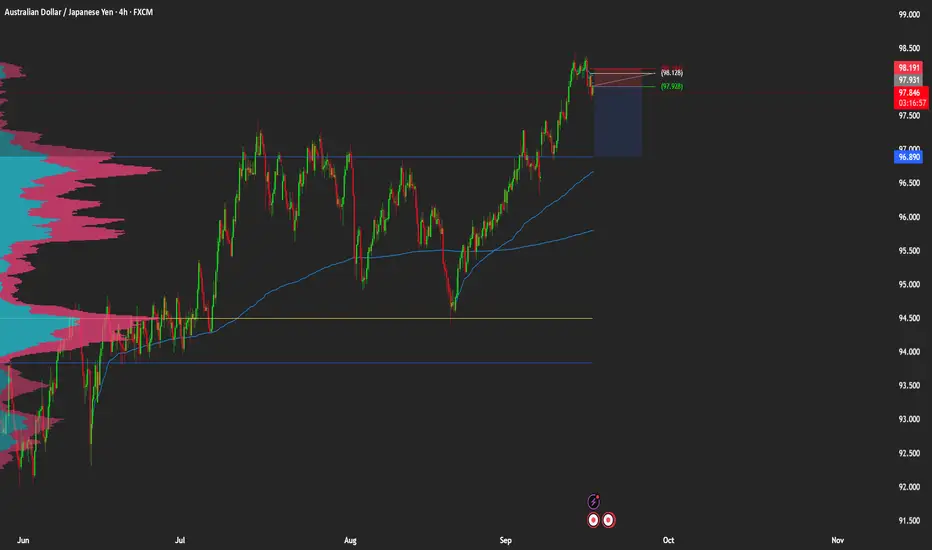
AUDJPY Bullish setup with volume profileHello!
We have here an interesting setup in AUDJPY 4H chart.
If you can see, after placing the volume profile in the trending leg, the poc aligns with a previous resistance zone.
If price arrives here, there is a good chance for it to turn pullback.
Quick 1:1.
Trade at your own risk

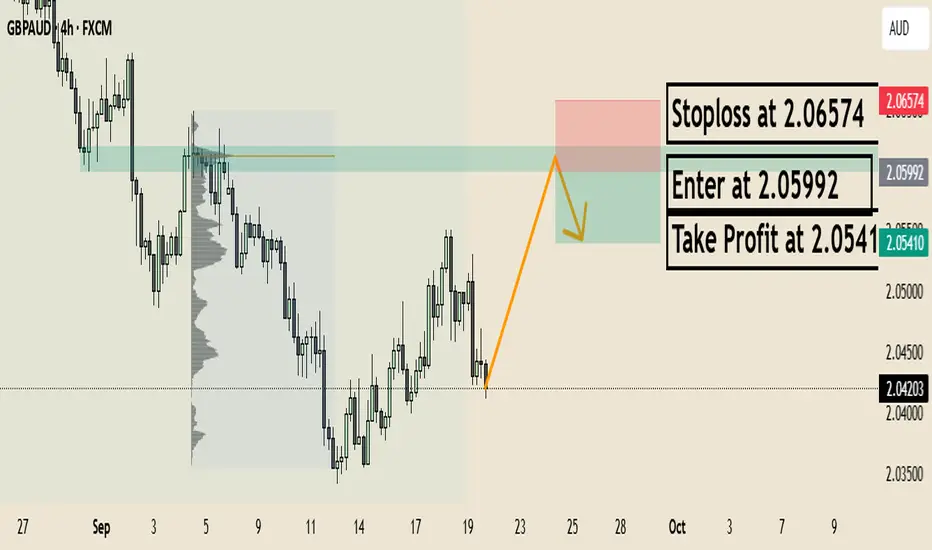
GBPAUD Bearish setup using Volume ProfileHello!
In this particulary 4H chart you can see that on the trending leg, a good volume cluster matches the previous swing point.
Also if we take the zone around the POC, you can clearly see that it was a prvious support ad then a resistance. I will wait for the price to go there and then take a quick 1:1.
Trading at your own risk!
Short Idea On AUDJPYBased on :
- Supply zone and weekly avwap as entry level
- VP target 4rr
- Cot Analysis
- Quantitative Analysis
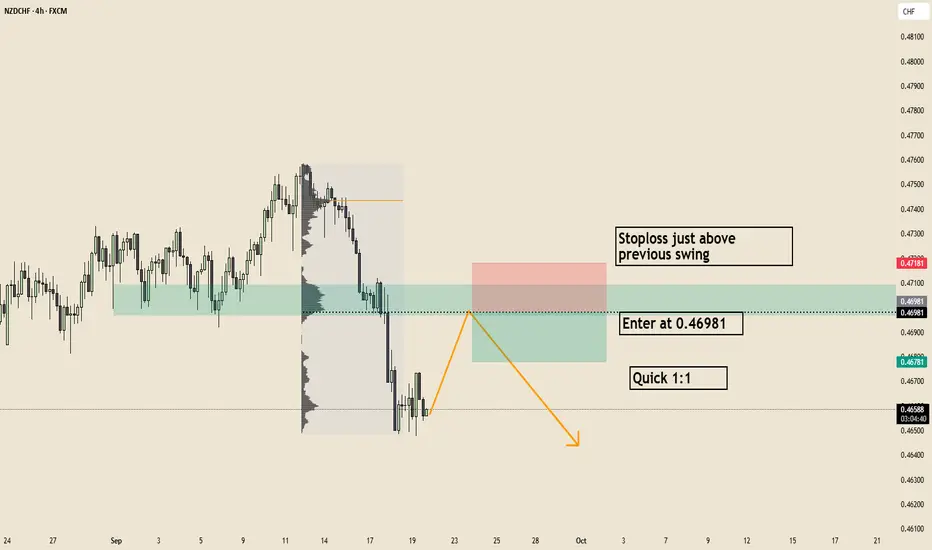
NZDCHF Bearish setup based on Volume ProfileIf we align the volume profile with this trending leg we can see that a good value area aligns with previous support.
This can indicate that a possible reversal can occur there!
Since the main POC of the volume profile is on the top, I will just enter at the bottom of the zone.
A quick 1:1 but you can do what you prefer.
AUDCAD Bullish setup based on Volume ProfileIn this chart we have a very interesting setup.
In this trending leg, we can see that the volume profile aligns with previous resistance.
My plan is to enter at the POC of the volume profile and then just exit at a 1:1.

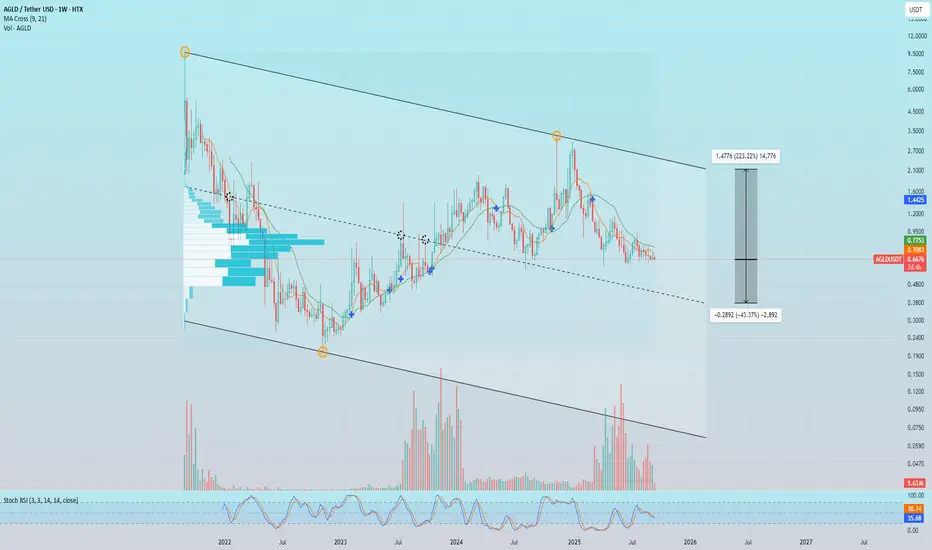
AGLD. The Next Chapter.global chart structure is neutral with high amplitude in both directions, there is some empirical priority down simply because eco is in the development stage and it looks like they are building L3 for GameFi
the core value was established in '21 as NFT project
XAUUSD – Gold Analysis & Trading Plan (Sep 19, 2025)1️⃣ Main Trend
- On the H1 timeframe, the short-term downtrend remains dominant.
- Price continues to form lower highs and lower lows.
- The H1 trendline is currently acting as a dynamic resistance and has not yet been broken.
2️⃣ Potential Price Zones
- Nearby resistance: 3660–3665 (H1 trendline).
- Strong resistance: 3681 (CW VAH).
- Key support: 3640–3643 (CW POC + previous demand zone).
- Final support: 3633 (CW VAL).
3️⃣Price Behavior
- After being rejected at 3700, price dropped sharply, breaking through the balance zone 3660–3659.
- Currently, price is hovering around the POC 3641, indicating the market is testing supply and demand.
- Buyers are expected to step in around 3640–3643, but the main trend is still bearish → confirmation signals are required.
4️⃣ Candle Patterns
- At the 3640–3643 zone: watch for rejection candles such as a pin bar or bullish engulfing → confirmation of buying pressure.
- At the 3660–3665 zone: if rejection candles appear (shooting star, bearish engulfing) → signal to sell in line with the trend.
5️⃣ Trading Plan
*Priority Scenario 1 – Buy on pullback
- Entry: 3640–3643.
- Target: 3660 → 3680
*Scenario 2 – Sell with the trend
- Entry: 3659-3662 (H1 trendline).
- Target Profit: back to 3640.
*Alternative Scenario – Breakout
- If 3633 (VAL) is broken, the decline may extend toward 3615–3620.
- If 3681 (VAH) is broken to the upside, the uptrend may resume, targeting 3700+.
🧩 In summary: the main trend remains bearish on H1, but the 3640–3643 zone is an important balance point to watch for price reaction.
👉 If you find this analysis useful, don’t forget to hit like 👍 and drop a comment 💬 to support us in delivering even better insights!

MU hitting $200?Micron technology could be hitting $200 due to an uptrend and a upcomign earnings date. Higher highs, higher lows, which indicates a strong bullish uptrend, and the breakout from 130 followed by a massive volume is also indicating a bullish uptrend. The price is ridign the upper bollinger band, indicating strong momentum.

Side way Breaks to new all time high Hello Traders,
i can see big volume compared to the monthly trading at the ending of side way markets which will lead for a continuation for the bullish trend targets is already mentioned and it depends what you are investing for short intermediate long if we break the discount area we well go for big correction advice to sell with the retest however if we breaks the discount area huge profits coming. if you like the idea kindly show your support for more ideas to come good day.

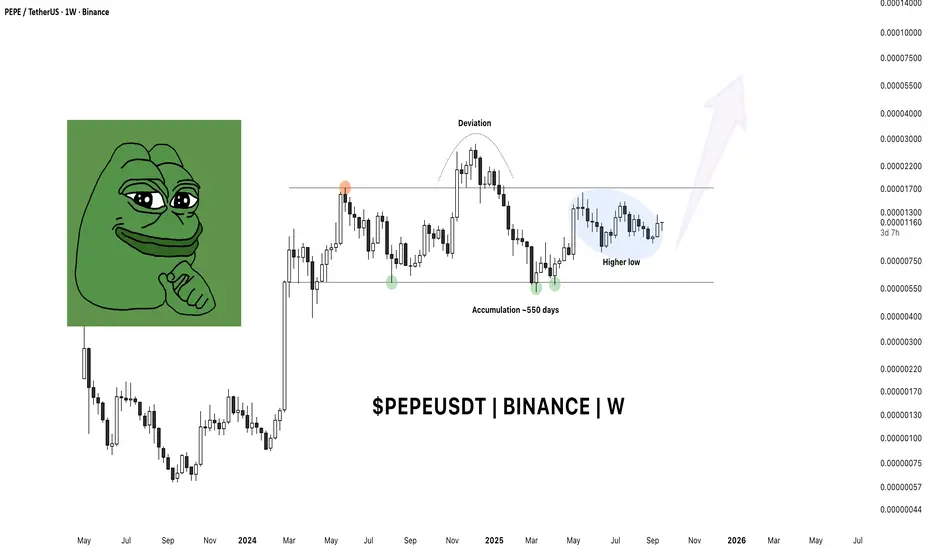
Pepe Setting Up for the Next Leg?Pepe has been quietly coiling for over 500 days — a period of balance that has shaken out weak hands and built a solid base. The market structure is now leaning bullish, and there’s a decent chance that BINANCE:PEPEUSDT is on the verge of an exponential move.
Let’s break it down!
🔎 Highlights
⦿ Range Structure:
Price has been locked inside a long-term range with clearly defined highs and lows. Sellers have repeatedly failed to push it below range support — a sign of underlying strength .
⦿ Post-Impulse Behavior:
The May rally created a wide candle range. Since then, price has slowly bled lower but never broke the May low. Instead, it has been oscillating within that candle’s range (consolidation after an impulse).
⦿ Volume & Value:
Currently trading above inception AVWAP and POC , both strong support references.
Price is pressing near the Value Area High (VAH).
Importantly, the zone between VAH and Range High shows thin volume development . If buyers push through VAH, there’s very little resistance until and above the Range High — meaning price could accelerate quickly.
⦿ Macro Context:
With alt season heating up, speculative capital tends to chase high-beta altcoins . Pepe has both the liquidity and narrative to be a frontrunner.
🟢 Bullish Scenario
Acceptance above VAH → swift test of Range High → successful flip into support → potential for new range formation at higher levels.
This would confirm a breakout and likely trigger momentum traders to pile in.
🔴 Bearish Scenario
Failure to reclaim VAH and a rejection at current levels could drag price back into the middle of the range. A breakdown below Range Low would invalidate the bullish thesis, but so far, buyers have defended that zone consistently.
📈 Outlook
The structure suggests imminent expansion. Given the thin value zone overhead and market-wide tailwinds, Pepe could be one of the top gainers in the coming alt cycle.
👉 Will BINANCE:PEPEUSDT accept above VAH and rip through the range high, or does it need another deeper pullback before the breakout?
——————x——————x——————x——————x——————x——————x——————
⚠️ Disclaimer: Crypto products, NFTs, Memecoins are unregulated and can be highly risky. There may be NO regulatory recourse for any losses arising from such transactions.
This content is for educational and informational purposes only and does NOT constitute financial, investment, tax, or legal advice. Cryptocurrencies are highly volatile and speculative — you may lose part or ALL of your investment. I am NOT liable for your losses.
Please do NOT copy my trades. Always consult YOUR financial advisor before making any investment or trading decisions. Or at the very least, consult your cat. 🐱
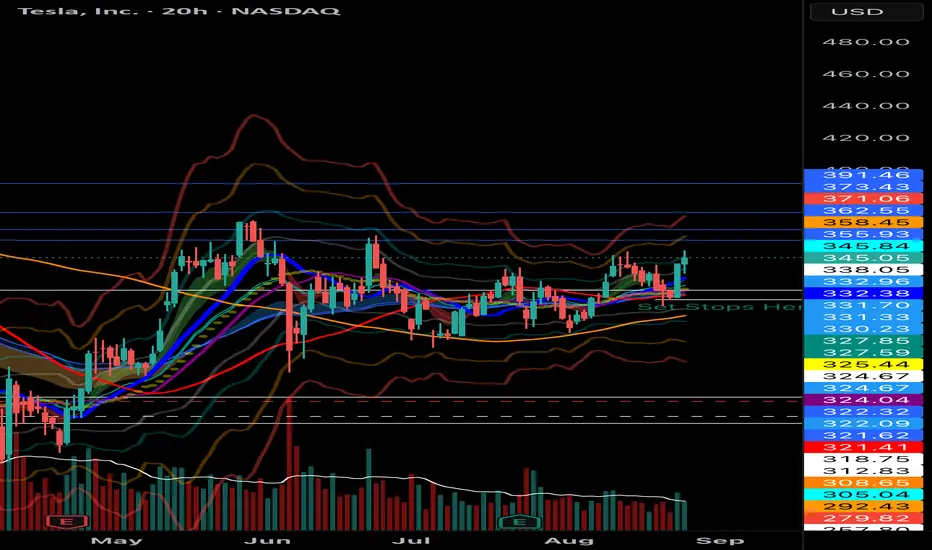
TSLA Volatility Contraction Pattern (VCP) LONG When TSLA breaks above 350 and closes, the price will launch to $390 very quickly.
A VCP is a technical pattern, showing lessening declines in a range bound formation. A bull flag showing higher-lows is the best, as seen with TSLA.
Volatility is going to breakout sharply to the upside. If you TSLA above 350 just buy and hold, you’re too late trying to get a better deal.
🚀🚀🚀🌖
OKLO — when nuclear momentum breaks resistanceSince late 2024, OKLO had been consolidating inside a clear rectangle between $17 and $59. The breakout from this long-term range triggered a new bullish impulse. The price has since returned to retest the breakout zone, now aligned with the 0.618 Fibonacci retracement at $51.94. The retest has completed, and the price is bouncing upward, confirming buyer interest.
Technically, the trend remains firmly bullish. The price closed above the prior range, EMAs are aligned below, and the volume spike during breakout supports genuine demand. The volume profile shows a clean path toward $100, indicating limited resistance ahead. The structure suggests a controlled rally rather than an exhausted move.
Fundamentally, OKLO is a next-generation SMR (Small Modular Reactor) company focused on delivering compact, efficient nuclear power solutions. Following its public debut via SPAC and recent capital injection, OKLO is transitioning from development to implementation. Institutional interest is holding strong, and the broader move toward decarbonization and energy independence places the company in a strategic position.
Target levels:
— First target: $100 — psychological and technical resistance
— Second target: $143 — projected from prior range breakout
OKLO isn’t just another clean energy ticker — it’s a quiet disruptor with nuclear potential. The chart broke out. The volume confirmed. Now it’s time to see if the market follows through.

XAUUSD – Gold Analysis & Trading Plan (Sep 18, 2025)1️⃣ Main Trend
- After a strong rally to 3,700 (VAH), gold was rejected and turned lower.
- Currently, price is moving below POC 3,681 and testing the VAL 3,659 zone.
- The short-term trend leans bearish, while the overall structure remains in a corrective range after the prior bullish impulse.
2️⃣ Key Price Zones
Resistance:
- 3,681 (Weekly POC – key distribution level).
- 3,700 (VAH + previous high, strong resistance).
- 3,659 (CW VAL, weak resistance)
Support:
- 3,659 (VAL – lower balance area).
- 3,640 (short-term support).
- 3,620 (major support, confluence with previous lows).
3️⃣ Price Action
- Strong rejection at 3,700, followed by a sharp drop to 3,659.
- After breaking below POC 3,681, sellers are now in control.
- Pullbacks toward resistance are mostly technical retracements and lack signs of bullish reversal.
4️⃣ Candlestick Patterns
- A bearish pin bar formed at 3,700, showing strong selling absorption at resistance.
- Subsequent candles closed consistently below 3,681, confirming bearish control.
- At 3,659, a small rejection wick has appeared, but it is not strong enough to signal a reversal.
5️⃣ Trading Plan
1️⃣ Sell Zone 1: 3,681–3,685 (POC Retest)
- Priority: SELL on a pullback to this zone.
-Target: 3,659 → 3,640.
2️⃣ Sell Zone 2: 3,698–3,700 (VAH)
- Strong resistance; SELL if a bearish candle confirmation appears.
- Target: 3,681 → 3,659 → 3,640.
3️⃣ Buy Scenario (lower priority):
- Consider BUY only around 3,640–3,642 if a bullish confirmation candle forms.
- Target: 3,659.
🧩 Conclusion:
In the short term, the bias favors SELL setups at resistance.
BUY is only a counter-trend strategy and requires clear candlestick confirmation.
👉 If you find this analysis useful, don’t forget to hit like 👍 and drop a comment 💬 to support us in delivering even better insights!
