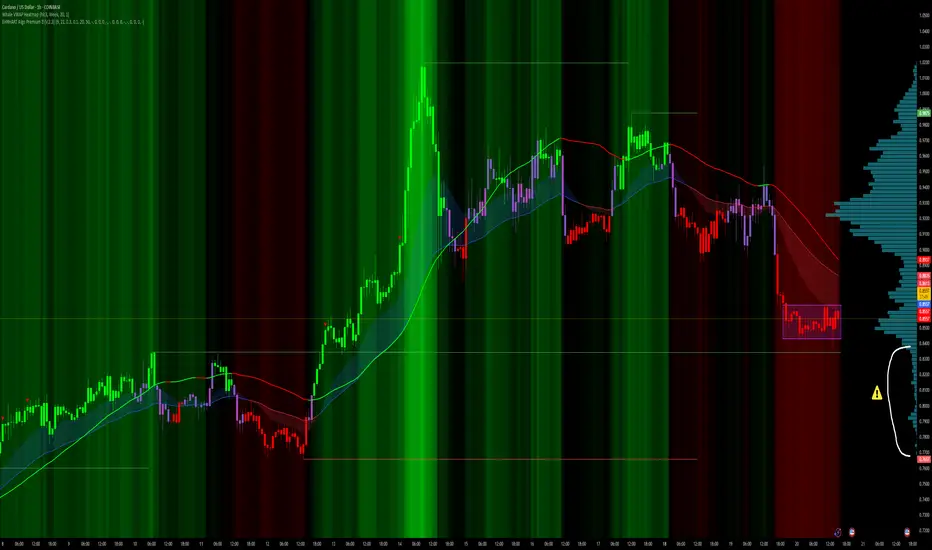
EUR/USD 1.1611: Strong Support Backed by Volume Profile & FVGEUR/USD has a key support at 1.1611, formed after Powell’s speech triggered aggressive buying.
Volume Profile shows a strong volume cluster at this level, where buyers accumulated long positions.If price pulls back, those buyers are likely to defend the zone and push the market higher. A Fair Value Gap also aligns at 1.1611, making this level even more significant for a long setup.
Volume

BOMBAY DYEINGbombay dyeing cmp 179.5 weekly HH and now its making cup and handle pettern add upto 172-165 range keep sl 160 tgt could be 195 215-220 240++

BTCUSDT. When will the buyer appear?Hi traders and investors!
Went exactly by the March 3 scenario.
Who would’ve guessed… and why didn’t anyone warn me?
Weekly candle with declining volume.
No strong buyer at the bottom of the trading range — no reason to go long.
The price will keep pushing lower and lower until it finally meets a strong buyer.
Wishing you profitable trades!

Phased Accumulation on Soybeans; Inverted Head And Shoulders forSoybeans is showing signs of accumulation with volume contraction during price declines and expansion during rallies on the daily range.
The Head And Shoulders pattern on the daily timeframe features a more 'complex' inverted type, featuring a left shoulder, double head and right shoulder. However, volume patterns remain consistent with the typical and ideal inverted head and shoulders formation, with volume diminishing in trade on the left shoulder, with slight expansion on the rally to create the valley, and further diminishing volume on the creation of the head, and the proceding right shoulder with volume and price showing signs of activity during the early stages of the rally indicating, genuine activity.
Eyes are now set on the break of the neckline, for price to contiune higher for a new profound bull market.

GOLD 4 YEAR CYCLEFibonacci Time Zones are a technical analysis tool, depicted as vertical lines on a chart, used by traders to identify potential market reversals based on intervals derived from the Fibonacci sequence. To use them, traders pick a significant high or low point, then plot vertical lines at time intervals corresponding to Fibonacci numbers (1, 2, 3, 5, 8, etc.), with the expectation that major price movements or trend changes may occur at these lines.
How to Use Fibonacci Time Zones
1. Identify a Trend: Find a clear trend, either an uptrend or a downtrend, on your chosen financial asset's price chart.
2. Mark a Starting Point: Select a significant swing high or swing low within that trend as your starting point.
3. Plot the Time Zones: On your chart, draw a series of vertical lines extending to the right from your starting point.
4. Interpret the Zones: The intervals between these lines represent periods based on the Fibonacci sequence (1, 2, 3, 5, 8, 13, etc.). The goal is to look for potential price reversals, significant movements, or trend changes near these vertical lines.
Key Considerations
Focus on Time: Unlike Fibonacci retracement levels, which focus on price levels, Fibonacci Time Zones are solely focused on the timing of potential market changes.
Ignore Early Zones: The initial zones can be clustered very close together, so traders often suggest ignoring the first few zones and focusing on later, more spread-out zones.
Combine with Other Indicators: To confirm signals, you can use Fibonacci Time Zones in conjunction with other technical indicators for entry and exit points.

NAS100USD Analysis – POC Magnet, Demand Zone🔎 Context
Price action on NAS100USD is currently trading within a clearly defined range between the Value Area High (VAH) and Value Area Low (VAL) . Volume Profile highlights a key Point of Control (POC) around 23150 – the price level where the highest amount of trading volume has accumulated in this range.
In Smart Money terms, we also have a refined demand zone forming below, with the proximal line aligning closely above the POC. This overlap strengthens the case for the POC acting as a "magnet" and a potential support base.
⚡ Key Levels
Value Area High (VAH) : ~23880 – range resistance.
Value Area Low (VAL) : ~23010 – range support.
POC : ~23150 – high-volume node, magnetic level.
Proximal Line : Sitting just above POC, marking the edge of demand.
Refined Demand Zone : 22950 – 23050 region.
🏗 Structural Insights
A major structural failure occurred earlier near 23880, confirming supply above.
Price swept liquidity below 23050 before aggressively reclaiming the range.
Current trading sits just above POC and proximal, showing buyers defending.
A break and acceptance above 23510 (mid-range) opens the path back to VAH at 23880.
✅ Trade Scenarios
Bullish Case (Continuation to VAH)
If price sustains above 23516 and holds above the proximal/POC cluster, we can expect a continuation toward VAH (23880).
Targets: 23880 (VAH) → potential extension toward swing high.
Bearish Case (POC Magnet + Demand Retest)
Failure to hold above proximal/POC may drag price back into the POC magnet zone at 23150.
If momentum weakens further, a retest of the refined demand zone (22950 – 23050) is likely.
Below VAL (23010), imbalance could drive a deeper correction.
📌 Conclusion
The confluence of POC (fair value) and proximal demand (structural support) makes 23150 a pivotal level. Holding above it favors a continuation toward 23880 VAH , while a rejection would likely see price revert back to demand.
This setup showcases how Volume Profile levels (POC/VAH/VAL) can be combined with SMC concepts (demand zones & structural breaks) to create a high-probability framework.
💡 Trade safe, manage risk, and always wait for confirmations around these key levels before execution.

DXY: False Breakout, Targets BelowHi traders and investors!
This analysis is based on the Initiative Analysis concept (IA).
On the daily timeframe, the Dollar Index is in a sideways range. Upper boundary 98.959, lower boundary 95.906.
We see a familiar false breakout pattern of the upper boundary of the range. The price then returned back into the range with a seller IKC candle (the highest-volume candle within the initiative).
During this false breakout, the price moved above the 50% level of the last seller initiative on the weekly timeframe, which strengthens the pattern.
I am waiting for the first target at 96.66 and the second target at 95.90.
As a reminder, my broader expectation is a move toward 94.6. Indirectly, the likelihood of continued decline in the Dollar Index is supported by the fact that the sideways range has expanded more to the downside than to the upside.
Wishing you profitable trades!

AUD/USD – Possible Bullish Reversal with Volume Profile
The Australian Dollar (AUD/USD) has been consolidating after a strong bearish move. Looking at the Volume Profile (VPVR) , we can see:
🔹 High-Volume Node near 0.6480 – this acts as a strong magnet for price.
🔹 Price Base Formation – market has been ranging, showing signs of accumulation.
🔹 If buyers step in, we could see a move towards 0.6480–0.6500 zone , where liquidity is clustered.
My Bias:
➡️ Short-term bullish outlook as long as price holds above the recent range bottom.
➡️ Potential upside targets: 0.6480 → 0.6520.
➡️ If the breakdown below the box, this outlook is invalid.
✍️ This is not financial advice, just my personal trading analysis based on Volume Profile and structure.

BTCUSDT. Find the differences.Hi traders and investors!
On the left — March 3, 2025.
On the right — August 23, 2025.
Same structure, different time.
👉 What happened after March 3?
Will we see the same outcome now — a pullback all the way to the start of the move — or is the market setting up a different scenario this time?
Wishing you profitable trades!

Globant 4H Double BottomGlobant posted a positive earnings report. On the 4-hour chart, a double bottom can be observed. Considering the recent decline in the stock, applying a Fibonacci retracement followed by an extension shows the lowest extension level at 1.618, which acted as support. Today, the price broke to the upside. It will be important to analyze with caution whether it starts gaining volume to return to previous levels, while adjusting the stop-loss as a precaution.

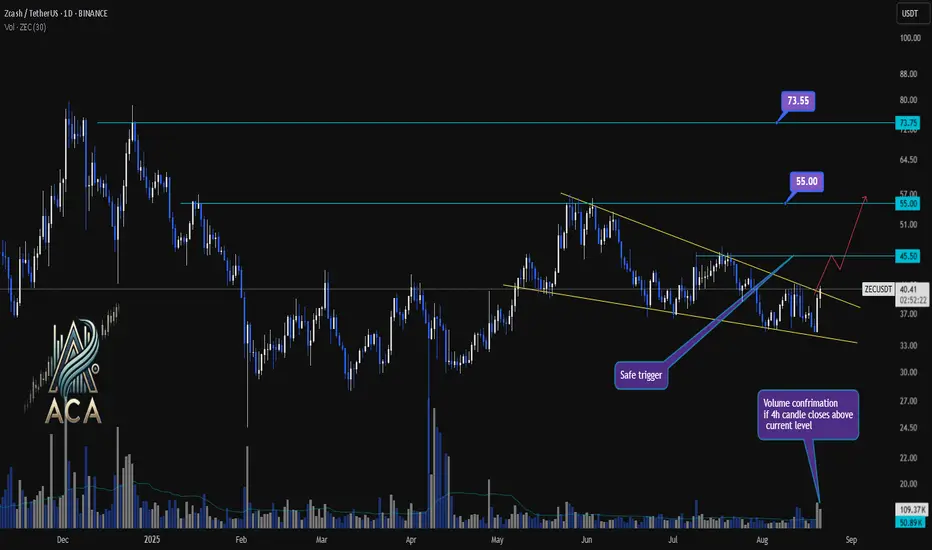
ZECUSDT Daily Chart Analysis | Symmetrical Triangle BO WatchZECUSDT Daily Chart Analysis | Symmetrical Triangle Breakout Watch
🔍 Let’s dissect the ZEC/USDT daily chart, where price action is nearing a pivotal breakout from a symmetrical triangle—often a precursor to major moves when combined with rising volume.
⏳ Daily Chart Overview
Zcash has been consolidating over recent weeks, forming a clear symmetrical triangle pattern bounded by converging trendlines. This pattern, characterized by lower highs and higher lows, signals that volatility is being compressed and a decisive breakout may be imminent.
🔺 Long Setup:
A daily close above the $45.50 resistance, especially with strong volume, will act as a “safe trigger” and confirm breakout validity. If bulls take charge here, the next upside objectives are $55.00 followed by $73.55. Watch for volume confirmation, ideally on a 4H candle close above resistance, to further add confidence to the breakout.
📊 Key Highlights:
- Symmetrical triangle pattern shows growing pressure for a directional move.
- Recent price tested triangle resistance; a close above $45.50 is the bullish trigger.
- Upside targets post-breakout are $55.00 and $73.55, provided volume supports the move.
- Volume spike serves as crucial confirmation—don’t chase without it.
🚨 Conclusion:
ZEC is coiling within a symmetrical triangle, setting the stage for potential breakout action. Bulls are watching $45.50 for a clean breakout trigger, eyeing $55 and $73.55 as next targets. Always wait for strong volume and confirmed closes before acting—symmetrical triangles can break both ways if conviction is lacking.
a flag breakout can be a bullish trade ideahere as per technical analysis , we can see several factor which can
aide a bullish take on TESLA stock on a very short term time frame .
1) pole and flag
2) prices above 20 Day sma ( h)
3) monthly pivot ( traditional ) crossover upside
Pole and flag : a pole and flag which has a decreasing volume during the flag formation , and not having much of retracement , aides the bullish view here
20 DSMA :till the time prices are above the 20 day sma (high) , we can keep our bullish trade intact ,
Pivot level monthly : recently the stock has crossed over monthly pivot level ( traditional ) , in an assuring manner
prices forming a floor above floor structure , where the prices are showing their initial motive towards upside , and then correcting in a slow manner in a retracement manner . a good time has been spent in the shadow of the impulsive motive ( upside ) , which creates a stronger base for the prices and shows no major selling has been happening here , and the profit booked at the higher levels are being bought out again ( re-entry into the market )
break of structure , the lesser candles demand zone which actually created a break of strcuture was respected recently ,
action plan , as soon as the flag pattern is breached on the upside , with a good volume candle , one can have a bullish entry here .
stoploss level at 330 , target price : 15% after the breakout of the flag.

Put if ITM Breaks, Call if Bulls RunPlan: If ITM calls lose support + weight shifts → go long put. If bulls keep running on festive wave → OTM calls gain weight → go long call.
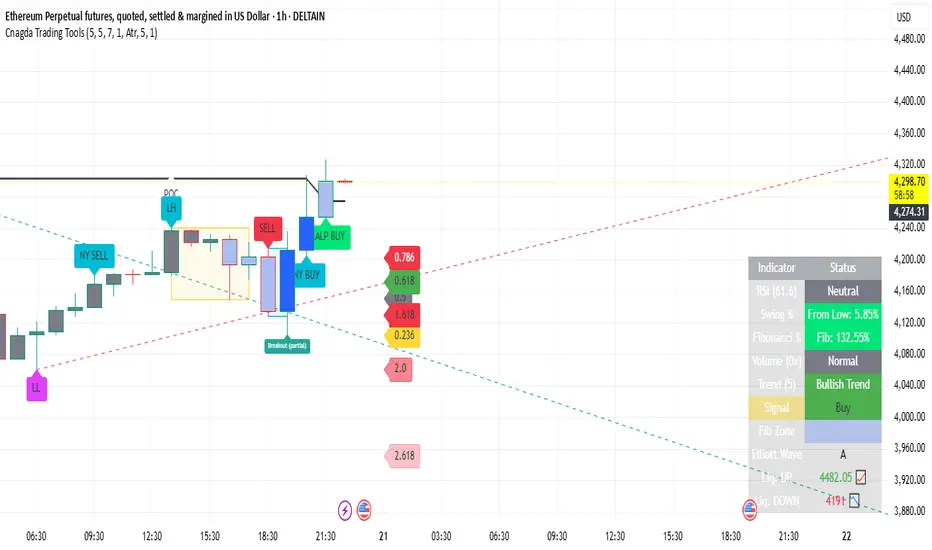
Where is ETH Headed Next? Clear Entry & Exit PlanCurrent Status (August 20, 2025, 1H Chart) Eth
Price: 4,310.40 USD (1-hour close)
Day High: 4,327.60 USD
Day Low: 4,253.65 USD
Change: +1.32% (large positive candle)
1. Trend and Momentum Indicator wise:
Almost all signals are bullish:
Mid-term moving averages (EMA/WMA) are pointing upwards.
Trend line breakouts and labels like “BUY”/“SCALP BUY” may appear.
Volume is also supporting – “High” or “Above Avg” on the dashboard.
RSI will also be above 50 – a sign of continued strength in the trend.
2. Next targets (Fibonacci Extensions)
Potential targets estimated from Fibonacci levels:
1.618 Extension: First resistance/target (approx. zone above current price)
2.0 Extension: Second target
2.618 Extension: Last/aggressive target
These levels are drawn automatically by Cnagda Indicator, and based on them price may pause, or reverse with weak volume.
3. Where can reversal happen?
Reversal Zone:
If RSI moves near or above 70 and price touches Fibonacci 1.618 or 2.0 extension – short term top or reversal is expected there.
If dynamic labels “SCALP SELL”, “SELL”, or “Breakout (red/orange)” are shown, it will be a reversal area.
If the "Signal" line in the dashboard becomes "Strong Sell" or "Sell" – the possibility of reversal increases a lot.
4. Entry-Exit Trading Plan
Entry (Long):
Entry Trigger:
When "BUY", "SCALP BUY" or "Breakout" (lime/green label) appears, and price volume and RSI give confirmation.
Stoploss:
Slightly below previous swing-low (dashboard or Fibonacci low zone)
Target (Long):
Primary target: 1.618 Fibonacci Extension (from Fib Levels line)
If strength continues: 2.0 or 2.618 Extension (hold position from trailing SL)
Partial Exit: "Liq. UP" from dashboard table
Reversal/Short Entry:
If “SELL” or “SCALP SELL”/Breakout is shown at the higher level and dashboard is "Sell/Strong Sell" – go short.
Plan short only if volume is falling, RSI is 70+ (overbought).
Target: Fibonacci 1.0, 0.618, or "Liq. DOWN".
Takeaway for Readers:
"Ethereum is currently bullish in trend and there is a high chance that it will touch the next Fibonacci extension levels (1.618/2.0/2.618) -
But as soon as the reversal label appears in the overbought zone or with strong volume, profit booking will be justified.
The perfect trading plan is:
Take trades according to the trend and the direction of the Cnagda Indicator.
Entry only on your signal, and target on the Fib level.
Take reversals only on clear confirmation of the table and signal."
Author Note:
This article is completely based on the Pine Script indicator which is as advanced as "Cnagda Trading Tools" - do not rely on anything other than real-time algorithmic signals...
AAPL Long HereSetups here for longs
This looks good for an entry at market on open but flat of lower would be preferred

Cardano – Accumulation Above Key PivotWe are currently seeing a phase of accumulation just above a major pivot level. Price has been consolidating within a tight range, suggesting that market participants are building positions.
The Volume Profile shows significant activity around this zone, confirming that a lot of volume has been exchanged here.
However, it’s important to note the liquidity gap just below the current range. If price breaks to the downside, there is very little volume supporting the order book in that region, which could lead to a very fast and sharp move lower. (Anchored volume profile of the last up trend)
HSSEB - ASCENDING TRIANGLE BREAKOUT !HSSEB - CURRENT PRICE : RM0.710
HSSEB is bullish because :
The stock is above 50-day EMA.
The share price is above ICHIMOKU CLOUD
CHIKOU SPAN is above CANDLESTICK
RSI is above 50
Today (20 August 2025) the stock broke out ASCENDING TRIANGLE pattern with high trading volume - indicating strong bullish momentum. The stock may trend higher in near term.
ENTRY PRICE : RM0.700 - RM0.710
TARGET : RM0.780 and RM0.845
SUPPORT : 50-day EMA (CUTLOSS if price close below 50-day EMA)


CPHL just broke its downtrend and about to start UP trend CPHL just broke its downtrend and about to start UP trend. Short entry can be taken and after that the the new targets can be set.
Entry : 95
SL : 80
TP2 : 100
TP2 : 110

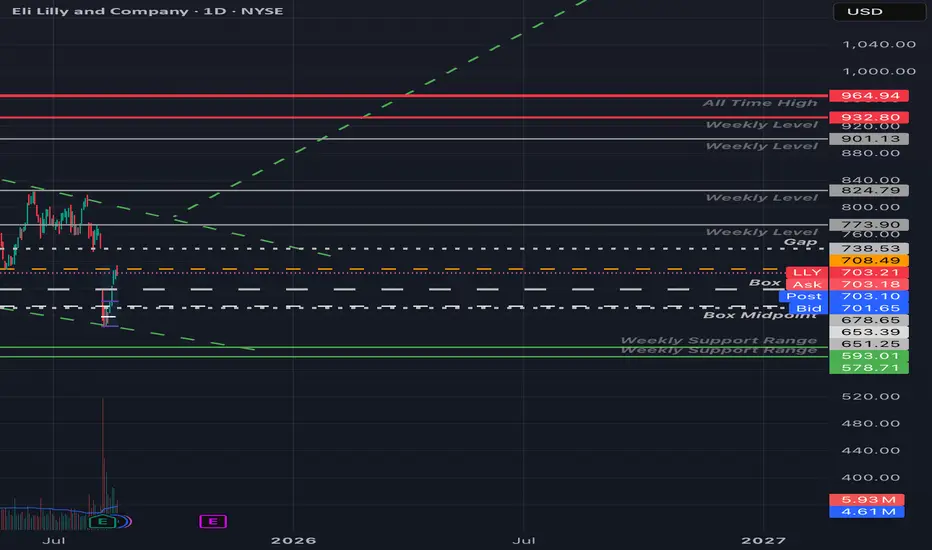
LLY - Clean Levels UpdatedEli Lilly's hit those 708.49 and 711 levels I mentioned in my previous LLY post.
I've added some weekly levels, and a couple relevant spots from my boxed LLY chart.
If LLY loses steam up here we could easily see a retest of that box top area in the $680 - $678 range. Otherwise if we see a market wide reversion from today's liquidation, and LLY clears today's high(~714) and firmly holds that high volume area, that gap($738) fill would be a no-brainer.
Personally leaning on the side of a short continuation(in the near time at least), didn't really trust the low volume float up over the last few trading days, and definitely don't like the decreasing volume into that $711 - $714 area (I'd consider it a Look above and fail).
Regardless of bias, we trade what we see.
~ The Villain.
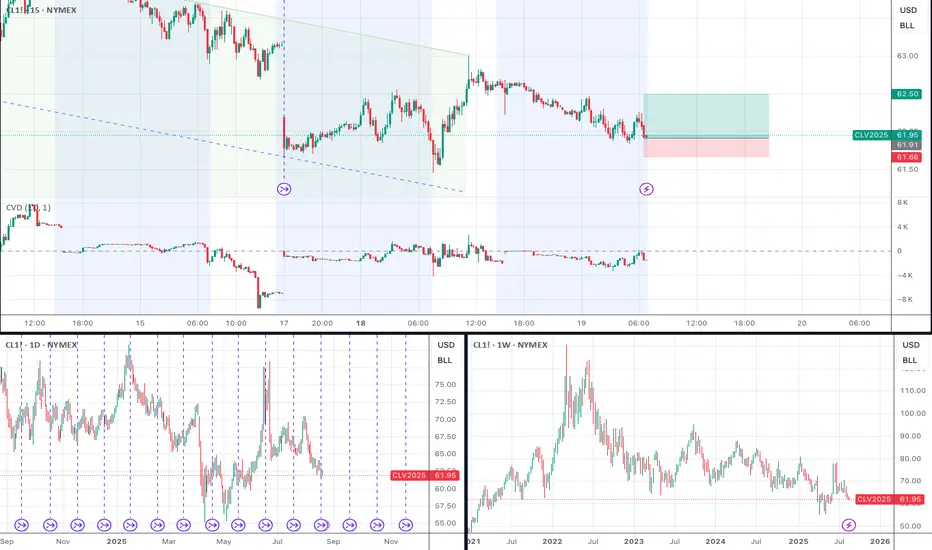
Long CL on Support and CVD DivergenceI live the CVD divergence I'm seeing at this level, and also the liquidity at the order book levels in the 62.40-62.60 range. I think this is worth a small trade to see if this support holds.
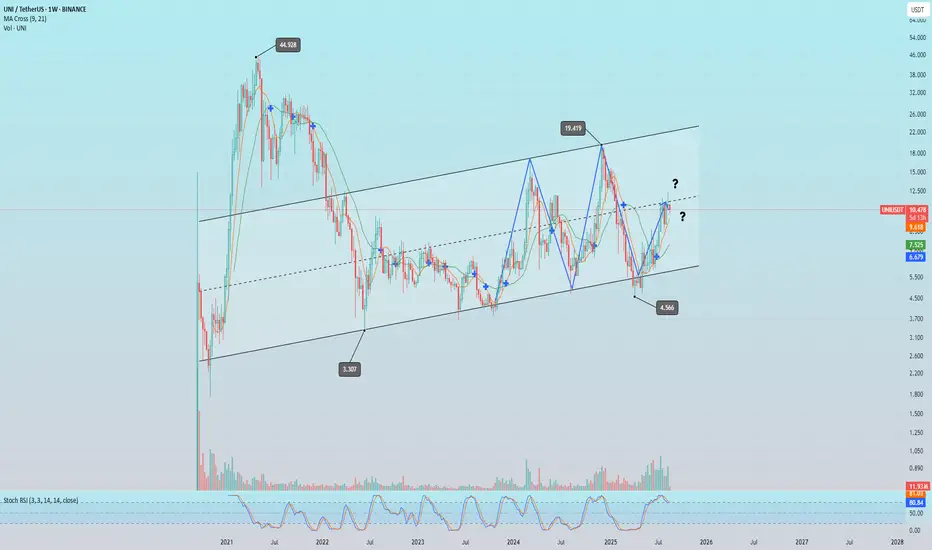
UNI. Is it all that obvious?Is everything really so obvious here and price will just move from the bottom to the top again and again?.. This is a key asset for the large-cap market and if so, you are in for the easiest trade in the markets - or is it?..
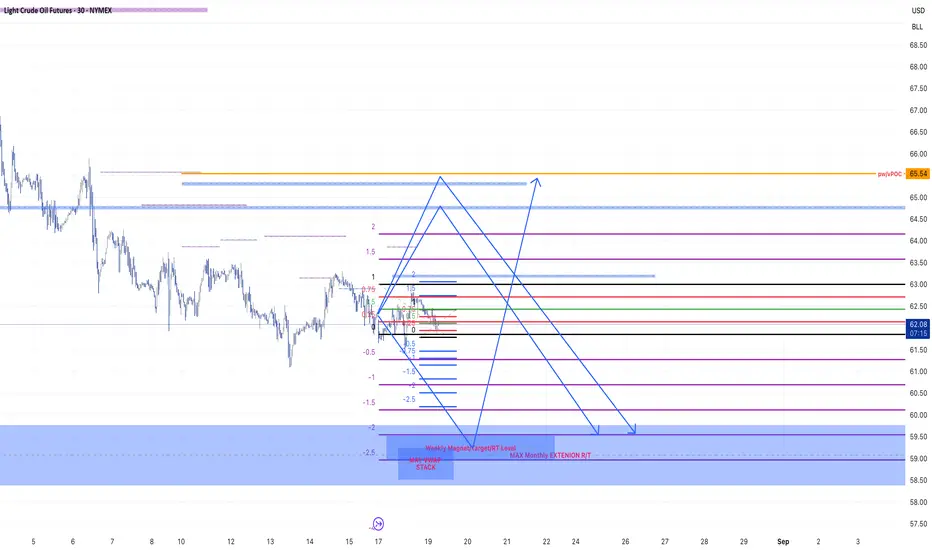
Crude Oil Bearish and Bullish scenarios for the week (UPDATE!!!)Crude Oil can go both directions this week depending on the price we hit in the start of the week.
Patience Patience Patience!!!!
PS: Previous Idea had some wrong measurements. It is fixed now!