CHAMBLFERT - Chambal Fertilizers Ltd. (Daily chart, NSE) - LongCHAMBLFERT - Chambal Fertilizers Ltd. (Daily chart, NSE) - Long Position; short-term swing research idea.
Risk assessment: High {volume & support structure integrity risk}
Risk/Reward ratio ~ 3.41
Current Market Price (CMP) ~ 594
Entry limit ~ 592 on May 27, 2025
1. Target limit ~ 610 (+3.04%; +18 points)
2. Target limit ~ 625 (+5.57%; +33 points)
3. Target limit ~ 650 (+9.80%; +58 points)
Stop order limit ~ 575 (-2.87%; -17 points)
Disclaimer: Investments in securities markets are subject to market risks. All information presented in this group is strictly for reference and personal study purposes only and is not a recommendation and/or a solicitation to act upon under any interpretation of the letter.
LEGEND:
{curly brackets} = observation notes
= important updates
(parentheses) = information details
~ tilde/approximation = variable value
-hyphen = fixed value
Volume

NVDA - 140 Quasimodo?Well NVDA has exceeded the 120 PoC from the last year, and other than the head and shoulders developing it looks rather bullish above that 120. But I would sell 140, or at least not buy.
And if I'm buying I'd probably wait for 112. Think I will wait forever? 😂
Will update after we get some more data.

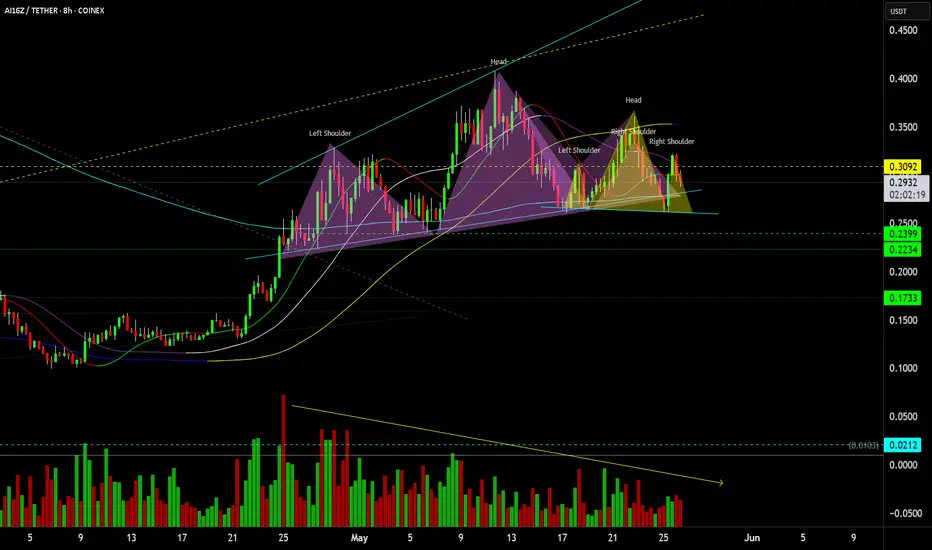
$Ai16z Multi Head & Shoulders top HTFAi16z has formed a HTF Head & Shoulders top with another Head & Shoulders forming within the right shoulder of the HTF H&S with declining volume over the primary formation, all within an Expanding Broadening Wedge top
BTCUSDT 26/05/2025: Overall Price Structure and Wyckoff PhasesPrice Action Analysis:
Observing the price action from May 23rd to May 26th, the chart suggests the development of a Wyckoff accumulation schematic. The initial phase, Phase A, marked the stopping of the previous downtrend. This began with a Selling Climax (SC), where price bottomed near the $107,3K level due to panic selling being absorbed by larger interests. This was followed by an Automatic Rally (AR) to approximately $110K, which established the upper boundary of the subsequent trading range. Subsequent declines, like those served as Secondary Tests (STs) of the SC area.
Phase B represented the "building of the cause," where the "Composite Operator" accumulated positions. This phase extended from the AR, with price trading largely sideways between roughly $107K and $109,8K. The Volume Profile Visible Range (VPVR) highlights a significant Point of Control (POC) near $107,3K during this period, indicating substantial trading activity and value acceptance in the lower part of this range.
Phase C involved a critical test of supply. The dip observed around towards the $106,8K level, testing the SC/ST lows, can be interpreted as a Spring. This maneuver is designed to mislead uninformed traders and assess remaining supply, with price quickly recovering above the range's support.
Following the test, Phase D began, signifying the trend emerging out of the range and its confirmation. A clear Sign of Strength (SOS) occurred with the strong rally. This move decisively broke above the Phase B trading range resistance ($109,8K) and reached approximately $110,4K, indicating that demand had overcome supply. Currently, the price action on May 26th, consolidating above the broken resistance (now support) around the $109,6K-$109,9K area, is characteristic of a Last Point of Support (LPS) or a Back-Up (BU) to the "creek." This area also aligns with a new prominent POC on the VPVR, suggesting it's a new level of value acceptance.
Volume Behavior Analysis:
Volume patterns have closely supported the Wyckoff schematic. The Selling Climax on May 23rd was accompanied by a distinct volume spike, indicative of a significant transfer of shares. Volume during the subsequent Automatic Rally and Secondary Tests was generally lower, signaling diminishing selling pressure. The Spring on May 25th showed notable volume, suggesting a final cleanout of supply, but the ensuing rally demonstrated demand's ability to absorb this. Critically, the Sign of Strength breakout rally on May 25th occurred with a significant increase in volume, validating the upward thrust. During the current LPS/BU consolidation, volume has generally decreased, which is a constructive sign, suggesting light selling pressure as the new support level is tested.
RSI Behavior Analysis:
The Relative Strength Index (RSI) has also provided confirming signals. During the Selling Climax, the RSI likely dipped into oversold territory (below 30). Throughout Phase B, it oscillated primarily in the neutral zone, reflecting the range-bound price action, and may have formed bullish divergences. The Spring might have seen the RSI briefly dip or form another bullish divergence. Importantly, during the Sign of Strength, the RSI surged upwards with the price, likely approaching or entering overbought territory (above 70), confirming strong bullish momentum. In the current LPS/BU phase, the RSI has pulled back from its highs and is now around 46.58, a neutral reading. This cooldown is typical after an impulsive move and provides room for a potential next leg up.
Primary Trend, Signs of Strength, and Weakness:
The trend prior to May 23rd was likely bearish. However, the successful development of the Wyckoff accumulation structure and the subsequent SOS indicate that the emerging primary trend is now considered bullish for the short to medium term.
Signs of strength for this new bullish trend include the completed accumulation schematic, the decisive SOS breakout with increased volume, the price holding above the broken resistance (now support) during the LPS/BU phase (around $109,6K-$109,8K), diminishing volume on the pullback, and the RSI cooling off to neutral. The new POC forming at the LPS/BU level further reinforces this area as a value zone.
Signs of weakness to watch for would include the price failing to hold the current LPS/BU support, a significant increase in selling volume on rally attempts, the price falling back into the previous trading range, or the RSI breaking down or forming significant bearish divergences.
Relevant Points to Consider for the Next 24 Hours:
Over the next 24 hours, the price action around the key support zone of $109,5K to $109,9K (LPS/BU) will be critical. Holding above this, especially with low volume on any dips, would signal continued strength. Volume confirmation is essential: any attempt to rally from the current consolidation and break the recent high around $110,4K should be accompanied by an increase in volume. The RSI should ideally confirm new price highs or hold above 40-50 on tests of support. The immediate resistance is the recent high around $110,4K. A sustained break above this with good volume would signal the continuation of the markup phase. Should the current LPS/BU fail, the next significant support to watch would be the $107K - $107,3K zone. The market is in a post-SOS consolidation, and the immediate future will determine if the markup resumes or if further testing is needed.

USD/CAD - continues the downtrendOn USD/CAD , it's nice to see a strong sell-off from the price of 1.37540 and 1.38150 . It's also encouraging to observe a strong volume area where a lot of contracts are accumulated.
I believe that sellers from this area will defend their short positions. When the price returns to this area, strong sellers will push the market down again.
Strong S/R zone from the past and high volume cluster are the main reasons for my decision to go short on this trade.
Happy trading,
Dale

GBP/USD - Day Trading Analysis With Volume ProfileOn GBP/USD , it's nice to see a strong buying reaction at the price of 1.35000.
There's a significant accumulation of contracts in this area, indicating strong buyer interest. I believe that buyers who entered at this level will defend their long positions. If the price returns to this area, strong buyers will likely push the market up again.
Uptrend and high volume cluster are the main reasons for my decision to go long on this trade.
Happy trading
Dale

EUR/USD continue with the UptrendOn EUR/USD , it's nice to see a strong buying reaction at the price of 1.13800.
There's a significant accumulation of contracts in this area, indicating strong buyer interest. I believe that buyers who entered at this level will defend their long positions. If the price returns to this area, strong buyers will likely push the market up again.
Strong S/R zone from the past + high volume cluster are the main reasons for my decision to go long on this trade.
Happy trading
Dale

MERL Markup phase inbound? Overall, PA has been building up nicely on the daily TF with a clean Wyckoff range building. In phase D we’re seeing increased volume on up bars with larger spreads than the pullback candles. Market could be ready to move into Phase E (markup) after the SOS and pullback. The pullback is sitting nicely on the range top, range 50% level and FVG of Thursdays 22/5 candle.
Daily swings 1 bar and weekly 1bar/2bar swings are up.
Could enter now for more aggressive play as 25 May daily high is broken indicating continuation of trend with SL under the low. However, have to be careful as BTC is primed for a potential pullback to around 98-100k~

STAR breakout candidateThis is the chart of Strides pharma science ltd. The stock currently is trading sideways.
Stock has approached the resistance with very high relative volume.
Stock has continuously performed financially well with triple digit earnings growth and margins expansion.
The recent approach to resistance with very high relative volume suggests a high probability for breaking out resistance zone because the stock has very high earnings but not reflected in price hence the reason. Keep watching the stock.

eur/usd Fib. + key levels. I am bullish.I am bullish on eur/usd, retest in golden zone fib. I wait for a retest around 1.1264

BTCUSDT 1H |Hello greetings,
on 1 Hour timeframe, we can see BTCUSDT just consolidation
but, in meantime we can see also the volume spike below chart & chart confirmation
price hit couple of times around previous 1st volume spike (support) $101,525.03 and keep rebound making consolidation,
my target if i buy this BTCUSDT is keeping on high is around 2nd volume spike $104.152,84 - $105.819,45
why if? we need confirmation on this volume too to break the resistance

Play on LevelsGGL - Closed at 15.67 (23-05-2025)
Ideal Support levels:
S1 around 15.07 - 15.15
S2 around 13.86 - 14
S3 around 12.80 - 13
Upside targets can be around 17-18
if these supports are respected.

Follow the Flow: Trading with Liquidity ZonesLiquidity is where the market breathes. The Liquidity Zones indicator by BigBeluga helps traders visualize where large players may be hiding orders—revealing the zones where price is most likely to react, reverse, or accelerate.
Let’s break down how this tool works, how we use it at Xuantify, and how you can integrate it into your own strategy.
🔍 What Is the Liquidity Zones Indicator?
This open-source tool identifies pivot highs and lows filtered by volume strength and plots them as liquidity zones —highlighting areas where buy/sell orders are likely to accumulate.
Key Features:
Volume-filtered pivot detection (Low, Mid, High)
Dynamic or static liquidity zone boxes
Color intensity based on volume strength
Liquidity grab detection with visual cues
These zones act as magnets for price , helping traders anticipate where reactions, reversals, or stop hunts may occur.
🧠 How We Use It at Xuantify
We use Liquidity Zones as a contextual map for structure and execution.
1. Entry & Exit Planning
We align entries near untested liquidity zones and use them as targets for exits—especially when confirmed by structure or momentum.
2. Liquidity Grab Detection
When price pierces a zone and reverses, it often signals a liquidity sweep . We use this as a trigger for reversal setups.
3. Volume Context
Zones with higher volume intensity are prioritized. These are more likely to attract institutional activity and generate stronger reactions.
🧭 Dynamic vs. Static Zones
The indicator offers both dynamic and static zone modes:
Dynamic : Box height adjusts based on normalized volume, showing how much liquidity is likely present.
Static : Consistent box size for cleaner visuals and easier backtesting.
Why this matters:
Dynamic zones reflect real-time volume strength
Static zones offer simplicity and clarity
Both modes help visualize where price is likely to “grab” liquidity
⚙️ Settings That Matter
To get the most out of this tool, we recommend:
Volume Strength = Mid or High for cleaner zones
Enable Dynamic Mode when trading volatile assets
Use Color Intensity to quickly spot high-liquidity areas
🔗 Best Combinations with This Indicator
We pair Liquidity Zones with:
Market Structure Tools – BOS/CHOCH for context
Momentum Indicators – Like RSI or MACD for confirmation
Fair Value Gaps (FVGs) – For precision entries near liquidity
This layered approach helps us trade into liquidity , not against it.
⚠️ What to Watch Out For
Liquidity zones are not signals —they’re context . In fast-moving or low-volume markets, price may ignore zones or overshoot them. Always combine with structure and confirmation.
🔁 Repainting Behavior
The Liquidity Zones indicator is designed to be non-repainting . However, due to waiting for pivot confirmation, the zones are plotted in hindsight. This makes it suitable for real-time execution .
⏳ Lagging or Leading?
This tool is partially lagging —it waits for pivot confirmation and volume validation before plotting a zone. However, once plotted, these zones often act as leading levels , helping traders anticipate where price may react next.
🚀 Final Thoughts
The Liquidity Zones indicator by BigBeluga is a powerful visual tool for traders who want to understand where the market is likely to move—not just where it’s been. Whether you’re trading reversals, breakouts, or mean reversion, this tool helps you stay aligned with the market’s hidden intent.
Add it to your chart, test it, and see how it sharpens your edge.

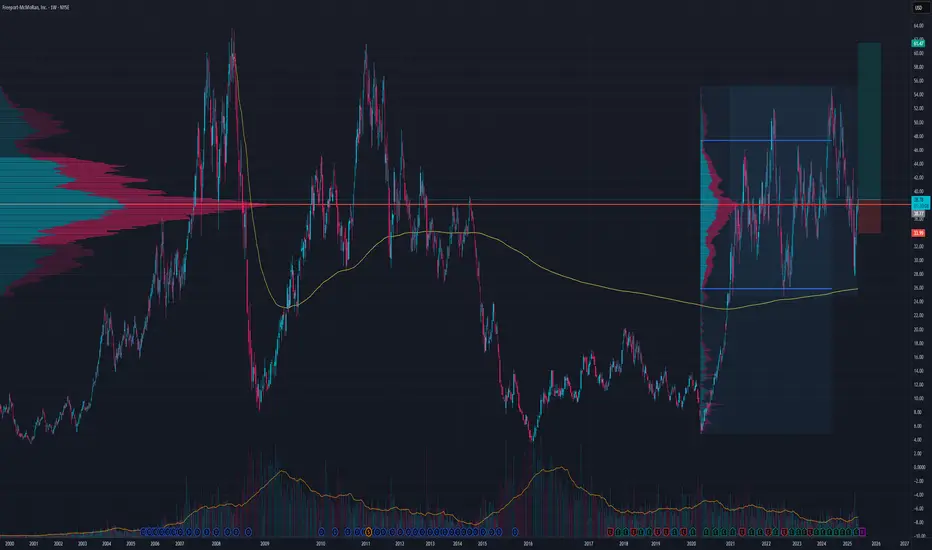
FCX BullishPossible range POC reclaim here
Might be able to get a better price closer to POC for nicer risk/reward next week
SL 33.74
TP1 46-47
TP2 50-51
TP3 61.50
NZDCAD | Strong Demand Zone DetectedIf we look at the daily chart for NZDCAD we can see a strong demand zone forming. This level will make a good target for order flow.
Typically, you want to wait for price to reach this level and take a long. However, you can also use this as a higher timeframe orderflow bias. But keep in mind you'll be lowering your odds of success compared to the long.

Triangle Breakout Watch | BUY SignalIntel is squeezing into a nice triangle pattern on the 4H chart, sitting above strong support at €18. Volume is calming down – a classic sign before a move.
Buy idea:
A breakout above €18.50 with strong volume could trigger a buy, aiming for €20–21.80.
Stop: Below €17.50 just in case it fakes out.
Looks like a solid setup if bulls step in. Watching closely!

SPY to 575 EOM
IF AND ONLY IF buyers can't step in...
SPY 575 first bearish target
560 if we break the trendline at 575ish
555 after that
I'm going to watch how price reacts but my intraday bias is now bearish

AEGISLOG - Aegis Logistics Ltd. (45 minutes chart, NSE) - LongAEGISLOG - Aegis Logistics Ltd. (45 minutes chart, NSE) - Long Position; short-term swing research idea.
Risk assessment: High {volatility risk}
Risk/Reward ratio ~ 2.63
Current Market Price (CMP) ~ 880
Entry limit ~ 870 to 860 (Avg. - 865) on May 22, 2025
1. Target limit ~ 890 (+2.89%; +25 points)
2. Target limit ~ 915 (+5.78%; +50 points)
Stop order limit ~ 846 (-2.20%; -19 points)
Disclaimer: Investments in securities markets are subject to market risks. All information presented in this group is strictly for reference and personal study purposes only and is not a recommendation and/or a solicitation to act upon under any interpretation of the letter.
LEGEND:
{curly brackets} = observation notes
= important updates
(parentheses) = information details
~ tilde/approximation = variable value
-hyphen = fixed value

RUNE Ready for a Big Move? Accumulation Breakout Incoming!Current Market Structure:
#RUNE has been in an accumulation phase after a prolonged bearish trend. The price is consolidating, forming a potential Wyckoff Accumulation pattern. No further bearish signs are present except for the previous break of a strong support level.
Key Levels to Watch:
🔹 Support: $0.788 (previous level)
🔹 Resistance: $2.5 (breakout zone)
🔹 Accumulation Range: $1.13 – $1.6
Trading Plan:
🔹 A confirmed breakout above the resistance level will signal the start of a bullish trend.
🔹 Ideal long entry on breakout with a retest confirmation.
🔹 Stop-loss below accumulation range to minimize risk.
🔹 Targeting $7 as the next resistance level.
What do you think?
Will #RUNE break out soon, or are we in for more sideways movement? Share your thoughts in the comments!
Like & Follow for more trade setups and insights!

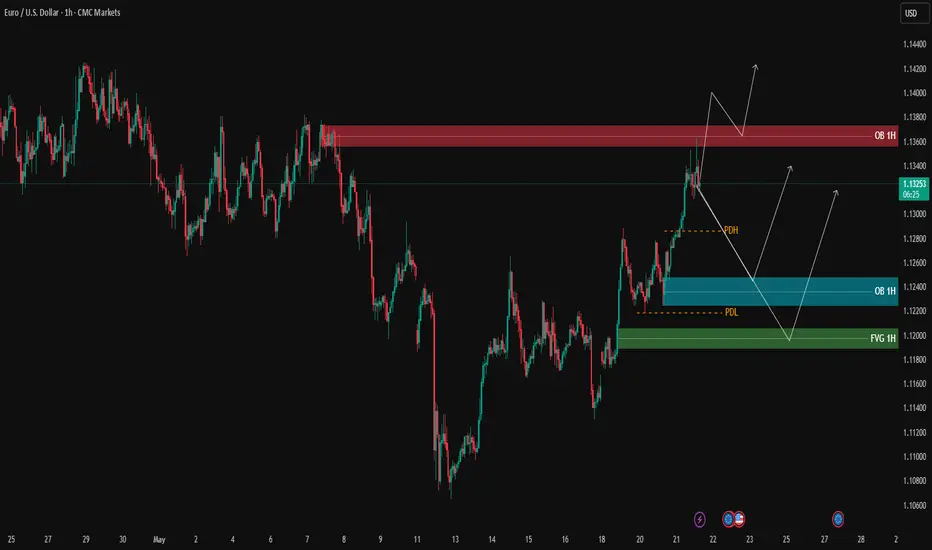
EURUSD – Testing 1H Supply Zone, Awaiting Confirmation | ProfitaAfter a strong bullish rally breaking previous highs, EURUSD is now reacting to the 1H supply zone (OB 1H) marked in red.
We’re seeing an initial bearish rejection from this zone. If sellers maintain control, price may retrace toward the lower demand areas:
Blue OB 1H zone (1.12200 – 1.12450)
Green FVG 1H further below
However, if buyers manage to push price above the red OB and close a candle above it, continuation to the upside remains a valid scenario.
📌 Key Levels
🟢 Support Zones:
1.12200 – 1.12450
1.11780 – 1.12000
🔴 Resistance:
1.13500 – 1.13800
⚠️ Note:
Watch for lower-timeframe (M5/M3) confirmations for entry. Only act on clear setups inside the zones.
🔍 Insight by ProfitaminFX
HIMS Corrective Wave PullbackLooks like HIMS started its corrective wave pull back. The MACD is about to cross the signal to finish wave B, it most likely will close the gap above. Then I expect it to pull back to around the .5 & .618 fib around $40-45 range where I also there is confluence with the AVWAP from the April 7 pivot around $45. I plan to add in this range before the next leg up.

GOOGL Long HereCouple setups to long here
Wider stop loss is safer while tighter stop loss give 1:5 risk to reward
Half % risk of trading account or less on tighter stop loss play is prudent
