Opendoor Technologies | OPEN | Long at $0.60Opendoor Technologies $NASDAQ:OPEN. This is purely a swing trade for a company that has been posting declining earnings and revenue since 2022 and does not anticipate becoming profitable in the next 3 years. Since the stock is now under $1, it's at-risk of being delisted from the Nasdaq. I am entering this play because there is a chance the recent price hit near $0.50 may be a temporary bottom and there is enough short interest (near 18%) for a spike near its book value of $1.00. Quick ratio is 0.75 (i.e. company may have difficulty meeting its short-term obligations without selling inventory or acquiring additional financing). While the company may be forced to do a split (a major risk for this purchase), I can see other eyes viewing this as a potential "quick play" for a reversal near its book value.
At $0.60, NASDAQ:OPEN is in a personal buy zone for a swing trade.
Targets:
$0.87 (+45%)
$1.00 (+66.7%)
Volume

Netflix (NFLX) RSI Bearish Divergence Setting Up Major Rever📈 Summary:
Netflix has rallied +44% in just 60 days, entering a steep, parabolic move. However, technical exhaustion signs are now flashing across multiple indicators — suggesting a potential near-term top may be forming.
🔍 Key Technical Observations:
1. Bearish RSI Divergence
The RSI is making lower highs (~73) while price makes higher highs → classic bearish divergence.
Similar divergences in December and February led to drops of –12% and –18% , respectively.
2. Parabolic Move + Rising Wedge
Price has broken out of an orderly channel and is now moving parabolically , a pattern typically unsustainable.
The current structure resembles a rising wedge , often a reversal formation .
3. Volume Weakness
Volume has been declining throughout the recent push , signaling weak demand behind the rally.
No climactic buying — this raises the risk of a sharp drop if momentum fades .
4. MACD Losing Momentum
MACD histogram has flipped slightly negative.
A potential bearish crossover is brewing.
🧭 Strategy Outlook
🚨 Aggressive traders could look for short opportunities below $1,240 , where support may break.
🧠 Options traders might consider a bear call spread once a daily close confirms the wedge breakdown.
📌 Key Levels
Support to watch: $1,240 (break = confirmation)
Next support zone: $1,190–1,155 (EMA cluster)
Critical RSI trigger: break below 65 confirms bearish divergence playing out
🧩 Final Thoughts
The RSI divergence, parabolic structure , and volume behavior all align for a potential pullback . While the trend is still technically intact, risk-reward favors preparing for a reversal , especially with prior divergences leading to significant downside.

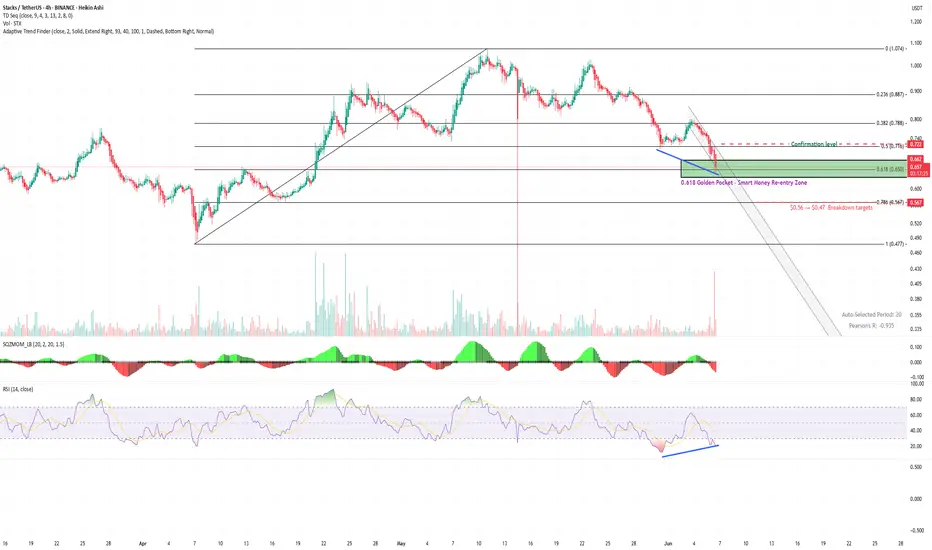
$STX / USDT (4H) – Golden pocket re-entryCOINBASE:STXUSD is testing the 0.618 Fib retracement ($0.65)
A zone where smart money often re-enters after corrections.
Confluence:
🔹 TD9 buy
🔹 RSI divergence
🔹 Fading momentum
🔹 Volume pickup near support = early demand?
Reclaim $0.72 could trigger a relief rally to $0.78–$0.80
Break $0.65 opens $0.56 and $0.47.

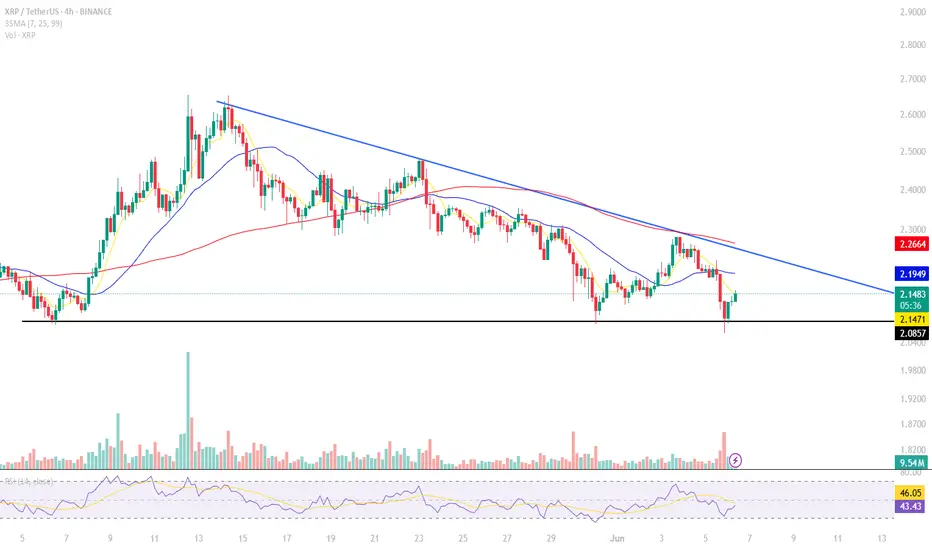
XRP/USDT at Key Support | Trendline Pressure Builds
ABT is currently testing a strong horizontal support zone around 2.08–2.15 USDT after rejecting from the descending trendline.
This area has held multiple times in the past, showing strong buying interest. If the support holds and price breaks above the yellow trendline, we could see a short-term bullish move toward the 2.30–2.45 resistance zone.
RSI is recovering from oversold levels, signaling potential for a reversal, but volume confirmation is still weak.
⚠️ Key levels to watch:
Support: 2.08–2.15
Resistance: 2.30 and 2.45
Breakout zone: Above descending trendline
I'm waiting for a clear breakout with strong volume before considering long positions.
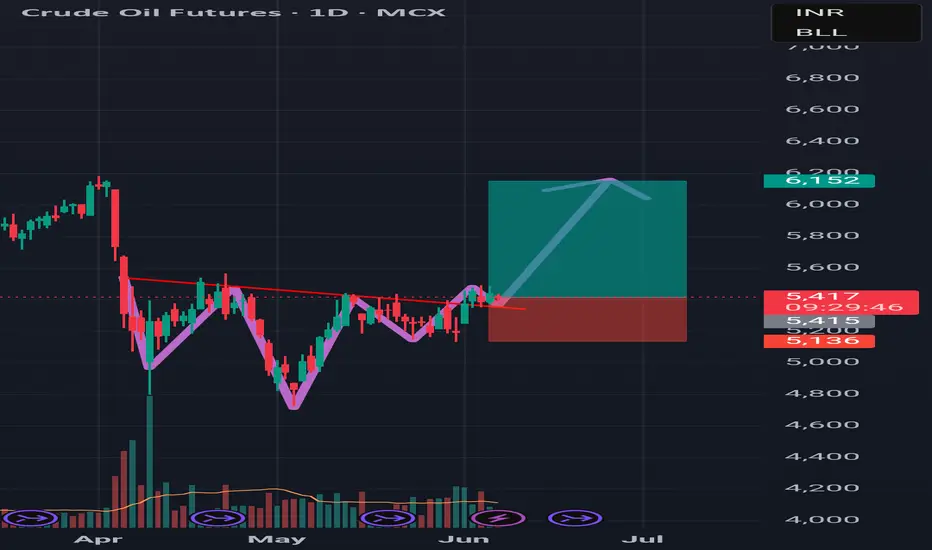
REVERSE HEAD AND SHOULDER PATTERNSCrude oil looks good can go long with Stoploss. Bigbreakout expected
Consolidation Breakout forming on Dhampur Sugar1. Stock is consolidating below 151 resistance, forming higher lows with a bullish structure.
a breakout required above 151 with strong volume to a fresh bullish move.
2. price action shows a volatility contraction.
3. moving averages sloping up trend intact. wait for volume breakout and bullish close.
4. volume has since declined but remains stable, showing healthy consolidation.

Btc ran stopsQuick wick as a swing fail pattern and poked into the fair value gap inefficiency, looks like we might get a retest and we’ll see how it goes. We might get 150k BTC before GTA 6

Silver Mining LongNot the best Silver Mining Company but the setup and risk/reward is good
TP1 6.19
TP2 6.46
TP3 6.72
SL 4.61

How to use VWAP the right-way on TradingView
1️⃣ What Is VWAP (Volume Weighted Average Price)?
VWAP stands for Volume Weighted Average Price. It's a tool that shows the average price an asset has traded at throughout the day, adjusted for volume. That means it gives more weight to prices with high trading volume.
✅ It helps traders and investors see if the current price is above or below the average price paid.
✅ It’s often used by institutional traders, such as mutual funds and pension funds, to enter and exit positions without causing major price moves.
VWAP = (Sum of Price * Volume) / Total Volume
2️⃣ Why VWAP Matters
I (Traders) often use VWAP as a dynamic support or resistance zone.
- Price below VWAP: considered undervalued by some 👉 may act as support
- Price above VWAP: considered overvalued 👉 may act as resistance
It acts like a magnet for price, especially in trending markets.
VWAP is also used as a benchmark for large players want to buy below VWAP or sell above it.
3️⃣ Anchored VWAP (AVWAP)
Anchored VWAP is a more advanced version of VWAP. Instead of starting at the market open, you anchor it to a specific candle (pivot high or low).
🔍 Why use it:
- Lets you analyze the average price from key market turning points
- Helps spot institutional interest near pivots
- More accurate for swing trading
When you anchor VWAP to a major high or low, it gives you clean zones where smart money might enter or exit.
4️⃣ How I Use Anchored VWAP
I personally anchor VWAP from:
- Major pivot highs/lows
- Breakout points
- Strong reversal candles
Then I watch how price interacts with it.
✅ Works well on 30m and 4H charts for intraday or swing setups
✅ Can be combined with fixed range volume profile for extra confluence
If you haven’t read my guide on fixed range volume profile, scroll below — it’s linked there.
5️⃣ Common Uses
✔️ Support and resistance zone in trending markets
✔️ Institutional entry/exit level benchmark
✔️ Reversion-to-mean setups
VWAP is used across timeframes. I use higher timeframes like 4H to spot trend zones, then zoom into 30m or 15m for entries.
Setting and more information
VWAP Explained by TradingView: www.tradingview.com
Anchored VWAP Explained by TradingView: www.tradingview.com
6️⃣ VWAP Limitations
⚠️ VWAP doesn’t work well in all cases:
- In sideways/choppy markets, it can lose value
- It is not an exact entry/exit signal, but rather a dynamic zone
- In FX markets, it’s unreliable due to lack of centralized volume data
Also, treat VWAP as a zone, not a line. Large players fill big orders in that area, expect false moves or liquidity grabs.
7️⃣ Mistakes to Avoid
❌ Entering blindly on VWAP touches
❌ Using VWAP without confirmation from price action or volume
❌ Assuming it always gives perfect levels
It works best when combined with other tools, such as market structure, support/resistance, and volume profile.
8️⃣ Final Thoughts
VWAP is a powerful tool to see where price is relative to volume-based value. Anchoring VWAP to key levels adds precision and insight.
Used properly, it helps:
- Spot where institutions might be active
- Confirm high-probability zones
- Improve entries/exits when paired with other tools
Examples are provided below to show how VWAP works in real-time setups. This guide is educational and for learning purposes only.
VWAP Zone and a Example trade CRYPTOCAP:BTC
Example Stock Market NASDAQ:AAPL
Example Resistance NASDAQ:MSTR
VWAP (Volume Weighted Average Price) helps traders see the average price weighted by volume. It's commonly used by institutions to identify good entry/exit zones. Anchored VWAP takes this further by starting from key points like pivot highs/lows for more accuracy. It's most useful in trending markets and works best when combined with tools like fixed range volume profile or support/resistance. While powerful, VWAP isn’t perfect it should be used as a dynamic zone, not a fixed level, and always with other confirmations.
Disclaimer: This is not financial advice. Always do your own research. This content may include enhancements made using AI.

Update on $Zeus This play played out perfectly. TP Smashed. Locked in 60% profits and letting 40% ride. With official IP just acquired and a bull market on the horizon in the crypto world, this could be major..

Volume Speaks Louder: My Custom Volume Indicator for Futures
My Indicator Philosophy: Think Complex, Model Simple
In my first “Modeling 101” class as an undergrad, I learned a mantra that’s stuck with me ever since: “Think complex, but model simple.” In other words, you can imagine all the complexities of a system, but your actual model doesn’t have to be a giant non-convex, nonlinear neural network or LLM—sometimes a straightforward, rule-based approach is all you need.
With that principle in mind, and given my passion for trading, I set out to invent an indicator that was both unique and useful. I knew countless indicators already existed, each reflecting its creator’s priorities—but none captured my goal: seeing what traders themselves are thinking in real time . After all, news is one driver of the market, but you can’t control or predict news. What you can observe is how traders react—especially intraday—so I wanted a simple way to gauge that reaction.
Why intraday volume ? Most retail traders (myself included) focus on shorter timeframes. When they decide to jump into a trade, they’re thinking within the boundaries of a single trading day. They rarely carry yesterday’s logic into today—everything “resets” overnight. If I wanted to see what intraday traders were thinking, I needed something that also resets daily. Price alone didn’t do it, because price continuously moves and never truly “starts over” each morning. Volume, however, does reset at the close. And volume behaves like buying/selling pressure—except that raw volume numbers are always positive, so they don’t tell you who is winning: buyers or sellers?
To turn volume into a “signed” metric, I simply use the candle’s color as a sign function. In Pine Script, that looks like:
isGreenBar = close >= open
isRedBar = close < open
if (not na(priceAtStartHour))
summedVolume += isGreenBar ? volume : -volume
This way, green candles add volume and red candles subtract volume, giving me positive values when buying pressure dominates and negative values when selling pressure dominates. By summing those signed volumes throughout the day, I get a single metric—let’s call it SummedVolume—that truly reflects intraday sentiment.
Because I focus on futures markets (which have a session close at 18:00 ET), SummedVolume needs to reset exactly at session close. In Pine, that reset is as simple as:
if (isStartOfSession())
priceAtStartHour := close
summedVolume := 0.0
Once that bar (6 PM ET) appears, everything zeroes out and a fresh count begins.
SummedVolume isn’t just descriptive—it generates actionable signals. When SummedVolume rises above a user-defined Long Threshold, that suggests intraday buying pressure is strong enough to consider a long entry. Conversely, when SummedVolume falls below a Short Threshold, that points to below-the-surface selling pressure, flagging a potential short. You can fine-tune those thresholds however you like, but the core idea remains:
• Positive SummedVolume ⇒ net buying pressure (bullish)
• Negative SummedVolume ⇒ net selling pressure (bearish)
Why do I think it works: Retail/intraday traders think in discrete days. They reset their mindset at the close. Volume naturally resets at session close, so by signing volume with candle color, I capture whether intraday participants are predominantly buying or selling—right now.
Once again: “Think complex, model simple.” My Daily Volume Delta (DVD) indicator may look deceptively simple, but five years of backtesting have proven its edge. It’s a standalone gauge of intraday sentiment, and it can easily be combined with other signals—moving averages, volatility bands, whatever you like—to amplify your strategy. So if you want a fresh lens on intraday momentum, give SummedVolume a try.

Beautiful Market Maker on the Nasdaq this early morning.This will be an entire move downward that no one is picking up on right now. With price in the perfect sell position, we're looking to collect on the spread between greed and far like a true market maker
Gold Pullback Entry Opportunity Gold resumed its rally, sparked by recent tarrif news. Price is pulling back at the moment and has entered an sweet spot where we can confidently take our first low risk Buy.
BUYING HERE BECAUSE
1. We're entering into a low volume area, which is also in line with an FVG on the 1hr chart
2. When a new uptrend starts, i like to buy first 2 instances price pullback to bounce from my trend cloud indicator We didn't get a perfect bounce as it has broken below it, but i'am still buying regardless due to my first reason above about the low volume gap.
PROFIT TARGET
Setting my profit target to my trusted Exofade peak. As long as the uptrend continues, Exofade peaks will ALWAYS get taken out. That why i love this indicator, and its free. It's my gift to y'all :) . Just search for it in trading view indicators.

KRBL DAILY TIME FRAME VOLUME AND SUPPLY DEMAND ZONEHere, in chart I have tried to explain the supply zone, where we observe a volume based Breakout. above this zone there is one major zone of 332 above which we may reach the final destination of 408-410.
KRBL is leading manufacturer in Basmati Rice (Famous name is India Gate Basmati Rice) after its competitor LT Foods (DAWAAT).

GOLD — Daily & 4H Timeframes📍 GOLD — Daily & 4H Timeframes
On the daily timeframe, gold is targeting the 3435 level.
On the 4-hour chart, buyers attempted to break out of the sideways range, but the price was pulled back inside.
A second attempt also failed — only the wick extended beyond the range, where the key volume is located.
It’s likely that the price will test the buyer zone again (blue rectangle on the chart), which also contains a price gap.
The boundaries of the sideways ranges are marked with black lines.
This analysis is based on the Initiative Analysis concept (IA).
Wishing you profitable trades!

EURUSD — Daily & 4H TimeframesThe correction continues on EURUSD.
Both the daily and 4H timeframes show sideways ranges, with seller initiative in control. The boundaries of the sideways ranges are marked with black lines.
However, sellers appear weak — the price has been stuck for several hours inside a buyer attack bar near the upper boundary of the range. Now, sellers are attempting to absorb this buyer bar.
If considering long setups, it's safer to look for patterns near the daily level of 1.13126, or from the lower boundary of the 4H range.
Another option is to wait for a confirmed breakout above the range.
Searching for buys in the upper part of the current range is risky.
This analysis is based on the Initiative Analysis concept (IA).
Wishing you profitable trades!

SPY Inverse Head & Shoulders Played Out Clean – Bounce from Buy Just wanted to follow up on the AMEX:SPY idea I published yesterday — this played out exactly as expected 👇🏾
We got that clean pullback right into the 588.50–589.90 buy zone, which aligned perfectly with high-volume support. From there, price reversed and gave us that upside move back toward 593+.
Even more validating: the pattern that formed was a textbook inverse head and shoulders
🔹 Left Shoulder → formed near 586
🔹 Head → at the deeper 585 level
🔹 Right Shoulder → bounced cleanly off the buy zone
🔹 Neckline Break → confirmed the move above 591.12
This is why I always say: have your levels ready and wait for confirmation. No chasing, just execution.
🔑 Buy zone held
📊 Volume-backed support
📈 Continuation in progress
Will continue monitoring for follow-through above 593.46. If bulls hold control, next resistance is near 596–597.

USDCAD - Longkeeping close tabs on this one.
Price is showing signs of reversing after breaking the previous lows on the higher timeframe.
Unsure yet as to whether I will trade it. But its certainly one to watch

EURUSD - LONGLooking at the EURUSD most recent BOS
MAIN Entry
- There was a manipulation on the lower TF in which the FVG (fair value gap) was caused.
- it is also the origin of where price cause the price the break previous structure.
Secondary ENTRY
- Secondary entry will be down at the grey box.
- Will cover this if the first position fails

$WIF/USDT POTENTIAL PUMP INCOMING? Chart Overview
- Bullish Bat Pattern, suggesting potential reversal near completion point D.
- Price recently completed the pattern, currently near trendline and 0.618 Fib retracement zone.
- (OBV) broke out of consolidation, hinting potential volume shift.
Demand Zone / Support
- Demand Zone : $0.30–$0.41 (green box ).
- Key Trendline Support : Rising trendline from May remains intact.
Supply Zone / Resistance
Supply Zone : $1.18 – $1.38 (purple box).
This area aligns with the high volume node on the right-side volume profile.
Strong rejection likely if price approaches without major breakout.
Volume Profile
High Volume Node (HVN): $1.06 - $1.15 , confirming strong interest/previous consolidation.
Low Volume Node (LVN): $0.80 – $0.95 , suggesting potential fast moves up/down.
Fair Value Gaps (FVG)
First FVG: ~$0.96 – $0.98
Second FVG: ~$0.89 - $0.92
These are targets if price moves upward.
Fibonacci Levels
- 0.618 retracement (~$0.85) aligns near trendline — major confluence.
- 0.786 retracement (~$0.71) rests below trend line.
Bullish Scenario
- Price holds above 0.618 Fib (~$0.85) and bullish trendline.
- Breaks above to fill FVG and move toward $1+.
- OBV breakout supports accumulation and incoming demand.
Bearish Scenario
- Price breaks below $0.65 and loses trendline.
- Bearish invalidation of Bat pattern, opening room to drop to:
- Fib Lev 1 or deeper into the $0.50–$0.40 zone.
- Volume fades on OBV
Risks
- Trendline Break : Potential aggressive sell-off.
- Volume Drop : If OBV rally fails, buyers dry up.
- Macro/Sentiment : WIF is meme-sensitive.
Summary
Bullish Bat completion with price testing a high-confluence zone (trendline + 0.618 Fib).
Many upside targets with FVGs.
If Price breaks below trend line and 0.65, bullish/long predictions will be invalid.

What is a Bearish Breakaway and How To Spot One!This Educational Idea consists of:
- What a Bearish Breakaway Candlestick Pattern is
- How its Formed
- Added Confirmations
The example comes to us from EURGBP over the evening hours!
Since I was late to turn it into a Trade Idea, perfect opportunity for a Learning Curve!
Hope you enjoy and find value!

BTCUSD IS BULLISH BUT TRUMP MIGHT SPOIL IT, BEWARE!🧠 Context:
We’re looking at BTCUSD after a textbook liquidity sweep, demand zone reaction, and clear structure shift. This chart beautifully displays institutional order flow, giving us a high-probability long setup.
🔍 Detailed Breakdown:
✅ 1. Liquidity Sweep & Demand Reaction:
Price made a sharp move downward into a previous demand zone (marked red).
The move into 104,169–104,451 region swept sell-side liquidity resting below previous lows.
The strong bullish engulfing candle from that zone confirms mitigation of a bullish order block.
🔁 2. Break of Structure (BoS):
Post-demand tap, BTC broke above a minor supply structure, forming a higher high.
This is our confirmation of a short-term bullish market structure shift.
🎯 3. Entry Setup:
Price retraced slightly after the break of structure and appears to be forming a higher low.
Current price is around 105,309, a potential entry for longs.
🧱 4. Target Zones:
TP1: 105,800 – fill inefficiency zone
TP2: 106,130.21 – supply zone / previous high
SL: Below demand zone (~104,150) — below OB and liquidity sweep
🧊 5. Volume Profile Insight:
High volume node concentrated at the lower consolidation, signaling accumulation.
Price is now trading above POC, supporting a bullish continuation narrative.
🧭 Conclusion:
This BTCUSD setup shows classic Smart Money reversal mechanics:
✅ Liquidity grab
✅ Order block tap
✅ Structure break
✅ Volume confirmation
📈 Bias: Bullish
🎯 Long targeting 106,130
🛑 SL below 104,169
🔔 Manage risk and monitor lower timeframes for confirmation. BTC has room to run, but always watch reaction at key zones.
