Gold: First signs of a correction after a strong rallyHi traders and investors!
This analysis is based on the Initiative Analysis (IA) concept.
For the past nine weeks, gold has been flying upward — and now we’re starting to see signs of a pause in growth or even the beginning of a correction.
Friday’s candle showed very high volume, and this volume came from the seller side.
A similar, though smaller, volume was seen on August 8.
This could indicate that we may enter a correction or sideways phase.
The range of the most recent buyer initiative on the daily timeframe is quite wide.
Yesterday, the price came close to the 50% level of that initiative, but didn’t quite reach it.
The key levels to watch for potential buys are:
50% level of the buyer initiative — 4162,
upper boundary of the previous buyer initiative — 4059.
By the way, on the weekly timeframe, last week’s trading volume was the highest since March 2022.
All these signs point to a possible pause in growth.
Wishing you profitable trades!
Volume

Bitcoin: key buyer levels may lie lowerHi traders and investors!
This analysis is based on the Initiative Analysis concept (IA).
Let me remind you that on the weekly timeframe, Bitcoin still hasn’t managed to launch an upward trend after breaking out of the sideways range. The market is currently in a transitional phase, with buyer initiative above and seller initiative below.
Price has already attempted to break upward from the buyer initiative twice — during the weeks of August 11 and September 29. Now, the price has returned back into the range.
We also see declining volumes on the monthly chart, showing that the buyer clearly lacks strength.
At the moment, sellers are facing support around 105,100 — the base of the July 2025 monthly candle. It’s not a bad context for looking for buys, if only the candle had strong volume.
We’ll see how things develop on the daily timeframe. If the price consolidates below 107,255 (the breakout test level on the weekly TF) and then buyers absorb the seller’s candle from October 17, that could create a reason to look for longs.
On the weekly timeframe, there are also interesting levels to watch for potential buys:
— 50% of the trading range — 100,353 (which also aligns with the 50% monthly level);
— the base of the breakout move from the range — 98,200.
Of course, this all depends on whether the buyer actually shows up — with volume and spread.
This 100,500–98,000 zone remains an important buyer defense area if they intend to keep the price from dropping below 90,000.
Wishing you profitable trades!

DXY: Sellers Take ControlHi traders and investors!
This analysis is based on the Initiative Analysis concept (IA).
The US Dollar Index (DXY) formed a sideways range on the daily timeframe at the end of June. The seller’s initiative is now active, with a target at 96.767.
Before that, there was a buyer initiative, and we can see that at the end of it, there was a manipulation around the 98.640 level.
A buyer attack occurred on high volume, but the sellers absorbed the buyer’s attack candle and pushed the price downward on October 15.
The price may return to retest either 98.65 - 98.35 area. However, the main movement on the Dollar Index remains downward.
Wishing you profitable trades!

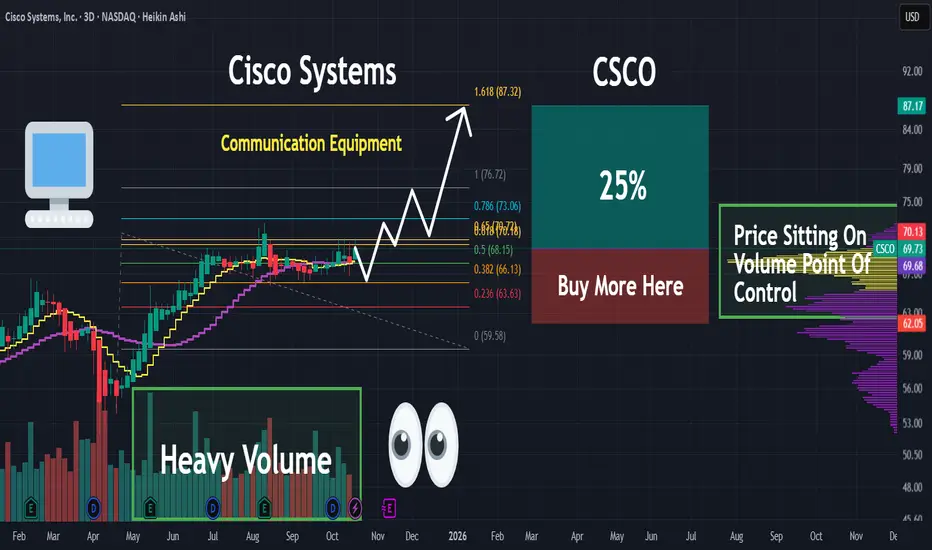
CSCO | Approaching Dot.Com Bubble High | LONGCisco Systems, Inc. engages in the design, manufacture, and sale of Internet Protocol-based networking products and services related to the communications and information technology industry. The firm operates through the following geographical segments: the Americas, EMEA, and APJC. Its products include the following categories: Secure, Agile Networks, Internet for the Future, Collaboration, End-to-End Security, Optimized Application Experiences, and Other Products. The company was founded by Sandra Lerner and Leonard Bosack in 1984 and is headquartered in San Jose, CA.
MRVL | Another Semi Run Coming | LONGMarvell Technology, Inc. engages in the design, development, and sale of integrated circuits. Its products include data processing units, security solutions, automotive, coherent DSP, DCI optical modules, ethernet controllers, ethernet PHYs, ethernet switches, linear driver, PAM DSP, transimpedance amplifiers, fibre channel, HDD, SSD controller, storage accelerators, ASIC, and Marvell government solutions. It operates through the following geographical segments: United States, Singapore, Israel, India, China, and Others. The company was founded by Wei Li Dai and Pantas Sutardja in 1995 and is headquartered in Wilmington, DE.

LTCMy view of where litecoin is heading
I think we can see a low of 0.0007 ish and the upward momentum can be huge !
Let's see how this play's out

EBAY | This Retail Business Will BOOM | LONGeBay, Inc. is a commerce company, whose platforms include an online marketplace and its localized counterparts, including off-platform businesses in South Korea, Japan, and Turkey, as well as eBay's suite of mobile apps. It offers a platform for various product categories, including parts and accessories, collectibles, fashion, electronics, and home & garden. eBay generates revenue mainly through fees from sales, payment processing, and advertising. The company was founded by Pierre Morad Omidyar in September 1995 and is headquartered in San Jose, CA.

Us30 Idea - Monday 20-10-2025US30 ANALYSIS
Supply - Red areas
Demand - Green areas
LVN (Low volume nodes) - Grey areas
H1 TIME FRAME
We are currently ranging in a 1hr Bearish PD array with price currently in the premium area (selling)- We have also swept External BSL. On the 5min TF we have swept a triple top into a previous LVN 46262. On the 5 min we have double bottom at 45865 holding SSL. demand also lies below this internal SSL as well as a minor demand area (45814) below it. A low volume node for the current bullish leg also lies in the demand area. We can expect one of 3 Scenarios.
Scenario 1.
We inverse the current 1 hr bullish fvg and sell to the SSL (45870) further to the LVN 45781. Thereafter we buy.
Scenario 2.
We inverse the current 1 hr bullish fvg and sell to the SSL (45870) further to the LVN 45781 and even further to 45540.
Scenario 3.
We respect the 1 hr FVG. Claim the LVN 46265 for a bullish run to 46485.
MAJOR DEMAND - 45542
MAJOR SUPPLY - 46485
LTF IQUIDITY
45865 - SSL
Most Likely Scenario.
Considering Daily Po3. Friday closed bullish. We can expect the new candle to print bullish as well (OLHC). This means we can see London Manipulate into the demand area and LVN as in Scenario 2, to then target the supply area at 46485.
Trading a range can sometime be tricky, hence we have to monitor positions at lower TF key levels until we break through major supply or major demand.

EVTL - Low Risk LongEVTL - Low Risk Long
Enter now with SL.
Exit 20% of position at each of 5 TPs.
Playing the old historic level, with local confirmations.
Volume increasing once this level was recaptured, indicated increased market participants.
Price also above daily 200 MA

Us oil possible Wyckoff accumulation?This count is based on my assumptions so anything can happen not a trading or financial advice just for educational purposes only kindly do your own ta thanks trade with care good luck.

USD/CAD Trade Alert🚨 USD/CAD Trade Alert 🚨
━━━━━━━━━━━━━━━━━━━
Type: 🔴 Sell Limit
Entry: 1.40120
Take Profit (TP): 🎯 1.39360
Stop Loss (SL): ❌ 1.40382
━━━━━━━━━━━━━━━━━━━
📅 Signal Time: 10 Oct 2025
📈 Status: Pending Activation
💡 Analysis: Price is currently below the entry level. Expecting a retracement toward the entry before sellers dominate, which could indicate the start of a bearish movement.


XRp On Long ( Cnagda Pure Price Action Test )Hello Our indicator shows XRP distribution. XRP has been in a downtrend for some time now, and it looks like it could rebound from here. We plan to go long here. You can learn how it works from the indicator description.
Time Frame - 1Hour
Entry - 2.173
Sl - 2.183
Tp 1 - 2.3294
tp2 - 2.4246
Selling volume has declined over the past eight hours, while bullish volume has increased. Several buyer traps have already been set, and now it appears the market is ready to reverse direction.

BNB: The Party's Over. Here's the Short Setup.Yo.
Quick-fire analysis on BNB/USDT, looking across the M15 to H4 timeframes. The market gave us a technical bounce, a relief rally for the amateurs. Don't be fooled. The party is over, and the bears are now in control.
The Setup
Let's recap the recent chaos. After last Friday's mass liquidation event, BNB staged an absurd rally, tapping a new ATH around 1375 within three days. Hope you survived the volatility. That move, however, was pure euphoria, completely detached from the broader market reality.
While BNB was flying, BTC showed extreme weakness, failing to reclaim any meaningful levels. This divergence was a massive red flag. It was inevitable that BNB's gravity-defying move would correct, and correct hard.
My setup is classic, no-nonsense technical analysis: multi-timeframe Fibonacci levels, a hard focus on volume profile, and a tactical eye on order flow. The blue Fib levels are drawn on the H4 chart (macro trend), and the red Fibs are for the M15 chart (micro trend since the Friday low).
What's Happening Now
The chart is screaming "SELL" at a major point of technical confluence. For anyone who can read price action, this is crystal clear.
After a first test yesterday, the critical 0.618 Fibonacci support on the H4 timeframe was decisively broken today, October 17th. This wasn't just any Fib level; it was perfectly aligned with the Point of Control (POC) from the entire last uptrend—the area with the highest traded volume. Losing this level means the bulls have lost their single most important line of defense. The structure is broken.
The Levels That Matter
We've already hit our first target at 1022, which corresponds perfectly to the 1.272 Fibonacci extension from the H4 structure. The playbook from here is simple. We are now watching for a pullback to reload short positions.
- Short Entry Zone: I'm watching for a weak pullback into the 1093 zone. This area represents the '1' point of the H4 Fib retracement and is the ideal spot to the bag. Any bounce to this level that shows signs of exhaustion is a gift.
- Invalidation (Stop Loss): The line in the sand is a clean break and hold above 1125. A move above this level would negate the current bearish market structure and signal that the downtrend is compromised.
- Targets: I’m reaching two price
- The 1.414 Fibonacci extension, which brings us to the $988 area.
- A full leg down to the 1.272 extension on the M15 Fib, targeting the $865 region. This level also aligns with the previous major low, making it a powerful magnet for price.
I'm not betting on hope; I'm trading the evidence. The evidence shows the path of least resistance is down. Let's see how it plays out. As always, don't get rekt.

CVE — Swing Trade💰 CVE — Swing Trade Breakdown
🏢 Company Snapshot
CVE (Cenovus Energy Inc.) is a Canadian integrated energy firm active in oil sands, conventional, refining, transportation, and marketing. The stock has traction now due to elevated energy prices, tightening supply, and its ongoing M&A with MEG Energy (bid recently sweetened).
📊 Fundamentals
P/E: ~17× (vs oil & gas peers ~15–20×) — in line, not overly stretched
Google
+1
P/B: ~1.5×–2× (modest premium, consistent with energy sector norms) — decent balance sheet multiple
Debt/Equity: moderate (levered but manageable given cash flow)
ROE: mid-teens % (reflecting solid profitability for the sector)
Dividend Yield: ~3.3% — yields plus growth angle in energy exposure
Google
+3
Investing.com
+3
StockAnalysis
+3
Summary: Sector-aligned valuation, decent income buffer, acceptable leverage in a strong commodity backdrop.
📈 Trends & Catalysts
Revenue growth: stable to modestly rising (benefits from upstream + refining mix)
EPS trend: relatively steady with occasional volatility — recent quarters deliver modest beats
Balance sheet: steady cash flow; potential debt reduction if oil prices hold
Catalysts:
• MEG Energy acquisition resolution (bid escalation ongoing)
• Crude oil and natural gas price strength / OPEC supply signals
• Canadian energy sector rotation in seasonal demand cycles
Risks: valuation sensitivity to commodity downside, regulatory/tax changes, execution risk on M&A, emissions regulation headwinds
🪙 Industry Overview
Weekly: up modestly (energy sector in positive zone)
Monthly: outperforming broader TSX (rotation into energy)
12-month: outperformed general market on rising commodity tailwinds
Sentiment: Bullish — flow shifting into energy and resource plays as cyclical bets ramp
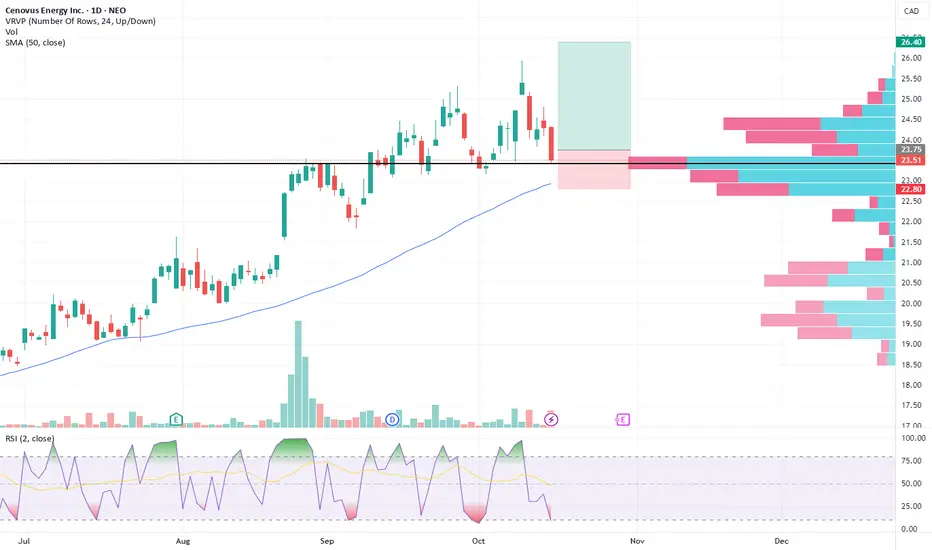
📐 Technicals
Price ≈ 24.20–24.50
50-SMA ≈ 22.50 (price above → trend favoring bulls)
RSI(2): ~12–18 (nearing oversold short term)
Pattern: bullish consolidation off rising support; possible flag / continuation setup
Support: 22.80 – 23.50
Resistance: 25.50 – 26.50
🎯 Trade Plan
Entry Zone: 23.80 – 24.40 on strength or pullback
Stop Loss: 22.80
Target: 26.40 (first leg), stretch 27.50
Risk/Reward: ~3× on base target
Alternate Setup: If breaks above 25.50 convincingly, use a retest as continuation entry
🧠 My Take
CVE offers a clean swing setup with mixed support from fundamentals and commodity strength. I favor initiating on a dip near support ahead of the next leg upward, capturing energy tailwinds while limiting downside via tight stop.

EUR/USD LONGEUR/USD Long Setup
Entry: 1.17450 Stop Loss: 1.17180 (–27 pips) Take Profit: 1.18020 (+57 pips)
Technical Rationale
The euro has just reclaimed a key value area and we’re seeing fresh conviction from buyers. On the 15min chart, price broke above the previous Point of Control around 1.1730, signaling a shift from accumulation into markup. Yesterday’s candle closed with above-average volume, confirming participation at these levels and reducing the risk of a false break. The Accumulation/Distribution indicator is trending higher, showing that money flow is firmly on the long side.


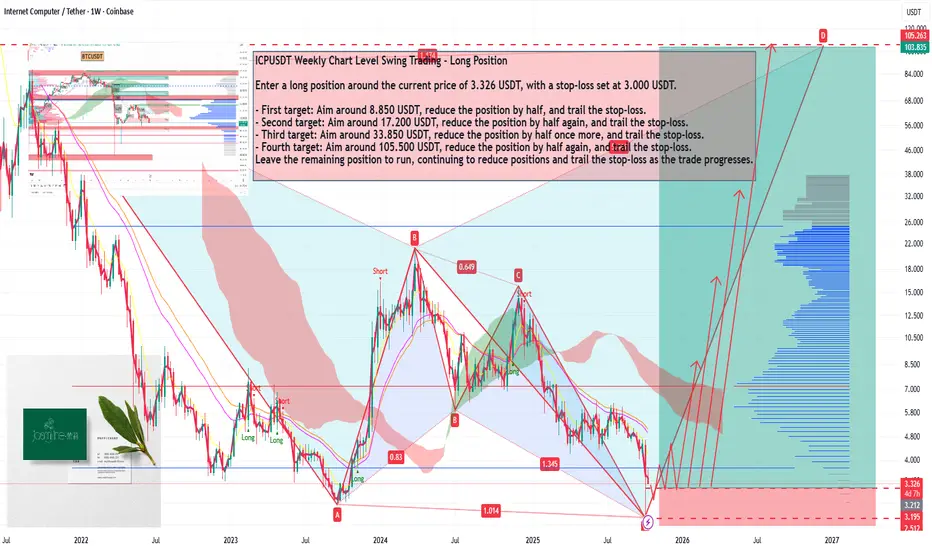
ICPUSDT Weekly Chart Level Swing Trading - Long PositionICPUSDT Weekly Chart Level Swing Trading - Long Position
Enter a long position around the current price of 3.326 USDT, with a stop-loss set at 3.000 USDT.
- First target: Aim around 8.850 USDT, reduce the position by half, and trail the stop-loss.
- Second target: Aim around 17.200 USDT, reduce the position by half again, and trail the stop-loss.
- Third target: Aim around 33.850 USDT, reduce the position by half once more, and trail the stop-loss.
- Fourth target: Aim around 105.500 USDT, reduce the position by half again, and trail the stop-loss.
Leave the remaining position to run, continuing to reduce positions and trail the stop-loss as the trade progresses.
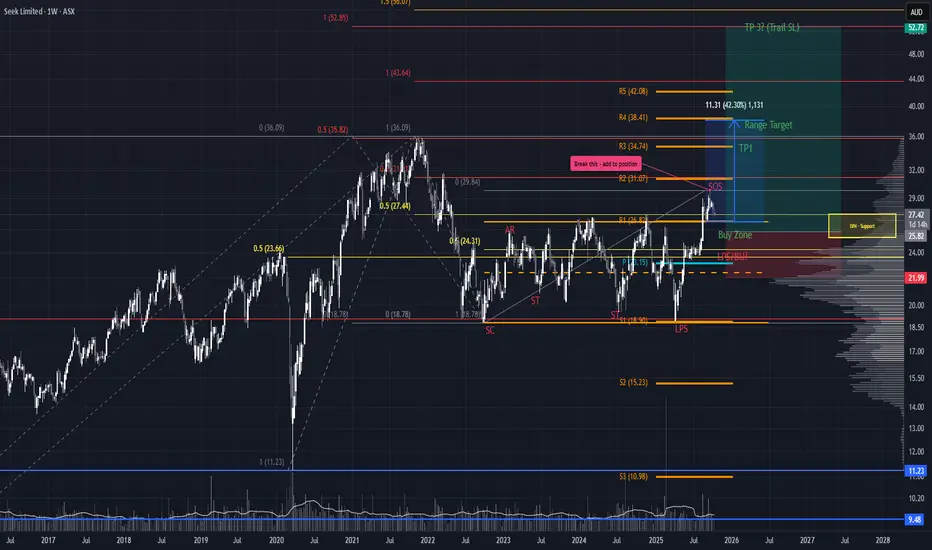
3-Year Breakout with LVN PrecisionSEEK has broken out of a multi-year range and is now testing the upper boundary to gauge buyer commitment. This is a critical zone. Price action here will reveal whether markup is ready to accelerate or pause for a reload.
Trade Scenario
Begin scaling in as price has reached the top of a Low Volume Node. This zone typically lacks price acceptance, so there is a strong chance of a brief dip before continuation. If price does pull back, monitor the buy zone for a second entry/scale in opportunity.
Risk management remains essential. Since a higher low has not yet formed, the stop loss should sit below the Last Point of Support. Once a new higher low is confirmed, the stop can be moved accordingly to lock in structure.
Targets
Initial target sits just below the all-time high
For extended upside, trail the stop loss using newly formed swing lows to capture continuation
MARA: shoulders done, now walk toward the targetOn the daily chart, MARA completed a textbook inverse Head & Shoulders reversal with a clear breakout above the descending trendline. A corrective pullback followed, and the price is now heading into the key buy zone at 15.21–15.77 - aligning with the 0.72 and 0.79 Fibonacci retracements, and the upper boundary of the broken channel. This is the area to watch for a potential continuation of the bullish impulse.
Volume on the breakout was above average, confirming strong buyer interest. The EMAs are trending below the price, supporting the upward structure. The first target is located at 21.57 (previous resistance), with a potential extension to 28.77 (Fibonacci 1.618).
Fundamentally, MARA remains highly correlated with BTC and crypto sentiment. As interest returns to crypto-related assets due to ETF flows and possible Fed easing, mining stocks like MARA gain attention. Recent reports also show improved production efficiency and lowered costs - a tailwind for bulls.
Tactically, the best setup would be a confirmed reaction from the buy zone — whether a strong candlestick formation, volume surge, or reclaim of a key level. If that happens, aiming for 21.57 and 28.77 becomes a solid plan.
The pattern played out - now it's time for the market to walk the talk.

XRPUSDT — consolidation before the next impulseOn the 1H chart, XRPUSDT is consolidating after a short pullback, forming a flag pattern above the 2.45 support area. Despite a few false breaks, buyers continue to defend the trendline, signaling demand absorption.
The 2.45–2.52 range remains pivotal. A breakout with confirmation could open the way toward 2.63 (Target 1) and 2.82 (Target 2) — the next supply zones. As long as the higher-low structure holds, the bullish scenario remains intact.
Fundamentally, XRP still shows resilience amid the broader altcoin weakness. Ripple’s ongoing expansion in cross-border payments and hopes for a clearer regulatory framework in the U.S. support investor confidence.
This is a classic accumulation phase — expectations may diverge from reality, but that’s where strong trends are born. Keep emotions aside and wait for a clean breakout signal.

How To Short Sell Using The 3-Step Rocket Booster StrategyYesternight i stood outside thinking
about the love of my life.
How she will look after my future daughter.
I thought about having a wife.How beautiful she will look,
how happy she will be looking
after me and the children
and how i will support her dreams and
the children's dreams.
Basically i was meditating man.
My thoughts lost in limbo.
That's how i like it.I want to be lost
Being lost is one of the best spiritual things
i have experienced.
Have you ever arrived home not sure
if that's your home?
Maybe i was too paranoid but that's
how i like it..
The market is full of fear, and learning how
to short sell is something not easy
But mastering how to short sell.
Has been one of the most
rewarding things ever.
Its basically the rocket booster strategy
but now in reverse.
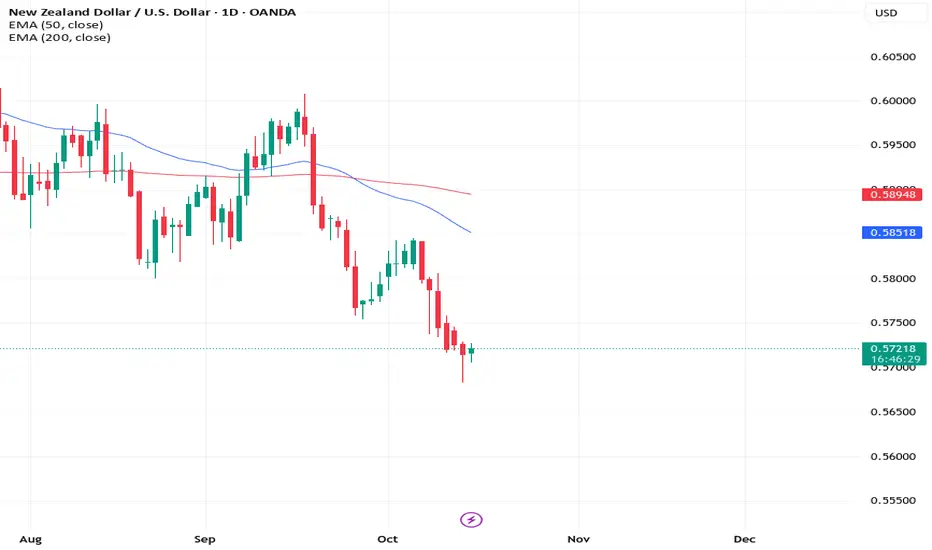
Step 1-The price should be below the 50 EMA
Step 2 -The price should be below the 200 EMA
Step 3- The price should trend downwards.
Now the rules of short selling
are counter intuitive -- as Tim Sykes says.
This means its the reverse.
In this chart the momentum is leaning
towards a breakdown pattern.
On a bullish hammer turning
into a spinning black top
showing you that there is extreme fear on this chart
The crash of this currency is as a result
of the tarrif wars.
Also the drop in the bond yeilds.
Learning how to short
sell is the best thing ever.
Learn how to short sell
this is you test to become a professional trader.
Rocket boost this content to learn more.
Disclaimer: Trading is risky please learn risk management
and profit taking strategies.Also feel free to use
a simulation trading account before you trade with real money.