What will happen given the tensions?As you know, the accumulation of military equipment in the Middle East has strengthened speculation about a potential conflict with Iran, and this is impossible to ignore. This alone provides a strong justification for the rise in gold, silver, and other key metals. Additionally, the uncertainty surrounding Greenland and ongoing geopolitical tensions further contribute to this trend.
Now, moving to the technical analysis: since the price has broken down from the descending wedge pattern, it could decline toward $83,000 , or even lower, potentially reaching $79,000 . This bearish movement is likely to continue as long as geopolitical tensions persist.
Best regards CobraVanguard.💚
Give me some energy !!
✨We spend hours finding potential opportunities and writing useful ideas, we would be happy if you support us.
Best regards CobraVanguard.💚
WAR


OIL What will happen given the tensions?Brent crude oil should reach around 70 dollars, and in my opinion, with rising tensions in the Middle East, it could even hit 80 dollars. There are two scenarios, and both would lead to higher oil prices. The first is that the United States might block Iran’s oil exports, which would push prices up. The second is the possibility of a war in the Middle East, which on its own would be a strong reason for energy prices—including oil—to rise.
From a technical perspective , the price is moving within a bullish flag or wedge pattern, which typically leads to an upward breakout and a continuation of the uptrend. Additionally, with the corrective waves coming to an end, we should expect the formation of new bullish waves.
Best regards CobraVanguard.💚

THE BRUTAL TRUTH ABOUT GOLD Stop listening to the "price targets." They are all BULLSHIT. 🚫
The current move in Gold is a once-in-history event. Nobody knows where the ceiling is because there is no ceiling in a system that's breaking.
📍 THE NUMBERS: $4k? $8k? $10k? It's all on the table.
📍 THE STRATEGY: If you’re holding, DO NOT LET GO. If you’re out, find your entry NOW.
THE WARNING: ⚠️
This isn't a "bull market" celebration. It’s a warning. The aggressive buying tells us that the whales think SOMETHING BIG is coming. This isn't about local skirmishes ( war between Iran and US , or Greenland )—it’s about a global shift that changes everything. 📉🌍
We’ve lived through enough "historic events" from Corona to wars. We all hope for peace, but GOLD is screaming that the storm isn't over.
Protect yourself. The numbers don't lie. 💎🙌
#GOLD #XAUUSD #MARKETALERT #THEBIGONE #FINANCE2026 #HOLD

OIL analysis, What will happen given the tensions ?The price is moving inside an ascending channel, which can push it higher. Now and in the future, as tensions in the Middle East increase, we should expect energy prices to rise. This upward pressure on prices will likely continue until the tensions come to an end.
Best regards CobraVanguard.💚
Give me some energy !!
✨We spend hours finding potential opportunities and writing useful ideas, we would be happy if you support us.

What will happen given the tensions?As you know, the accumulation of military equipment in the Middle East has strengthened speculation about a potential conflict with Iran, and this is impossible to ignore. This alone provides a strong justification for the rise in gold, silver, and other key metals. Additionally, the uncertainty surrounding Greenland and ongoing geopolitical tensions further contribute to this trend.
Now, moving to the technical analysis: since the price has broken down from the descending triangle pattern, it could decline toward $2630, or even lower, potentially reaching $2400. This bearish movement is likely to continue as long as geopolitical tensions persist.
Best regards CobraVanguard.💚
Give me some energy !!
✨We spend hours finding potential opportunities and writing useful ideas, we would be happy if you support us.

Weekly Market Outlook,Nifty, BankNifty,S&P 500Nifty closed the week at 25,694, almost flat vs last week, after making a high of 25,899 and a low of 25,473.
As discussed earlier, once again Nifty respected the broader range of 26,150–25,250, keeping the market in a balance phase.
This week’s candle reflects indecision — such structures often act as compression, and once price accepts beyond the range, moves can turn fast.
🔼 Nifty Upside
If Nifty manages to sustain above 25,811 on a 1-hour close, upside levels to watch:
25,900
26,000
26,150
Acceptance above this zone will be key.
🔽 Nifty Downside
If Nifty sustains below 25,600, downside levels open towards:
25,500
25,400
25,200
📌 Structure Summary
25,600–25,811 → balance zone
Above 25,811 → bullish acceptance
Below 25,600 → downside expansion
For now, broader range remains
👉 26,150 – 25,200, unless any major global trigger changes sentiment.
🏦 BankNifty View
BankNifty closed near an important fib zone around 60,092.
If it gives a consecutive close above 60,150, upside levels:
60,360
60,437 (ATH)
60,500
60,700
60,950
Broader range remains
👉 61,200 – 59,000.
🌎 S&P 500
Weekly candle remains indecisive.
Above 6,986 → 7,026 / 7,122
Below 6,885 → 6,780 / 6,700 / 6,469
⚠️ Final Note
Market remains volatile and range-bound.
In such phases, patience matters more than prediction.
Respect levels — let price decide direction.

XAUUSD Trading Outlook | Key Levels & Bias🧠 Technical Context for My Strategy
Gold prices are currently positioned at historically elevated levels, and the technical structure shows tight consolidation around major pivot zones. From experience, this type of compression usually leads to explosive moves once a clear breakout or breakdown occurs.
This is why I am patient and waiting for confirmation at my key alert zones.
🔥 Bullish Scenario (My Upper Alert Zone)
I will be bullish on gold if price convincingly breaks and closes above my upper alert zone.
My bullish expectation is supported by the following factors:
✅ Trend continuation potential:
Many analysts still view gold as being in a long-term uptrend, and when key resistance zones are broken, price often accelerates toward higher liquidity areas.
🔹 Strong central bank demand:
Central banks continue to accumulate gold, which provides sustained buying pressure and supports bullish breakouts.
🔹 Favorable macro fundamentals:
Expectations of lower real interest rates and a weaker U.S. dollar increase gold’s appeal as a safe-haven and inflation hedge, fueling upside momentum after a breakout.
🔹 Institutional and bank outlook:
Most institutional forecasts remain constructively bullish, with projections of gold reaching levels well above current prices if market structure holds.
📊 My Bullish Playbook
I enter after breakout and retest of my upper alert zone.
Targets are set at next resistance levels, with extended targets if macro catalysts remain supportive.
Stops are adjusted below confirmed breakout levels to protect capital.
As long as structure and macro conditions remain favorable, higher prices later in the year remain technically justified.
📉 Bearish Scenario (My Lower Alert Zone)
I will be bearish on gold if price breaks and closes below my lower alert zone.
From a technical standpoint, this scenario becomes valid for the following reasons:
❗ Loss of key support:
Failure to hold major support levels often signals a shift in market sentiment. Sustained breakdowns can trigger aggressive selling and deeper pullbacks.
🔻 Bearish technical risk:
When key support zones are lost, price typically moves quickly toward lower liquidity areas, producing extended bearish legs.
🔻 Bearish macro catalysts:
A strong U.S. dollar or hawkish monetary policy surprises can reduce gold’s attractiveness and add pressure to the downside.
📊 My Bearish Playbook
I wait for clear confirmation below the lower zone, ideally with strong volume.
Targets are based on next structural support levels.
Protective stops are placed above minor resistance zones to avoid sharp whipsaws.
While gold is a long-term safe haven, short-term bearish moves can be strong when structure fails.
🧩 How My Alert Zones Fit Market Reality
My strategy is based on key support and resistance breakout monitoring, which is extremely effective in volatile markets like gold.
📌 If My Bullish Signal Triggers
Gold historically produces strong rallies when major resistance levels are broken, especially during periods of macro uncertainty.
Institutional players and central banks often increase exposure during such conditions, supporting continuation moves.
📌 If My Bearish Signal Triggers
A clean breakdown below support usually signals a short-term structural shift, opening the door for selling pressure and deeper retracements.
Bearish moves can be intensified during periods of dollar strength or unexpected policy tightening.
🧠 Key Trading Rules I Follow (And Teach)
✔ I wait for a full candle close outside my alert zones — not just wicks
✔ I use volume confirmation to validate breakouts and breakdowns
✔ I monitor macro events (Fed decisions, USD strength, geopolitical risk)
✔ I keep risk management tight at all times
🧾 Final Summary
📈 Bullish Case (Break Above My Upper Alert Zone):
Aligns with trend continuation
Supported by safe-haven demand, macro tailwinds, and institutional flow
Confirmed breakouts often lead to strong upside expansion
📉 Bearish Case (Break Below My Lower Alert Zone):
Signals a shift in short-term market structure
Opens room for deeper pullbacks toward lower supports
Becomes valid when macro conditions turn less supportive

We would buy quite a lot of NATGAS when $2 levels are reachedWe hope the price will go down so we can buy cheaper

The Imminent U.S.–Iran Crisis: A Real-Time Analytical AssessmentDate of Analysis: Friday, November 7, 2025
Overview
The following is a condensed version of a dynamic strategic discussion between an intelligent user and an AI assistant. The analysis aimed to decode the hidden layers of a potentially imminent military crisis in the Middle East through real-time observation of geopolitical developments.
Introduction: Initial Hypothesis and the Major Shift
The analysis initially rested on the assumption that following the “12-Day War” (June 2025), the region was in a fragile ceasefire. The central question was when the “second round” of conflict might begin. It was correctly identified that Israel’s main constraint was a shortage of defensive missiles.
Turning Point:
Assuming four months had passed since the first war, it was concluded that the logistical bottleneck (missile defense shortage) had likely been resolved. This invalidated earlier timelines predicting renewed conflict by December and instead shifted the danger window to November—the current month.
Part I: The Strategic Deception (Iraq and Venezuela as Cover)
Attention then turned to a wave of simultaneous “crisis signals”: rising talk of “a U.S. conflict with Venezuela” and “U.S. warnings to Iraq.”
Assessment:
These were identified as elements of a classic deception operation, intended to divert the attention of the media, diplomats, and, most importantly, Iran’s intelligence and defense systems away from the real target. This served as a perfect cover for preparing a strike on Iran.
Part II: Breakdown of the Deception and Loss of Surprise
Key Insight (User’s Observation):
The user correctly noted that this deception had failed. With “war with Iran” trending again in global media and official warnings escalating, Iran was no longer complacent—it had entered maximum alert.
This fundamentally changed the dynamics. The element of surprise, the attacker’s greatest asset, was now entirely lost.
Part III: The “Forced Hand” Scenario
When surprise evaporates, what can the attacker (the U.S. and Israel) do next?
Analysis:
The attacker is now trapped in a strategic stalemate:
Cost of Attrition: Maintaining full-scale military readiness for both sides is expensive, stressful, and unsustainable.
Risk of Delay: Every passing hour allows Iran to disperse and conceal its strategic assets (missiles, drones), making target acquisition harder.
Point of No Return: The use of Venezuela and Iraq as covers was the equivalent of cocking a rifle—any retreat now would amount to a catastrophic strategic humiliation for the U.S.
Time-Based Conclusion:
Since the deception failed and surprise is gone, the attacker is effectively compelled to act. They must launch the attack before their forces degrade further and before Iran becomes even more fortified.
New Urgent Window: Within 24 to 72 hours (this very weekend).
Part IV: The Hidden Economics of War — Why “Crisis” Becomes a “Solution”
In the final stage, the focus shifted from “when” to “why”, exploring the economic motives driving the potential escalation. The analysis suggested that this war could serve as a planned economic reset to address U.S. domestic challenges.
Global Economic Shock:
The immediate aftermath of an attack would be a spike in oil prices (estimated to surpass $150 per barrel within 24 hours) due to disruptions in the Strait of Hormuz and Iranian retaliation—triggering global stagflation.
Dollar Strength (Flight to Safety):
During such turmoil, global investors would flee risky assets (like crypto, which had already pre-priced a downturn) and rush into U.S. dollars, causing the DXY index to surge.
Domestic Political and Economic Diversion (Wag the Dog Effect):
This crisis would allow the U.S. government to:
Deflect attention from domestic debt and weak economic indicators (e.g., PMI and recession risks).
Reignite the military-industrial complex, boosting GDP through massive arms sales to regional allies and internal consumption.
Justify inflation by attributing it to “geopolitical instability and rising oil prices” rather than past monetary policies.

Bitcoin Daily Analysis – October 22, 2025🟠Bitcoin remains in a phase of uncertainty, with market sentiment heavily influenced by global macro events. Developments around interest rate decisions, U.S.–China tariff policies, and ongoing geopolitical tensions in the Middle East could all play a decisive role in shaping Bitcoin’s next move.
🕰️ In this phase, patience is the key to success — avoid rushing into large positions until we see clearer confirmation of trend direction and market risk appetite.
🎯 Until the broader trend becomes more defined, traders can take advantage of short-term long and short triggers on lower timeframes, while maintaining strict risk management and discipline.
Disclaimer:
This content is for informational purposes only and does not constitute financial or investment advice. © DIBAPRISM
Larry D.Kohn

Types of Global Trade WarIntroduction
A global trade war occurs when nations impose tariffs, quotas, or other trade barriers against each other in retaliation for perceived unfair trade practices. These conflicts often stem from disputes over trade imbalances, currency manipulation, intellectual property theft, or protectionist policies. In a world where globalization has tightly interconnected economies, trade wars can have far-reaching consequences—affecting industries, consumers, financial markets, and diplomatic relations.
Trade wars are not new. From the Smoot-Hawley Tariff Act of 1930 in the United States to the U.S.-China trade conflict that began in 2018, the concept has evolved alongside the global economy. Today’s trade wars extend beyond simple tariff disputes to include technology restrictions, digital trade barriers, and strategic economic decoupling. Understanding the types of trade wars helps explain how economic competition shapes global power dynamics.
1. Tariff-Based Trade Wars
Definition
Tariff-based trade wars occur when countries impose import duties (taxes) on foreign goods to protect domestic industries or punish other nations. These tariffs make imported goods more expensive, discouraging their purchase and promoting local alternatives.
Characteristics
Involves direct taxation on goods crossing borders.
Often used as retaliation for another nation’s tariffs.
Creates immediate effects on global prices and supply chains.
Examples
U.S.–China Trade War (2018–2020): The United States imposed tariffs on over $360 billion worth of Chinese imports, while China retaliated with tariffs on U.S. agricultural and industrial products.
EU–U.S. Steel and Aluminum Dispute (2018): The U.S. imposed tariffs of 25% on steel and 10% on aluminum imports, claiming national security reasons. The European Union retaliated with tariffs on American goods like motorcycles and whiskey.
Impact
Tariff-based wars often lead to:
Increased consumer prices.
Disrupted supply chains.
Decreased global trade volumes.
Shifts in investment and manufacturing to non-tariff countries.
2. Non-Tariff Barrier Trade Wars
Definition
A non-tariff trade war uses regulatory restrictions instead of tariffs to limit trade. These may include import quotas, licensing requirements, product standards, or environmental regulations that disadvantage foreign companies.
Characteristics
Harder to identify and measure than tariffs.
Often justified as “safety” or “environmental” measures.
Can be used strategically to block competition.
Examples
Japan vs. U.S. Auto Disputes (1980s): Japan used strict safety and emissions standards to limit American car imports.
European Union’s Agricultural Rules: The EU’s regulations on genetically modified foods and pesticide use often act as barriers against U.S. agricultural exports.
Impact
Creates uncertainty for exporters.
Increases compliance costs.
Favors domestic industries under the guise of regulation.
3. Currency Manipulation and Exchange Rate Wars
Definition
Currency wars, also known as competitive devaluation, occur when countries intentionally devalue their currencies to make exports cheaper and imports more expensive, thus improving their trade balance.
Characteristics
Typically involves central banks or monetary authorities.
May lead to inflation or financial instability.
Can escalate into broader economic and geopolitical conflict.
Examples
China’s Yuan Policy (2000s): The U.S. accused China of keeping its currency artificially low to boost exports.
Global “Currency War” of 2010: Countries like Japan and Brazil intervened in foreign exchange markets to weaken their currencies after the U.S. Federal Reserve launched quantitative easing.
Impact
Encourages retaliatory devaluations.
Destabilizes global currency markets.
Reduces investor confidence.
May trigger capital flight from emerging markets.
4. Technology and Digital Trade Wars
Definition
In the 21st century, technology trade wars have emerged as a new front in global economic competition. These involve restrictions on data, technology exports, intellectual property rights, and the dominance of tech giants.
Characteristics
Focuses on control of strategic technologies like semiconductors, AI, and 5G.
Often framed as national security or data protection issues.
Targets specific companies rather than entire industries.
Examples
U.S.–China Tech Conflict: The U.S. restricted companies like Huawei and ZTE from accessing American technologies, citing security concerns. It also banned chip exports to China for advanced computing.
EU Digital Services Act (DSA): The European Union has imposed strict digital market regulations, often seen as targeting U.S. tech firms such as Google, Meta, and Amazon.
Impact
Fragmentation of global technology supply chains.
Slower innovation due to reduced collaboration.
Strategic decoupling between the U.S. and China in the semiconductor and AI sectors.
5. Resource and Commodity Trade Wars
Definition
These wars focus on critical natural resources—such as oil, gas, rare earth metals, or food—used as economic or political leverage.
Characteristics
Resource-rich nations restrict exports to gain political influence.
Import-dependent countries seek diversification or self-sufficiency.
Often intertwined with geopolitical tensions.
Examples
OPEC Oil Embargo (1973): Arab nations cut oil exports to the U.S. and other Western countries supporting Israel, leading to a global energy crisis.
China’s Rare Earth Export Controls (2010): China restricted exports of rare earth minerals crucial for electronics, targeting Japan after a territorial dispute.
Russia–Europe Gas Conflict (2022): Following the invasion of Ukraine, Russia reduced gas supplies to Europe, triggering an energy crisis and forcing European nations to find alternatives.
Impact
Sharp commodity price fluctuations.
Inflationary pressures globally.
Strategic realignments in energy and resource supply chains.
6. Agricultural and Food Trade Wars
Definition
Agricultural trade wars arise when countries impose restrictions or subsidies on food and farm products to protect domestic farmers or retaliate against other nations’ policies.
Characteristics
Often involves perishable goods like grains, meat, and dairy.
Highly political due to its effect on farmers and food security.
Influenced by health, safety, and environmental standards.
Examples
U.S.–EU Beef Hormone Dispute: The EU banned beef treated with growth hormones, while the U.S. claimed this violated World Trade Organization (WTO) rules.
India’s Rice and Wheat Export Bans (2022–2024): India limited exports to control domestic prices, impacting global food markets.
U.S.–China Agricultural Tariffs: China imposed tariffs on U.S. soybeans during the 2018 trade war, hurting American farmers.
Impact
Global food price volatility.
Disruption of agricultural supply chains.
Rising risk of food insecurity in developing nations.
7. Sanctions and Trade Embargoes
Definition
Trade sanctions and embargoes are political tools where nations restrict trade with specific countries to pressure them into policy changes. These are often unilateral or coalition-based rather than purely economic measures.
Characteristics
Used as instruments of foreign policy.
Target sectors like defense, energy, or finance.
Can be partial (targeted sanctions) or complete (full embargo).
Examples
U.S. Sanctions on Iran: Targeted Iran’s oil exports and financial transactions to curb its nuclear program.
Western Sanctions on Russia (2022): Following the invasion of Ukraine, Western nations imposed sweeping sanctions on Russian banks, oil companies, and oligarchs.
Cuba Embargo: The U.S. trade embargo on Cuba, in place since the 1960s, remains one of the longest-running in history.
Impact
Severe economic damage to targeted countries.
Global supply chain disruptions.
Emergence of black markets and sanction evasion networks.
8. Subsidy and Dumping Wars
Definition
Subsidy wars occur when governments financially support domestic industries to make their products cheaper internationally. Dumping happens when a country exports goods at below-market prices to gain unfair advantage.
Characteristics
Violates fair trade principles under WTO rules.
Leads to retaliatory tariffs and anti-dumping duties.
Common in sectors like steel, solar panels, and agriculture.
Examples
China’s Steel and Solar Subsidies: China has been accused by the U.S. and EU of subsidizing its steel and solar industries, flooding global markets.
Boeing vs. Airbus Dispute: The U.S. and EU accused each other of illegally subsidizing their aerospace giants, leading to WTO arbitration.
Impact
Market distortions and overcapacity.
Trade tensions within global manufacturing networks.
Long-term damage to fair competition.
9. Digital and Data Sovereignty Trade Wars
Definition
Digital trade wars revolve around data localization, privacy laws, and control over digital infrastructure. Governments use these measures to assert sovereignty over cyberspace and digital economies.
Characteristics
Focuses on control of citizens’ data and digital ecosystems.
Involves laws restricting cross-border data flows.
Part of broader efforts to reduce dependency on foreign technology.
Examples
EU’s GDPR (General Data Protection Regulation): Imposes strict data rules affecting U.S. tech companies operating in Europe.
India’s Data Localization Policy: Requires foreign companies to store user data locally, creating tensions with the U.S. tech industry.
China’s Cybersecurity Law: Restricts foreign companies’ access to Chinese digital markets.
Impact
Fragmentation of the global internet (“splinternet”).
Rising compliance costs for tech companies.
Reduced cross-border digital innovation.
10. Environmental and Green Trade Wars
Definition
As nations transition toward sustainable economies, green trade wars arise when environmental policies create new trade barriers or advantages.
Characteristics
Based on carbon emissions, climate regulations, and renewable technologies.
Can penalize “dirty” industries or reward green production.
Intersects with industrial and climate policy.
Examples
EU Carbon Border Adjustment Mechanism (CBAM): Imposes tariffs on imports from countries with weaker climate regulations.
U.S. Inflation Reduction Act (2022): Offers subsidies for domestic clean energy industries, criticized by the EU as protectionist.
China’s Solar Dominance: Accusations of unfair advantages in solar manufacturing due to state subsidies.
Impact
Reshapes global energy and industrial competition.
Encourages climate-friendly innovation.
Risk of conflict between developed and developing nations over “green protectionism.”
Conclusion
Global trade wars have evolved from simple tariff disputes to multifaceted economic conflicts involving technology, digital data, energy, and environmental policy. Each type—whether tariff-based, technological, or green—reflects deeper struggles for economic dominance, national security, and strategic autonomy.
While trade wars may provide short-term domestic protection, they often harm global growth, increase inflation, and reduce consumer welfare. Modern economies are too interconnected for isolationist strategies to succeed without consequences. The challenge for policymakers lies in balancing national interests with global cooperation—ensuring that competition fosters innovation rather than conflict.
Ultimately, understanding the types of global trade wars helps policymakers, investors, and citizens grasp how economic rivalries shape the future of globalization, technology, and international relations.
ETH - Buy the Confluence, Not the DipPrice is pulling back into a chunky demand block that overlaps the rising channel’s lower trendline and the correction’s (falling wedge) lower rail—a classic confluence.
As long as this intersection holds, I expect the up-trend to resume from here.
My plan is simple: wait for a bullish rejection, then ride the bounce.
If it triggers, I’ll look up into ~4,350 → 4,600 → 4,900. The setup is invalidated on a decisive daily close below the zone and trendline, which would open a deeper mean-reversion toward ~3,500 → 3,250 first.
⚠️ Disclaimer: This is not financial advice. Do your own research and manage risk.
All Strategies Are Good; If Managed Properly!
~Richard Nasr

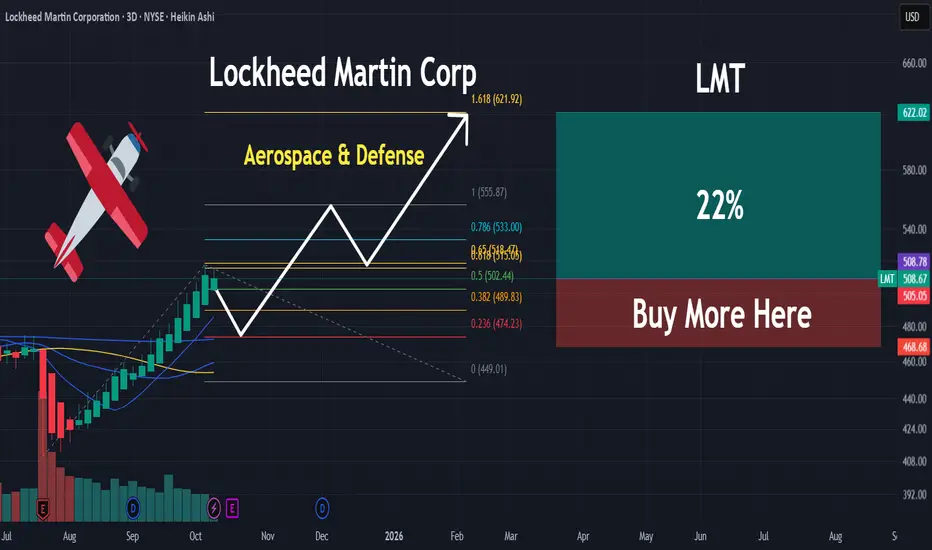
LMT | Lockheed Martin Could Rise Higher | LONGLockheed Martin Corp. is a global security and aerospace company, which engages in the research, design, development, manufacture, integration, and sustainment of technology systems, products, and services. It operates through the following business segments: Aeronautics, Missiles and Fire Control (MFC), Rotary and Mission Systems (RMS), and Space. The Aeronautics segment researches, designs, develops, manufactures, integrates, sustains, supports, and upgrades advanced military aircraft, including combat and air mobility aircraft, unmanned air vehicles, and related technologies. The MFC segment is involved in air and missile defense systems, tactical missiles and air-to-ground precision strike weapon systems, logistics, fire control systems, mission operations support, readiness, engineering support and integration services, manned and unmanned ground vehicles, and energy management solutions. The RMS segment designs, manufactures, services, and supports various military and commercial helicopters, surface ships, sea and land-based missile defense systems, radar systems, sea and air-based mission and combat systems, command and control mission solutions, cyber solutions, and simulation and training solutions. The Space segment includes the production of satellites, space transportation systems, and strategic, advanced strike, and defensive systems. The company was founded in 1995 and is headquartered in Bethesda, MD.
War is a Racket | DFEN | Long at $28.00The war machine keeps turning. Profits will reign. Direxion Aerospace and Defense 3x AMEX:DFEN never fully recovered from pandemic lows, but world peace is (unfortunately) far from reach. The uptrend in the chart has commenced. Personal entry point at $28.00.
Target #1 = $37.00
Target #2 = $50.00
Target #3 = $64.00

GoldGold usd daily analysis
Time frame daily
Risk rewards ratio >2.3
If we don't hear any news about war in middle east or Russia, I think gold come down to 2780$ area
Then, may be we have a war and new high for gold

CNY/USD Trend since 06 2007. Channel. Reversal zone.Logarithm. Time frame 1 week. At the moment, the currency is stronger than the dollar.
The main trend is a descending channel. The price is in it now.
Secondary trend — breakout of the descending trend line. Price growth to the median of the channel, and in case of its breakthrough, to the resistance. If not, then a pullback to the lower zone of the channel.
Local trend — The nearest events and news background, which can affect (not necessarily) locally (movements to the median of the channel, i.e., the middle, if it is positive) on the yuan rate. This, in less than 1 month, namely from October 22 to 24, 2024 will be held 7.16 XVI BRICS summit (short for Brazil, Russia, India, China, South Africa) in Russia in Kazan.
Line graph for visualization.

BTC & USDT.D => Bullish Correction Incoming?Hello TradingView Family / Fellow Traders. This is Richard, also known as theSignalyst.
Both BTC and USDT.D are sitting around key rejection zones.
💰 BTC is hovering near the $100,000 level — a major previous low and a psychological round number.
📊 Meanwhile, USDT.D is testing the 5% resistance — a supply zone and another critical round number.
As long as $100,000 holds as support on BTC and 5.1% holds as resistance on USDT.D, we could expect a bullish correction across the crypto market.
What do you think? Will these levels hold or break? 🤔
📚 Always follow your trading plan regarding entry, risk management, and trade management.
Good luck!
All Strategies Are Good; If Managed Properly!
~Rich

ETH Building Blocks - Keep it Simple🧱 Building Block - ETH Weekly Analysis 🧱
Ethereum has been trading within a well-defined structure, respecting key horizontal zones — each acting as a crucial building block in ETH’s macro journey.
🔹 Zone 1 ($1,700 - $2,100)
A strong demand and accumulation zone. ETH bounced from here multiple times, proving itself as the foundation of the current bullish attempt.
🔹 Zone 2 ($2,400 - $2,600)
We're currently hovering around this key mid-range resistance. A successful break above it would pave the way for the next major leg up.
🔹 Zone 3 ($2,900 - $3,400)
A major historical resistance turned supply area. ETH needs strong momentum and volume to break through this ceiling.
🔹 Zone 4 ($3,800 - $4,200)
The final building block before retesting ATH territory. A retest here could signal full bullish control in the coming months.
📍 As long as Zone 1 holds, ETH remains structurally bullish. Watch for breaks and rejections at each building block to gauge the next move.
Which block will ETH break next? 🔮
📚 Always follow your trading plan regarding entry, risk management, and trade management.
Good luck!
All Strategies Are Good; If Managed Properly!
~Rich

BTC is Back in Price Discovery Mode — Targeting $140K!After a clean break above the previous all-time high, Bitcoin has officially entered a new impulse phase, trading within a steep rising channel.
The green zone around the previous ATH is now acting as a strong support zone, confirming the shift in market structure.
🟠 The macro trend remains intact, and bulls are clearly in control.
🌀 Corrections continue to offer opportunities for trend-following entries, and if momentum holds, BTC could be on its way toward the $140,000 mark — the upper boundary of the macro channel.
Until then, every dip is a gift in this bullish cycle. 🔥
🧠 Trade with the trend. Manage your risk. Stay ready.
📚 Always follow your trading plan regarding entry, risk management, and trade management.
Good luck!
All Strategies Are Good; If Managed Properly!
~Richard Nasr

Do you think I'm joking ???The price is currently forming the second corrective wave, and a slight price drop to reach higher levels is normal.
Best regards CobraVanguard.💚

War news are actually good news for Crypto & GoldI Love Global Peace and hope all Wars end soon.
Here are my thoughts about Crypto when war Starts between two countries or more.
i think After wars so many reasons will help Crypto to see gain specially for Bitcoin which is the King of this market.
Some of the major Reasons in my view are:
A. Countries currency or Markets start to fall :
Usually with starting of war, we have two countries that are involved and due to negative effects of war on different Economic parameters cause weaker country or both currencies lose the power of Their currencies and it start To dump.
weak countries Bank can get hacked or worst scenario a countries currency can get 0 by the time.
most of the times Their stock markets also Face with huge losses.
B. People start to Buy more Gold or Bitcoin and ...
with things mentioned above and other reasons their People start to Buy more Crypto usually and Metals like Gold.
C. People start to migrate to other countries with their Crypto Wallets Only
Some start to leave their countries and Sell their Cars homes and ... and turn them to BTC or... and transfer their money and life to a peaceful country.
D. Spies and bribery gets more in those countries which all is done with Crypto usually
Corruption & Spy jobs and ... increases in those countries usually and the money on this Fields usually transfer Via Crypto or Gold and Silver which is harder to track.
And with these reasons which mentioned Above usually in the past all the Attention comes to Metal like Gold and the Value of it increase in Wars, but now Days Bitcoin(&Crypto Tokens) also gets more value and attention in war in my personal View and See gain in price too.
DISCLAIMER: ((trade based on your own decision))
<<press like👍 if you enjoy💚

Cautious — this Chart is Slippery!Hello TradingView Family / Fellow Traders. This is Richard, also known as theSignalyst.
🛢️After surging by over 35% in the past two weeks, USOIL took a hit following Trump's announcement of a ceasefire between Iran and Israel.
However, from a technical perspective, USOIL is approaching a strong daily support zone marked in red.
As long as this support holds, the bulls remain in control.
📊The next bullish impulse will be confirmed upon a break above the last minor high marked in blue.
In such a scenario, a move toward the supply zone (also marked in red) would be expected.
📚 Always follow your trading plan regarding entry, risk management, and trade management.
Good luck!
All Strategies Are Good; If Managed Properly!
~Rich
