BTCUSD Elliott Wave Forecast - Wave 3 Price PredictionHello all,
First and foremost, well done to everyone who has hodled through the bear run. It has most definitely been a true test of an individual's investor stamina.
As promised, it's time to take a closer look at wave 3 with the view of establishing more accurate price forecasts. In my previous ideas, I had initially provided rough counts for wave 3 to be between $33 - $38k with a possible extension into the $50k zone (please see linked ideas below).
Bitcoin is in pure price discovery mode with no level above to target as previous support or resistance. How high can it go? In my opinion, 24.3k is the next short term price level to challenge. A successful break of that level could very easily propel BTC towards my initial Wave 3 projection of 29.8k - 31.7k.
The FOMO and publicity it attracts has meant that BTC has developed a tendency to overshoot in bubble like fashion over the years. That being said, I feel that there is a high probability that BTC can achieve a Wave 3 extension level. The first of these extended Wave 3 projections is at 36.2k. There are two further extended projections, more on those level later.
Follow for further updates. Your 'likes' are much appreciated and your comments are most welcomed. I'm interested in seeing what your price forecasts are.
Thank you for taking the time. Trade safe and always remember to plan your trade and trade your plan!
Beyond Edge
Disclaimer
This is not trading advice. All content/ information shared in this idea is purely educational in nature and is expected to be used for analysis and illustration purposes only.
Do not trade or speculate based solely on the information provided. Trust your own analysis.
Beyond Edge
Wave3


Compra: PRIO3 - Início de onda 3 / Buy: PRIO3 - Start of Wave 3Compra de PetroRio PRIO3
Ao finalizar a onda C da 2 e começar a Onda 3 com uma puxada vigorosa. Espero rompimento do topo pré Corona Virus.
Long PetroRio PRIO3
Upon completion of Wave C of 2 and start of Wave 3 with a vigorous thrust. We should see new highs from the previous pre Corona Virus top.


|wave5 of 3rd of a Third of a 3rd|elliotwave|WAVE3*UPDATED*LONG|As the title suggests, here is the updated chart of my third of a third of a third elliot wave hypothesis.
Expect a near vertical rally from todays low, as we are within a sub-wave3 of the first wave 5 having completed the larger degree wave 4 of the even larger wave 3.
Next will be consecutive wave 4 wave 5 wave 4 wave 5 of higher degrees to complete the entire pattern sometime this Spring.
Feel free to ask any questions.

GBPUSD - WAVE 3 Potentially Complete - Get Ready To SELLThis ticks all the boxes for a wave 3 completion using Elliott Wave theory.
Wave 3 has ended near the 1.618% FIB extension with an inverted hammer candle on the daily time frame.
There is a trend line support on the 1 hour time frame. Trading plan is to wait for a breakdown before entering a sell position.
Any thoughts or comments please let us know.

MARKET COMPLETING WAVE 3Based on Elliot wave theory, the ENTIRE market is nearing its completion of the 3rd wave. This coincidentally will happen just as the IWM is completing its full 100% retrace from lows which also follows elliot wave rules. The range to look for is $360-$365 with the mean target being $362. Everyone knows the entire market is beyond parabolic and way overvalued. there is not a single company that is not trading at a "fair value." eventually the rug will be pulled. Once wave 3 starts, we head into wave 4 which should bring us down to a minimum of $250 with a possible extension down to $200. This wave 4 will most likely follow the pattern of wave 2 with roughly 10 years of sideways consolidation. Meaning it can be a complex wave 4 having swings from $360 to $200. Once wave 4 is complete, we head into wave 5 which should easily carry SPY to above 500.

Likely 700 point drop looming, but this is very bullishI continue to run more models. My models are like the cones of uncertainty when forecasting hurricanes. The more data that comes in changes the cone. In this case, this chart is completely different from the one 2 weeks ago. That one saw the end of Grand Supercycle 1, this one still has us in the final Cycle wave 5. This model also projects Grand Supercycle wave 1 will not end until early-mid 2022, but more will be published on that later. My prior model was not completely wrong as the major crash is looming, it is now just delayed for another 18 months or so.
This chart is using similar models to project Intermediate waves 3, 4, & 5 (which are annotated in the white text) and another one to project Primary waves 1 & 2. The end location for Intermediate wave 3 is based on 110 data points. It is even possible this wave 3 ended with the close of trading yesterday which could start a 150-200 point drop over the next 7-13 days.
Intermediate wave 4's end dates and points are separately based on 150 data points. Wave 4's have an average and median drop of around 41% the entire movement of wave 3. Wave 4 will give way to a nice jump slated to top right before election day in the U.S. Intermediate wave 5 is based off of 190 data points and tends to be the most accurate in all of the models I run.
The end of Intermediate wave 5 is also the end of Primary wave 1. There is some overlap in the projects for the intermediate and primary waves. The most accurate projections are for the intermediate waves due to the amount of available data to determine those dates and price levels. The yellow text primary waves are larger targets because less data was used to obtain them.
The biggest data points for the yellow primary waves comes from one main area. The fifth wave typically accounts for 15-20% of the bigger wavelength (with a consistent average & median around 18%). Theoretically Cycle wave 5 will last around 18% of Supercycle wave 5's length. 18% of projected Supercycle wave 5 is 610 trading days. 15% is 491 trading days. My current projection has Supercycle wave 5 ending (which is also the end of Cycle wave 5) in 2022. I will go into greater detail about these points in the future.
The primary waves were calculated solely based on the 491-610 trading day length of Cycle wave 5. Each wave tends last a similar ratio to the larger wave it trades inside. This is how the yellow text was calculated. Wave 1's tend to last ~29% of the larger wave, 2 is ~12%, 3 is ~37%, 4 is ~5%, and 5 is ~17%. These values are not found in any book, they are from nonstop studies of millions of data points my programs have been running.
The 700 point drop in the title speaks of my current projection from the end of Intermediate wave 5 / Primary wave 1 right before election day and through the first quarter of 2021.
My website will go into much greater detail about the drop and whys. Leave comments if this analysis was helpful and thanks for reading.

AUDCHF set to resume sell AUDCHF is set to resume sell for the 3rd Impulse wave, which use to be the longest wave in a motive sequence.
Minimum target is outlined on the chart
The risk reward ratio is more than 2.
Kindly like and follow if you find this analysis useful.
Also, like and Follow to get more updates on this trade and share with friends.
Also feel free to comment if you have a supporting or alternative idea.
Thanks

A Good Oppurtunity In MIDHANIWe Have Spotted an Full Five Wave Structure From The Low in August till The Highs
We Have Also Checked The Wave Internals, Ratio Relationships, The Labeling Meets all The Rules and Guidelines of Elliott Waves,
All The Waves are as Expected Based on Wave Personality, Wave 5th was an Extension, Therefore the Ensuing Correction Was Sharp (Just as Expected), Now if we Consider That If an Five Wave till the Highs has Completed and Wave 2 As well, Then The Wave Three of the Next Higher Degree is in The Making Right Now, Which Gives Us a Good Opportunity To Enter and Ride The Move Beyond The Highs.

VALE3: Long on Elliott Wave (III)/Compra por Onda (III)VALE3 has just confirmed its start of a WAVE (III) in SuperCycle degree. We should see a strong push to the upside in the coming months and quarters, with the 1.618 expansion at R$ 415.
The whole advance from Early 2016 until the just broken out top "V" shows a clear 5 wave pattern, and that was labeled in Cycle degree as WAVE (I). The correction that ensued up till the corona virus/Oil glut - Russia vs. Saudis - bear market was labeled as a corrective WAVE (II).
VALE3 acaba de confirmar o início de uma ONDA (III) de grau SuperCíclico. Devemos observar uma força vigorosa empurrando os preços para cima nos meses e trimestres a seguir, com a expansão de fibo batendo em R$ 415.
A subida desde o começo de 2016 até o topo recém rompido "V", revela um padrão de 5 ondas, que foi rotulado a nível cíclico como ONDA (I).
A correção que se deu até uns meses atrás com o Corona-Virus/Crise do Petróleo "Russia-Arábia Saudita" foi rotulada como ONDA (II).

Vaccine stock to climb up to $140 in wave-3At a weekly time frame, this stock is the next thing to blow out. With phase 3 trials expected in July, the potential of $MRNA could be huge in upcoming weeks.
With wave-1 and wave-2 already formed, market is now forming wave-3 which may lead the price to possibly $140-160 zone.
(Note: Please ignore the markings for wave-4 and wave-5)
What do you think about this idea? Leave your comments below.
Disclaimer: This is not a financial advise. Please make your independent decisions while making an investment.

GBPUSD: wave 3 of Elliot with the signal from Ichimoku cloudGBPUSD: wave 3 of Elliot waves with the signal from Ichimoku cloud

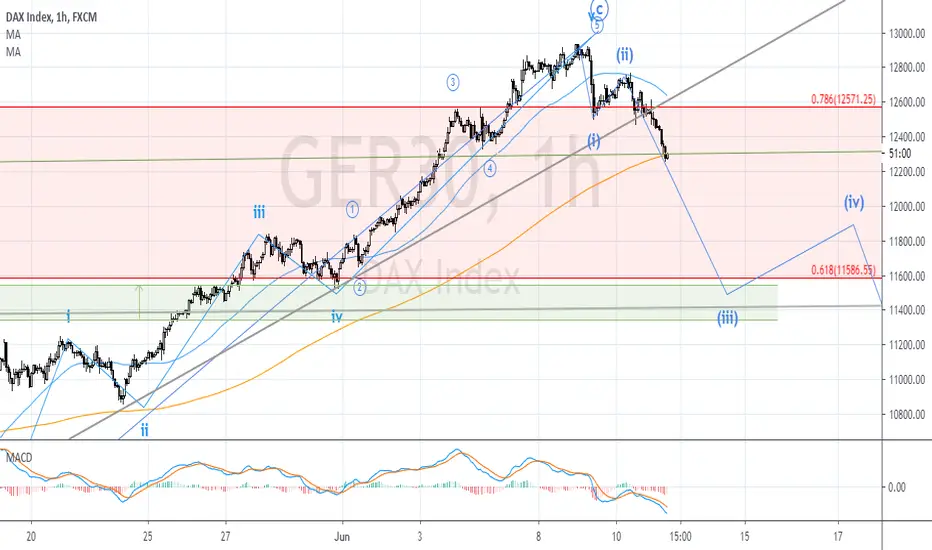
Start of the middle of the declining In case of a fair turnaround, there will be strong declining with a little rising correction or sideways correction. The further day the DAX should reach its next support zone somewhere around 11400.
The lower timeframe when I realise the correction movement like Zigzag, Flat or Triangle I would take the chance to short.
BITCOIN LONG--Non-logarithmic-- Wave 3 -- BTC ATH within monthsThis is a detailed breakdown of the Elliot wave structures for bitcoin on the Grand SuperCycle time frame.
We are currently just beginning wave 1 of the always most impulsive wave 3 of the Grand SuperCycle timeframe.
Truly impressive times you are all observing.

Short Dow Futures (YM) on Resistance RejectionAn opportunity to short the Dow has presented itself. Price couldn't break through resistance and is retreating. Setup is invalidated if price goes back up above resistance. We should see the lows from a couple weeks back retested and perhaps even broken.


EOS Long Term SUPPORT HELD (IDEA)EOS just recently found support on the long term rising trendline.
Bullish divergence on the daily right on the support. RSI and MACD.
If this were to be end of wave 2 then we could see a structure like this play out.
Just my thoughts and idea of how this could play out.


Bitcoin: Waiting For Long Setup 8400 AREA.Bitcoin consolidating again after the dramatic short squeeze to the 10,200 area. In fact, there is a sell signal in place as I write this, but is Bitcoin a short? Those that can appreciate my analysis and perspective know that answer to that, while everyone else chases 5 minute charts. In this article, I will update the relevant levels in play and what we are looking for in order to enter a new swing trade long.
Don't get caught up in the "WHY!?", because all that really matters is "WHERE". And to recognize high probability locations, elements like magnitude and trend need to be defined clearly. I was consistently writing about the high probability of a short squeeze while Bitcoin was gyrating in the 7Ks, and pointed out a lack of trend.
In order to put that statement into perspective, you need to understand how I am defining trend. My definition is derived specifically from the daily time frame, along with guidelines that come from the Elliott Wave frame work.
1. Our strategy defines trend as follows: 3150 to 14K is larger degree Wave 1 (BULLISH), 14K to 7295 Wave 2 (Corrective consolidation of a BULLISH broader trend). Even though price was pushing lows within the consolidation (9300 break to 7293) this is still part of Wave 2 which on the larger magnitude does NOT qualify as a bearish trend). This broader perspective offers insight into the probabilities of a location and why the HERD gets caught off guard shorting into fake out zones.
2. 7293 is a higher low relative to 3150. This is now a major support level and defines the broader Wave 2 low. Higher lows often lead to HIGHER HIGHS.
3. The magnitude of the short squeeze to 10,200 is a typical impulse that usually defines the initial wave of the next broader move. In other words, this could be the first leg of a broader Wave 3. According to Elliott Wave Theory, Wave 3 is NEVER the shortest wave.
4. With the initial impulse in place, the current minor consolidation is nothing more than a corrective wave (minor Wave 2) that can technically retrace to the low of minor Wave 1 (7295) and still be considered bullish. We are anticipating a reversal around the 8472 to 7974 minor support zone. It is this support zone that offers a high probability location for SWING TRADE long setups.
5. Although a Wave 2 low is established, the overall range is still the 14K high to 7295 low. This means we still operate under the guidelines of a RANGE BOUND market, UNTIL the shorter term trend is confirmed (14K needs to be taken out). Range bound guidelines affect how we evaluate risk and profit targets.
6. Momentum and trend are SEPARATE elements. You can have bullish momentum in a bearish trend, and vice versa. Even though there is a sell signal (current bearish candle) the short term momentum is still bullish. Unless you are day trading, shorting this market is a very high risk proposition.
It is important to comprehend that we refrain from day trading Bitcoin. Yes there will be countless trends, chart patterns and signals on smaller time frames, BUT the randomness is VERY HIGH. Where many go wrong is they take day trade signals and expect swing trade profit targets (which is the equivalent of gambling). This is what lures bears into shorting around 7630 and setting profit targets at 6500.
Those who chase are the ones who provide liquidity (and profits) to those who have the ability to WAIT. The weeks leading up to the squeeze required a ton of patience because there was very little reason to trade during that time. We had a swing trade on from 8425 that got stopped out once Bitcoin broke 7630. We took our small loss and simply WAIT for the next high probability SWING TRADE setup.
Many get caught up in smaller time frames because they offer a lot more action (more signals, etc). There is nothing wrong with that as long as your strategy is SPECIFICALLY developed for such time frames. We avoid small time frames and FOCUS on the bigger picture because we are involved in a variety of other markets (stocks, forex, cfds, etc.). As someone who is starting out, it is a good idea to focus on one market, so that you may learn the basics of timing.
Once you develop a solid understanding, then you can trade ANY market because order flow is order flow, no matter if you are in a stock, a futures contract or Bitcoin. And with the availability and easy access to other markets today, there is no excuse NOT to be applying timing strategies to wherever opportunities appear.


this is how wave 3 looks likein my opinion we have completed WXY correction that i was talking about for some time. this is wave 3 and my target for end of it is at least 18K. i'll show you why
