Adobe Stock AnalysisWeekly Timeframe (Chart A):
Price has completed a five-wave bearish structure.
After forming an ending diagonal pattern, price broke out of it with strong momentum.
This scenario is confirmed by strong divergences on both RSI and MACD.
Price now appears to be in a bullish corrective phase, which could extend at least toward the upper boundary of the minor weekly channel.
Lower Timeframe (Chart B):
Wave 5 of 5 ended with clear divergence.
A fake breakout above the channel high occurred during a very low-volume market period.
Price is currently correcting toward the marked demand zone.
This demand zone overlaps with the mid-range of a valid 4-hour channel.
After reacting to this area, price may move toward the channel high and attempt to break the key level.
NASDAQ:ADBE
This is just my personal view, so please trade based on your own strategy and trading system.
I’d be happy if you follow me on TradingView to see more analyses and live stock trades.
Wave5

How to Trade Reversals Like a Pro | CADJPY Wave 5 Entry hey Traders,
This is a live example of reversal trading using completed bullish wave structure. Entry executed, currently +10 pips, targeting 113.36 38:1 risk: reward.
🌊 Wave Structure Analysis:
Pattern Identified: Completed Bullish Wave Structure
What This Gives Us:
When a wave structure completes, it provides absolute clarity. We know exactly what our options are—no guessing, no confusion.
Our Two Options:
Sell the reversal (what we did)
Do nothing (if conditions aren't perfect)
That's it. No ambiguity. No emotional decision-making.
💡 The Power of WavesOfSuccess:
This is what proper wave counting provides:
✅ Objectivity - Remove emotion, follow structure
✅ Clarity - Know exactly what to do (or not do)
✅ Flawless Execution - Enter at precise levels
Important Reality Check:
Having clarity doesn't mean we never lose. Losing is an essential part of trading. We teach traders to accept losses quickly and immediately move to the next opportunity. The edge plays out over time, not on every single trade.
📊 Trade Execution Breakdown:
Focus Area: Last leg of bullish wave structure
Entry Method:
Counted the internal bar structures within the major Wave 5 swing. Precise entry at the 2nd Higher High (HH) bar of the internal wave count.
Entry: 114.42
Stop Loss: 114.46 (4Pips)
Why This Level:
The 2nd HH bar of Wave 5's internal structure represents peak momentum—the final push before exhaustion. This is where reversals should begin.
⚠️ Advanced Execution Warning:
This is NOT for novice traders.
Requirements for this type of execution:
Flawless wave counting ability
No guessing on wave positions
Internal bar structure recognition
Precise entry timing
When you master this:
Trading becomes effortless. You're not predicting—you're reading structure and executing mechanically. All you need to control is risk through proper stop placement.
✅ Trade Outcome (So Far):
Status: Success - Risk-free position
What Happened:
Price broke below the internal Wave 4 structural bar within the Wave 5 swing. This created immediate downside momentum and allowed us to move the stop to break-even (risk-free).
Current Profit: +10 pips (and counting)
Current Risk: 0 pips (break-even stop)
👍 Boost if you want more reversal trade breakdowns
👤 Follow for advanced wave structure execution
💬 Can you count internal waves? Comment below

Apple to NVIDIAApple vs. NVIDIA Chart Analysis
Does anyone know something we don’t? This chart compares Apple to NVIDIA.
As you can see, Apple relative to NVIDIA has completed a clear five-wave structure within a descending channel.
Price has now reached the end of wave 5 at the bottom of its 11-year channel, showing a very sharp reaction along with strong divergences in both RSI and MACD on the monthly and weekly timeframes.
Based on this, price appears highly likely to rise, potentially reaching at least the channel’s upper boundary.
Potential Scenarios
This chart outlines four possible scenarios:
1.Both stocks rise, but Apple outperforms NVIDIA.
2.Both stocks decline, but Apple’s drop is more limited.
3.NVIDIA declines, but Apple rises.
4.NVIDIA consolidates, while Apple rises.
The trigger comes from RSI, which, considering the lower timeframe divergence on Chart B, provides reasonable reliability.
For additional confirmation, one can wait for a key line breakout.
Final Notes
This is my personal analysis. I’d be glad to hear your thoughts.
Follow me on TradingView to access more in-depth analyses and live stock trades.

EUR/USD is positioned at the top of two long-term channelsAs you can see, EUR/USD OANDA:EURUSD is currently testing the upper boundary of two major channels on both the weekly and daily timeframes.
1) Daily Timeframe Analysis
On the daily chart, the dollar completed a five-wave impulsive move into the channel’s upper resistance.
After reaching this level, price has started a correction.
Wave A has already finished with a clear five-wave structure.
Price is now forming wave B.
Based on the current structure, wave B is likely to extend:
At minimum, into the Gap Zone, and
At maximum, into the Resistance Zone
(both areas are clearly marked on the daily chart).
From either of these areas, I expect the beginning of wave C, which will likely push the pair down toward the Support Zone.
2) Weekly Timeframe Confirmation
In the weekly chart (Chart B), EUR/USD has reached:
The top of its major ascending channel, and
The 100% extension of the previous leg.
This confluence significantly strengthens the bearish scenario.
3) Additional Charts Coming
I will also upload the hourly EUR/USD chart on my TradingView page to provide a clearer and more detailed outlook.
4) Follow for More Analysis
Feel free to follow me on TradingView to catch all my analyses and live stock trades.
I’d be happy to hear your thoughts and feedback.

Kiwi in 5th wave, then buy-the-dip?Kiwi looks to have put in a provisional bottom around 0.5570 and is grinding higher toward the 0.58 handle, a key resistance zone that could either cap this fifth wave or unlock further upside.
In this video, we look at how a weaker US dollar and a slightly more hawkish RBNZ are supporting NZD/USD, and why 0.58 is such an important decision point. We then map out the buy‑the‑dip zone for a potential continuation higher and the levels that would flip the script to shorts.
Key drivers
RBNZ recently cut by 25 bps but signalled the easing cycle is likely over, while new governor Anna Breman is perceived as relatively hawkish and focused on inflation, which helps underpin the Kiwi.
Fed December cut odds around 85–90% after a run of softer US data keep the dollar under pressure, providing a tailwind for NZDUSD on rallies and pullbacks.
On the 4‑hour chart, price is pushing up toward 0.58 with emerging RSI divergence, suggesting this move is likely a fifth wave into resistance and setting up a corrective pullback rather than an immediate trend reversal.
Primary idea : Look to buy the dip if price reacts lower from 0.58 into the 0.5690–0.5660 zone (between the 38.2% and 61.8% Fib of the latest leg and prior support), targeting 0.5910, 0.60 and potentially 0.61, while a break below ~0.5640 and the channel base would instead open the door to deeper downside and short opportunities.
Trading Kiwi here? Share how you’re planning to trade the 0.58 resistance and buy‑the‑dip zone in the comments, and follow for more macro‑plus‑technicals swing setups.
This content is not directed to residents of the EU or UK. Any opinions, news, research, analyses, prices or other information contained on this website is provided as general market commentary and does not constitute investment advice. ThinkMarkets will not accept liability for any loss or damage including, without limitation, to any loss of profit which may arise directly or indirectly from use of or reliance on such information.

Wave 4 Finishing – Preparing for the Final Wave 5 Impulse (EW)We are currently completing wave 4 — both in the subwave and sub-subwave count — and getting ready for the final impulsive wave 5.
According to Elliott Wave rules, wave 4 cannot overlap with wave 1, which also defines our stop-loss level. As long as this level holds, the bullish structure remains valid.
Wave 4 has retraced between the 0.382–0.5 Fibonacci zone, perfectly matching the expected correction depth. Since wave 2 was extended in time, we expect a shorter and faster wave 4, often characterized by a quick wick and rejection before continuation.
From the indicator side:
RSI, Stoch, and MACD are all oversold and starting to curl up on multiple timeframes — 15m, 45m, and 144m.
The B-leg of the correction was overbought, signaling exhaustion and confirming the upcoming C-leg completion.
With that, we are in position for the start of wave 5, which should complete the macro wave 3.
🎯 Trade Setup:
Entry: Current zone (0.382–0.5 retracement range)
Stop-loss: Below wave 1 invalidation level
Target: Extension of wave 5 from wave 3 to wave 4, We target the 2.618%
Summary:
Wave 4 is finishing, indicators align across timeframes, and all Elliott conditions are in place for a strong push into wave 5.

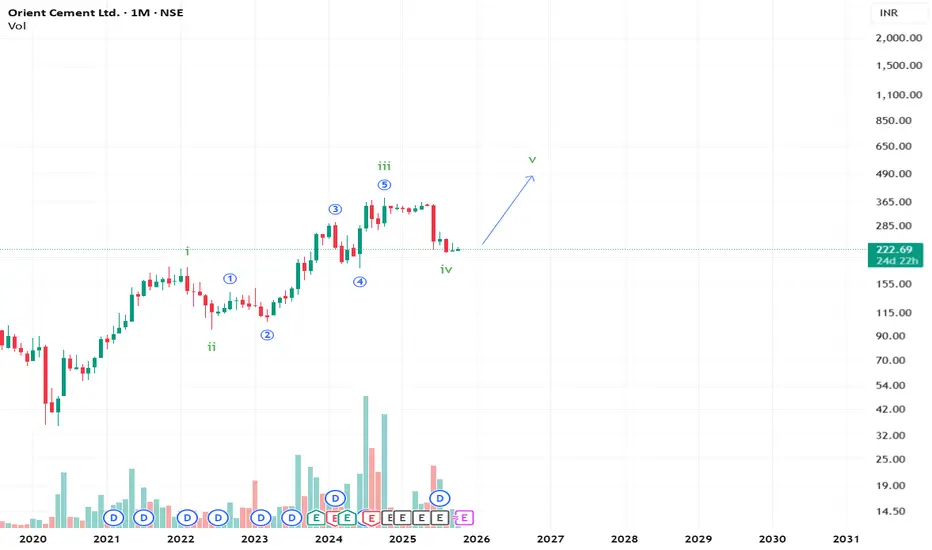
Orient Cement ready for final wave 5?Orient Cement may go up to complete what seems to be the final wave V in the impulse.
Potential Reversal Ahead: Elliott Wave AnalysisHello friends,
Welcome to RK_Chaarts,
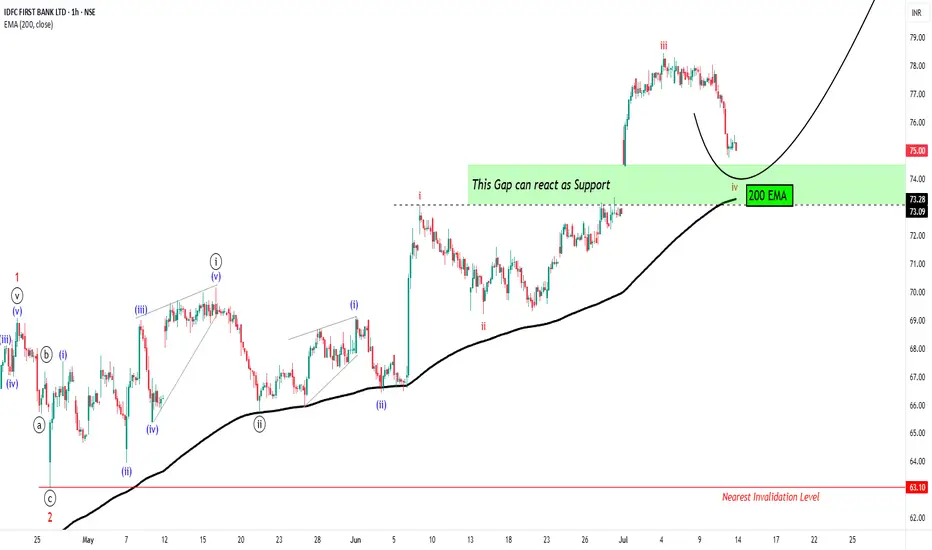
Today we're going to analyze chart of stock named IDFC First Bank, based on Elliott wave theory.
Today, we're analyzing the chart of IDFC First Bank using Elliott Wave theory. On the chart, we've marked the Elliott Waves, indicating that:
- Red wave 1 and 2 (Minor degree) have ended
- Price is unfolding into red wave 3 (Minor degree)
- Black wave ((i)) and ((ii)) (Minute degree) have completed
- Black wave ((iii)) (Minute degree) is ongoing
- Blue wave (i) and (ii) (Minuette degree) have finished
- Blue wave (iii) (Minuette degree) is in progress
- Red wave i, ii, and iii (Subminuette degree) have completed
- Possibly in the correction phase of red wave iv (Subminuette degree)
We observe that the price gapped up, retraced to correct wave iv, and is now supported by the gap zone. Along with 200Exponential Moving Average is also at Gap level which can also provide a good Support to same view.
Our estimate suggests a high probability of a price reversal. However, market uncertainties exist.
Potential price targets: 81, 93, and 100+
Nearest invalidation level: 73.09 (wave iv should not overlap wave i)
Please note that this analysis is for educational purposes only. I'm not a SEBI-registered analyst, and you should consult your financial advisor before trading or investing.
Let's see how the market unfolds. This entire study is shared solely for educational purposes. Thank you so much.
I am not Sebi registered analyst.
My studies are for educational purpose only.
Please Consult your financial advisor before trading or investing.
I am not responsible for any kinds of your profits and your losses.
Most investors treat trading as a hobby because they have a full-time job doing something else.
However, If you treat trading like a business, it will pay you like a business.
If you treat like a hobby, hobbies don't pay, they cost you...!
Hope this post is helpful to community
Thanks
RK💕
Disclaimer and Risk Warning.
The analysis and discussion provided on in.tradingview.com is intended for educational purposes only and should not be relied upon for trading decisions. RK_Chaarts is not an investment adviser and the information provided here should not be taken as professional investment advice. Before buying or selling any investments, securities, or precious metals, it is recommended that you conduct your own due diligence. RK_Chaarts does not share in your profits and will not take responsibility for any losses you may incur. So Please Consult your financial advisor before trading or investing.
Bitcoin could reach as high as $250,000.I think Bitcoin could reach as high as $250,000 per coin in wave 5, as crypto often experiences extended fifth waves—similar to what we see in commodity markets like gold and silver. It’s possible for it to go even higher than this, but I believe $250,000 is a very realistic target.
As always, stay profitable.
– Dalin Anderson

#btc #elliottwave long buy setup wave 5 30Mar25This count is based on my assumptions so anything can happen not a trading or financial advice just for educational purposes only kindly do your own ta thanks trade with care good luck.

#btc #btcusd #elliottwave long buy setup wave 5 22Jan25This count is based on my assumptions so anything can happen not a trading or financial advice just for educational purposes only kindly do your own ta thanks trade with care good luck.

#usdjpy #elliottwave long buy setup wave 5 17Jan25This count is based on my assumptions so anything can happen not a trading or financial advice just for educational purposes only kindly do your own ta thanks trade with care good luck.

#btc #btcusd #elliottwave long buy setup wave 5 14Jan25This count is based on my assumptions so anything can happen not a trading or financial advice just for educational purposes only kindly do your own ta thanks trade with care good luck.

Bank Of IndiaSharing my view on Bank of india based on elliott wave theory, where price seems to complete correction phase, but here is the tricky part if price breaks, price will move up.but, if it breaks 137 price level then and then only we can consider the start of wave 5, untill then it will correction uptrend and price can remain sideways.

#btc #btcusd #elliottwave long buy setup wave 5 9Jan25This count is based on my assumptions so anything can happen not a trading or financial advice just for educational purposes only kindly do your own ta thanks trade with care good luck.

#xauusd #elliottwave long buy setup wave 5 9Jan25This count is based on my assumptions so anything can happen not a trading or financial advice just for educational purposes only kindly do your own ta thanks trade with care good luck.

new wave 5 targets on ada since deep wave 4 correction
in above mentioned idea i outlined most passive targets on ada. Today there was a impulsive weekly Candle that take off ada to 10% 24h pump as only coin in top 10 .
Just for the bigger Picture that means ADAs marketcap pumped from 40 to 44billion dollars in1-2 days 4 billion on top thats massive. As iam in that market since 2017 i learned if ada pumps that hard out of nothing, that is a superb sign of outperforming next days.
New Target
1,47 minimum up to 1,70$ in a normal wavecount scenario
INFO:
if alt season starts my targets probable are nonsense because ada will rise much higher
If BTC dumps then all alts including ada will dump to. Then the Chart needs a new point of view and analysing.

#xauusd #elliottwave long buy setup wave 5 13Dec24This count is based on my assumptions so anything can happen not a trading or financial advice just for educational purposes only kindly do your own ta thanks trade with care good luck.

#xauusd #elliottwave long buy setup wave 3 of 5 12Dec24This count is based on my assumptions so anything can happen not a trading or financial advice just for educational purposes only kindly do your own ta thanks trade with care good luck.

DXY Formed Wave Pattern!Looking for Impulse Up.
DXY formed 1,2,3,4,5 & a now wait for wave b to get in with wave c. It's important to have your own rules on RR and adhere to them. This trading idea is intended to assist you and enhance your knowledge. If you have any questions, please ask me in the comments.
Learn & Earn!
Wave Trader Pro

#xauusd #elliottwave long buy setup wave 5 11Dec24This count is based on my assumptions so anything can happen not a trading or financial advice just for educational purposes only kindly do your own ta thanks trade with care good luck.

#btc #btcusd #elliottwave long buy setup wave 3 of 5 of 1 8Dec24This count is based on my assumptions so anything can happen not a trading or financial advice just for educational purposes only kindly do your own ta thanks trade with care good luck.

#xauusd #elliottwave long buy setup wave 5 5Dec24This count is based on my assumptions so anything can happen not a trading or financial advice just for educational purposes only kindly do your own ta thanks trade with care good luck.
