"GBP/USD Price Action Analysis: Short-Term Consolidation and KeyBased on the analysis of the GBP/USD chart on the 4H timeframe, we can observe a strong movement in the market, where the British Pound has been fluctuating within a defined range. After the previous bullish structure, the price pushed higher, reaching a key resistance zone near the 1.3500 level, marked on the chart. This zone is considered a potential breakout (BO) region for the currency pair.
As the price attempts to move higher, we are seeing signs of short-term consolidation, with repeated price action near the 1.3400 level, suggesting that the market is testing this support area. Currently, GBP/USD is trading around 1.3400, indicating a pause in upward momentum and a possible liquidity imbalance as the market digests previous gains.
The projected move, shown by the blue arrows on the chart, suggests that the price may move towards the 1.3440 – 1.3500 region before any further pullback. This would be an attempt to tap into liquidity above the market, with potential resistance at 1.3503. However, the market might also test lower levels around the 1.3394 support area, as indicated by the dashed line on the chart, which could serve as an area for buyers to step in.
If the price breaks below the 1.3394 support, the market may retrace further, with the next support zone at 1.3287, which aligns with the previous low. However, as long as the price remains above the critical support level near 1.3287, the overall trend remains bullish, and any pullback should be viewed as corrective rather than a trend reversal.
This analysis will be updated as the price action evolves at these key levels. Feel free to share your thoughts on whether GBP/USD will continue higher or face further downside from here. Your support with likes and comments is greatly appreciated, motivating me to continue sharing more insights.
Wave Analysis

7000 Is the Target — Not the Top🔥 7000 Is the Target — Not the Top 🔥
Everyone is talking about fear, recession, and crashes…
While the market is still building one last expansion leg.
📌 My macro view is simple:
S&P 500 continues higher toward 7000
This move is driven by liquidity, optimism, and late-cycle euphoria
Headlines will stay bullish right until the very end
But here’s the part most traders miss 👇
🎯 7000 is not a buy zone.
It’s the transition zone.

Elliott Wave Analysis XAUUSD Week 2 – January 2026
1. Momentum
Weekly (W1)
– Weekly momentum is currently declining
– This suggests the broader bearish trend remains intact
– Price is likely to continue correcting until weekly momentum reaches the oversold zone
Daily (D1)
– Daily momentum has turned bearish
– Therefore, the dominant bias for this week is expected to be to the downside
H4
– H4 momentum is currently in the overbought zone
– A short-term pullback is likely to occur as early as Monday
2. Elliott Wave Structure
Weekly Structure (W1)
– Last week closed as a bullish candle
– However, weekly momentum is still declining and has not confirmed a bullish reversal
– As a result, we continue to follow the main scenario:
→ Wave X has already completed
→ Price is now continuing to develop wave Y
– The two main downside targets for wave Y are:
– 4072
– 3761
Daily Structure (D1)
– Daily momentum has turned bearish, supporting the view that price may continue lower as part of wave Y this week
– However, there is an important risk factor to note:
– Price rallied strongly last week
– It is now trading very close to the previous wave C high
– This increases the risk of a breakout above the prior high, which would require a reassessment of the current wave count
– Plan going forward:
– Wait for Monday’s session
– A bearish daily close would further confirm the continuation of wave Y
H4 Structure
– H4 momentum is in the overbought zone and showing signs of a potential reversal
– The break above 4500 invalidates the previous wave 1–2 scenario
– This suggests that red wave C is still in progress
– The next target for red wave C is the 4521 area
This zone is also selected as the primary trading objective for Monday.
3. Trading Plan
– Sell Zone: 4520 – 4522
– Stop Loss: 4540
– Take Profit 1: 4423
– Take Profit 2: 4331
– Take Profit 3: 4220

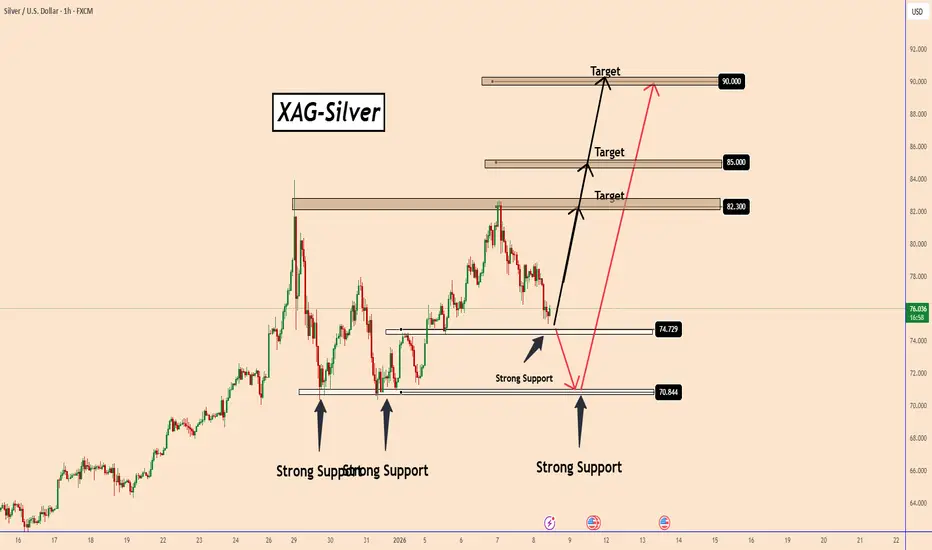
Silver Awaits NFP as Price Holds Key Support Bullish BiasSilver Awaits NFP as Price Holds Key Support Bullish Bias
Silver is currently stuck waiting for the NFP data. If the price holds strong at the current support area of 74.70, then there is a good chance that it will rise from the current area, but during or after the news.
In my opinion, in the worst-case scenario, silver could also fall with the red scenario I draw on the chart for a possible retest of the key support area near 71. This move could only happen from any major speculation during the NFP data tomorrow.
Overall, I remain bullish on silver.
Main targets:
82.30 ; 85 ; 90
You may find more details in the chart!
Thank you and Good Luck!
PS: Please support with a like or comment if you find this analysis useful for your trading day
Gold Weekly Levels: Break above 4555 → 4625/4635🔱 GOLD WEEKLY SNAPSHOT — EXECUTIVE SUMMARY
✨ Bulls remain in control as price transitions into the Wave-5 extension sequence
🟡 Key unlock level: 4555 — a clean break/acceptance above opens continuation fuel
🚀 Wave-5 extension target: 4625–4635 (primary upside objective / price discovery ceiling)
🧲 Fresh overhead sell-side liquidity: 4625–4635 = high-probability “max-out + reversal” zone
🔄 Expectation after 4625–4635: corrective rotation lower profit-taking + liquidity sweep
🛡 Bull structure remains intact while above: 4350 first major buy-side pool
⚠️ Bears’ post-extension objectives: 4350 → 4275 fresh buy-side liquidity targets
🎯 Strategy this week: trade with the trend into 4625–4635, then shift mindset to correction timing
🏦 Core play: don’t chase highs under 4625–4635; scale out into target, then stalk reversal setup
________________________________________
🗳️ Gold Weekly Scenarios — What’s Your Play?
Which path do you have for XAUUSD next week?
🅰️ Hold above 4555 → wave-5 extension triggers → 4625–4635 sweep
🅱️ Fakeout / dip under 4555 early week → reclaim → squeeze into 4625–4635
🅲 Direct drive into 4625–4635 → rejection confirms reversal → correction targets 4350/4275
🅳 Your key level: 4555
________________________________________
🔥 GOLD WEEKLY SNAPSHOT — BY PROJECTSYNDICATE
🏆 Swing Structure
Gold is still operating in a bull-controlled tape, but this week is about finishing the move:
• 4555 is the trigger level that opens the door for continuation.
• Once continuation engages, the market is likely to seek a final liquidity run into 4625–4635.
• That zone is important because it’s not just a target — it’s fresh overhead sell-side liquidity, meaning it’s where late longs get trapped and smart money sells into strength.
• After the sweep completes, the roadmap flips: correction phase begins, with bears likely targeting fresh buy-side liquidity at 4350 and 4275.
________________________________________
📈 Trend
Higher-timeframe bias
Primary bias remains bullish, with the market positioned for a Wave-5 extension.
Tactical
This week is likely to trade in two phases:
Phase 1: Continuation & Extension
• Bulls defend structure, build pressure, then break 4555
• Momentum rotates higher as stops/liquidity fuel expansion
• Price seeks the 4625–4635 magnet
Phase 2: Max-Out & Correction
• Once 4625–4635 is tagged/swept, upside becomes asymmetric risk
• Expect rejection behavior stall → wick → displacement down
• Market shifts to “where’s the next liquidity pool?” → 4350, then 4275
________________________________________
🛡 Supports — Demand / Buy-Side Liquidity Zones
4555 Pivot / Trigger
This is the most important tactical level this week:
• Above it: continuation bias stays active
• Below it: market may chop, reload, or run a dip-reclaim pattern
4350 Fresh buy-side liquidity
• This is a post-extension magnet.
• If Wave-5 completes near 4625–4635, 4350 becomes the first major “bear target”.
• Also likely to act as a reaction zone once tagged.
4275 Fresh buy-side liquidity
• Secondary downside objective once 4350 is taken.
• Often the “final grab” zone that completes the correction leg.
• Expect increased bid interest here after liquidity is swept.
________________________________________
🚧 Resistances — Upside Objectives / Wave-5 Expansion Targets
4555 Breakout gate
• Break + acceptance = green light
• Rejection + failure = delay, not necessarily reversal until 4625–4635 is visited
4625–4635 Wave-5 extension + fresh sell-side liquidity
This is the main event:
• The market is expected to run this zone because it holds fresh overhead liquidity
• This is where you expect:
o stop runs
o late FOMO entries
o liquidity sweep behavior
o reversal conditions forming
Trade mindset at 4625–4635:
✅ take profits / reduce risk
❌ don’t initiate fresh longs late into the zone (unless you’re scalping with strict rules)
________________________________________
🧭 Bias Next Week
Primary bias: bullish continuation into 4625–4635, then correction expected.
What you’re trading this week:
• Bulls: break 4555 → push extension
• Bears: wait for 4625–4635 sweep → trigger correction → target 4350/4275
________________________________________
⚖️ Base Case Scenario Most likely path
Early week: pressure + positioning
• Market holds firm and works around the pivot zone
• Any dips are likely corrective and designed to reload liquidity for the break
Mid-week: trigger + acceleration
• 4555 breaks/holds
• Momentum expands; price begins seeking the upper liquidity pool
Late week: target hit + reversal risk increases sharply
• Price reaches 4625–4635
• Expect “max-out” behavior:
o stall / compression at highs
o wick sweeps
o sharp rejection candles
• Once rejection confirms, correction leg begins targeting:
o 4350 first
o 4275 next
________________________________________
🚀 Breakout / Invalidation Triggers
✅ Bullish confirmation trigger
Clean break + acceptance above 4555
• Confirms Wave-5 continuation is active
• Increases probability of reaching 4625–4635
⚠️ “Max-out” reversal trigger (what you’re watching at the top)
Sweep into 4625–4635 + rejection
Common confirmation behaviors:
• quick spike into the zone, then close back below
• repeated failure to hold above 4630-ish
• sharp displacement down after a liquidity grab
✅ Bearish continuation trigger
Rejection confirmed from 4625–4635 + breakdown through local supports
• Opens correction flow into 4350, then 4275
________________________________________
🔓 Bull / Bear Structural Lines
🟢 Bull control line: Above 4555
🟡 Transition line: 4625–4635
🔴 Bear objective line: Below post-top breakdown correction seeks 4350 → 4275
________________________________________
🧭 Recommended Strategy Framework
1️⃣ Primary Play — Ride Wave-5 into the extension
Idea: Bulls maintain control → break 4555 → push into 4625–4635
• Build exposure only when the market proves it can hold above 4555
• Prefer entries on:
o reclaim/hold of 4555
o shallow pullbacks that respect the breakout structure
• Risk management focus: avoid chasing once price is extended and nearing 4625–4635
2️⃣ Profit-taking Plan — Scale out into 4625–4635
This is your sell-side liquidity zone:
• Reduce longs into the target
• Tighten risk aggressively
• Assume reversal risk rises the closer price gets to 4635
3️⃣ Secondary Play — Hunt the correction AFTER the sweep
Once Wave-5 extension completes:
• Bears likely target fresh buy-side liquidity:
o 4350
o 4275
Correction mindset:
• First drop often sharp (trap release)
• First bounce likely around 4350
• If 4350 breaks clean, expect continuation into 4275
________________________________________
✅ Weekly Levels
• 4555: breakout gate / continuation trigger
• 4625–4635: wave-5 extension + sell-side liquidity (reversal window)
• 4350: buy-side liquidity target #1 (post-top correction)
• 4275: buy-side liquidity target #2 (deeper correction objective)

#ADA/USDT Spot LONG#ADA
The price is moving within a descending channel on the hourly timeframe. It has reached the upper boundary and is heading towards breaking it. A retest of this boundary is expected.
The Relative Strength Index (RSI) is showing an upward trend, as it has approached the upper boundary. A bearish reversal is expected.
There is a key support zone in green at 0.3800. The price has bounced from this zone several times and is expected to bounce again.
A consolidation trend is observed above the 100-period moving average, which we are approaching. This trend supports a decline towards this level.
Entry Price: 0.3916
Target 1: 0.4018
Target 2: 0.4155
Target 3: 0.4296
Stop Loss: Above the green support zone.
Remember this simple thing: Money management.
For any questions, please leave a comment.
Thank you.

TESLA: Short Signal Explained
TESLA
- Classic bearish formation
- Our team expects pullback
SUGGESTED TRADE:
Swing Trade
Short TESLA
Entry - 444.98
Sl - 449.19
Tp - 436.86
Our Risk - 1%
Start protection of your profits from lower levels
Disclosure: I am part of Trade Nation's Influencer program and receive a monthly fee for using their TradingView charts in my analysis.
❤️ Please, support our work with like & comment! ❤️

SPX down and then?A new drawing is helping clarify where we are in the market. Either one more up after a small fall to break over 7k (likely), or the wedge breaks and we start heading down (less likely). Not sure which just yet but we'll see by next week I would think - good luck!

SILVER Will Collapse! SELL!
My dear subscribers,
This is my opinion on the SILVER next move:
The instrument tests an important psychological level 7995.1
Bias - Bearish
Technical Indicators: Supper Trend gives a precise Bearish signal, while Pivot Point HL predicts price changes and potential reversals in the market.
Target - 7807.8
My Stop Loss - 8100.3
About Used Indicators:
On the subsequent day, trading above the pivot point is thought to indicate ongoing bullish sentiment, while trading below the pivot point indicates bearish sentiment.
Disclosure: I am part of Trade Nation's Influencer program and receive a monthly fee for using their TradingView charts in my analysis.
———————————
WISH YOU ALL LUCK

GBPAUD Is Bullish! Long!
Please, check our technical outlook for GBPAUD.
Time Frame: 1h
Current Trend: Bullish
Sentiment: Oversold (based on 7-period RSI)
Forecast: Bullish
The market is trading around a solid horizontal structure 2.003.
The above observations make me that the market will inevitably achieve 2.007 level.
P.S
Please, note that an oversold/overbought condition can last for a long time, and therefore being oversold/overbought doesn't mean a price rally will come soon, or at all.
Like and subscribe and comment my ideas if you enjoy them!

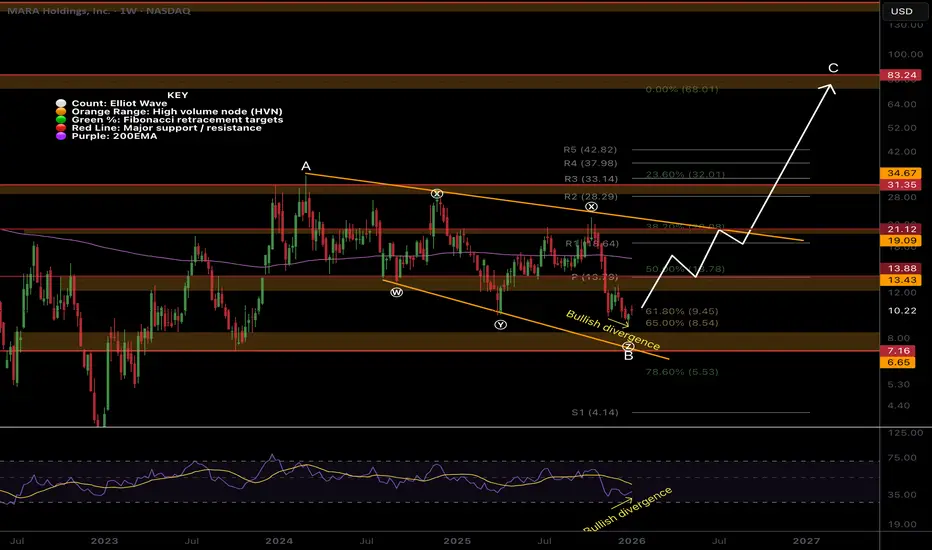
MARA Macro analysis | The bigger picture | Long-term holdersNASDAQ:MARA
🎯 Mara remains at the golden pocket support and channel lower boundary. It is below the daily pivot and 200EMA, showing the bears are in control. Price appears to be in an Elliot wave B, restricting upside targets to the 1:1 Fibonacci extensions at $106.
📈 Weekly RSI is nearing oversold with room to fall but has bullish divergence
👉 Analysis is invalidated if we close back below wave (II), $3.07
Safe trading
Up for goldHi traders,
Last week gold went up right at the open of the market, made a correction down and went up again.
So next week we could see this pair go up some more (finish wave 5?).
Let's see what price does and react.
Trade idea: Wait for a correction down on a lower timeframe to trade longs.
This shared post is only my point of view on what could be the next move in this pair based on my technical analysis.
But I react and trade on what I see in the chart, not what I've predicted or expect.
Manage your emotions, trade your edge!
Eduwave

US100 Set To Fall! SELL!
My dear friends,
US100 looks like it will make a good move, and here are the details:
The market is trading on 25760 pivot level.
Bias - Bearish
Technical Indicators: Supper Trend generates a clear short signal while Pivot Point HL is currently determining the overall Bearish trend of the market.
Goal - 25652
Recommended Stop Loss - 25821
About Used Indicators:
Pivot points are a great way to identify areas of support and resistance, but they work best when combined with other kinds of technical analysis
Disclosure: I am part of Trade Nation's Influencer program and receive a monthly fee for using their TradingView charts in my analysis.
———————————
WISH YOU ALL LUCK

MSTR Macro analysis | The bigger picture | Long-term holdersNASDAQ:MSTR
🎯 Sentiment is low, the asset is hated and misunderstood by TradFi and retail. It’s a recipe for a bottom! Price is now below the weekly 200EMA and pivot, in wave 4, hitting the 0.382 Fibonacci retracement. The bears are in control.
📈 Weekly RSI hit oversold with hidden bullish divergence
👉 Analysis is invalidated if we close back below $101
Safe trading

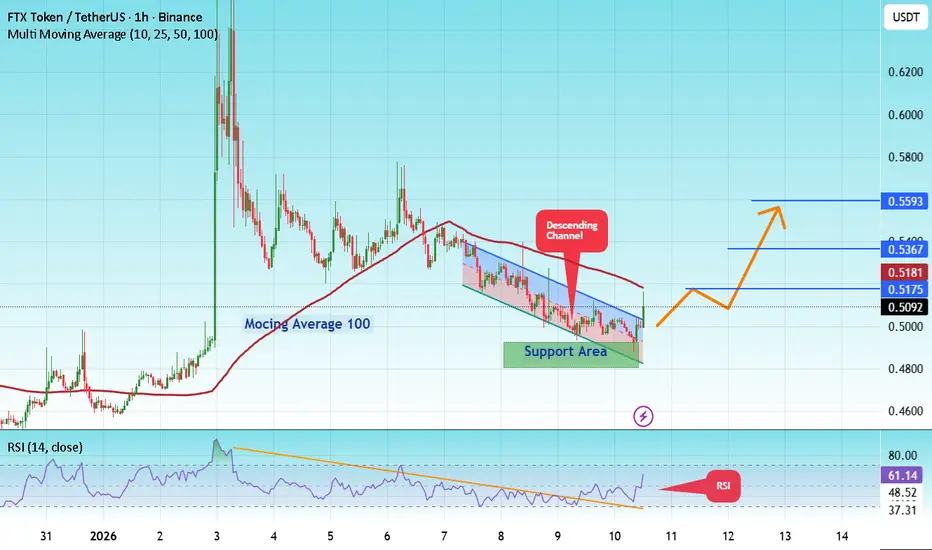
#FTT/USDT : Go to work, it's good#FTT
The price is moving within a descending channel on the hourly timeframe. It has reached the upper boundary and is heading towards breaking it. A retest of this boundary is expected.
The Relative Strength Index (RSI) is showing an upward trend, as it has approached the upper boundary. A bearish reversal is expected.
There is a key support zone in green at 0.4850. The price has bounced from this zone several times and is expected to bounce again.
A consolidation trend is observed above the 100-period moving average, which we are approaching. This trend supports a decline towards this level.
Entry Price: 0.5055
Target 1: 0.5175
Target 2: 0.5367
Target 3: 0.5593
Stop Loss: Above the green support zone.
Remember this simple thing: Money management.
For any questions, please leave a comment.
Thank you.
POWERGRID (Monthly) – Elliott Wave Structure CheckThis chart presents a conservative Elliott Wave view of Power Grid on the monthly timeframe.
Key points:
Secular uptrend remains intact within a rising channel
Advance from 2009 fits an impulsive structure
Wave (3) appears extended and completed near recent highs
Current pullback is best viewed as a Probable Wave (4)
Wave (4) is expected to be time-dominant , not price-destructive
Internal trendlines may be breached temporarily
Only an impulsive breakdown of the main channel would damage the bullish structure
This is a structural pause, not a trend reversal.
📌 Educational / structure-based view. Not trading advice.
#POWERGRID #ElliottWave #ElliottWaveAnalysis #MarketStructure
#WaveFour #CorrectiveStructure #LongTermInvesting
#IndianStocks #ChartStudy #StructureBased

BABA: Multi-Year Rounding Bottom Breakout — Wave 4 Support CheckThis chart for Alibaba (BABA) showcases a massive multi-year accumulation pattern, specifically a "Rounding Bottom" or "Cup" formation that began in late 2022. From an Elliott Wave perspective, the stock appears to have completed a primary Wave 3 impulse peak near the $190 level in late 2025 and is currently in the late stages of a Wave 4 corrective pullback.
The long-term outlook for BABA remains highly bullish as it successfully transitions from a multi-year basing phase into a structural uptrend. The recent pullback from the October 2025 highs represents a textbook Wave 4 correction, which has found precision support at the 0.382 Fibonacci retracement level ($143.58). This level aligns perfectly with the breakout point of the major rounding base, transforming old resistance into new support.
Key Technical Levels:
* Support Zone: The $143 - $150 area is critical; as long as the pivot at point 4 holds, the impulsive structure remains intact.
* Wave 5 Target 1: A 1.0 Fibonacci extension projects an initial target of $205.42, which would reclaim the 52-week highs.
* Wave 5 Target 2: The primary 1.618 extension sits at $242.59, aligning with major historical supply zones from early 2021.
* Invalidation: A sustained daily close below the Wave 2 low (approx. $70-$80) would invalidate this specific count, though the $143 level is the immediate "line in the sand" for bulls.
Projected Outlook:
The current price action at $150.96 is forming what looks like a bullish consolidation (handle) following the massive cup breakout. With cloud and AI demand accelerating revenue growth into 2026, the fundamental narrative supports a re-rating toward the $200+ consensus analyst targets. Traders should watch for a breakout above the Wave 3 peak to confirm the start of the final fifth-wave leg higher.

Elise | XAUUSD – M30 | Liquidity Expansion PhaseOANDA:XAUUSD
After sweeping sell-side liquidity near the lows, price aggressively reversed, breaking internal structure and shifting momentum bullish. The market is now grinding higher with shallow pullbacks, suggesting strong participation from buyers rather than a short-covering spike.
Key Scenarios
✅ Bullish Continuation 🚀
As long as price holds above the channel midline and recent higher low, continuation toward the liquidity target above highs remains valid.
❌ Bullish Failure / Deep Pullback 📉
A sustained breakdown below the channel invalidates the immediate continuation and opens the door for a deeper corrective move.
Current Levels to Watch
Resistance 🔴: Liquidity pool above recent highs
Support 🟢: Channel midline → last higher low zone
⚠️ Disclaimer: This analysis is for educational and informational purposes only. It is not financial advice. Please conduct your own research before trading.

$PYPL has been testing our patience, but I remain confident thaNASDAQ:PYPL has been testing our patience, but I remain confident that it will be rewarded.
Beyond ongoing buybacks, the technical setup is constructive. The chart shows PayPal trading near the lower boundary of a well-defined range. In a range-bound market, the only consistently profitable strategy is buy low, sell high — and that’s exactly the setup we have here.
Additionally, price action has formed a major triple bottom (the “three fingers”) and a minor triple bottom (highlighted by the blue box). These bottoming patterns materially increase the probability of a move higher.
Stop is still $57.50 (should hold)

#CYBER/USDT Forming Bullish Continuation ?#CYBER
The price is moving within a descending channel on the hourly timeframe. It has reached the upper boundary and is heading towards breaking it. A retest of this boundary is expected.
The Relative Strength Index (RSI) is showing an upward trend, as it has approached the upper boundary. A bearish reversal is expected.
There is a key support zone in green at 0.746. The price has bounced from this zone several times and is expected to bounce again.
A consolidation trend is observed above the 100-period moving average, which we are approaching. This trend supports a decline towards this level.
Entry Price: 0.771
Target 1: 0.791
Target 2: 0.818
Target 3: 0.856
Stop Loss: Above the green support zone.
Remember this simple thing: Money management.
For any questions, please leave a comment.
Thank you.

BTCUSDTFrom the overall pattern, three corrective internal waves have formed, and a drop to the area specified below is expected.

BTCUSD
The support governor confirms the end of the downward wave; we will embark on a final upward wave in the cryptocurrency season.

MSTR Short-term analysis | Trading and expectationsNASDAQ:MSTR
🎯 Price dropped hard wave Y of 4, invalidating the previous analysis. Wave Y can complete any time in this flat correction pattern, but is approaching the 0.382 Fibonacci retracement, a high probability bottom.
📈 Daily RSI went deep into oversold on bullish divergence
👉 Continued downside has a target of the S1 pivot, $136
Safe trading
