#GALA/USDT — Holding the Last Fortres, Recovery or Final Break#GALA
The price is moving in a descending channel on the 1-hour timeframe. It has reached the lower boundary and is heading towards breaking above it, with a retest of the upper boundary expected.
We have a downtrend on the RSI indicator, which has reached near the lower boundary, and an upward rebound is expected.
There is a key support zone in green at 0.00700. The price has bounced from this zone multiple times and is expected to bounce again.
We have a trend towards stability above the 100-period moving average, as we are moving close to it, which supports the upward movement.
Entry price: 0.00714
First target: 0.00721
Second target: 0.00741
Third target: 0.00763
Don't forget a simple principle: money management.
Place your stop-loss below the support zone in green.
For any questions, please leave a comment.
Thank you.
Wave Analysis

GOOG: Is a 10% Surge Imminent? The Setup for $340 Explained🚀 NASDAQ:GOOG : Is a 10% Surge Imminent? The Setup for $340 Explained
In the noisy world of trading, clarity is power.
Today, we are looking at Alphabet Inc. (GOOGL). We are not predicting the future, we are simply preparing for a high-probability outcome.
We have identified a textbook Bull Flag pattern. As noted in the chart, this specific structure historically carries a 71% success rate. However, a statistic is only as good as the execution plan behind it.
The Technical Analysis
The price action is currently consolidating between two parallel yellow lines. This "pause" is healthy, it allows the market to build energy for the next potential leg up.
The key level to watch is $323 . We are looking for a clean breakout above this resistance.
A breakout is only valid if it is accompanied by significant volume . Without volume, a move above $323 could be a "fake-out", and that would be bearish.
If the price loses the $305–$309 zone , the Bull Flag structure is broken, and this specific trade idea is invalid . We must respect the market's "no."
The Projection
If the market gives us the green light at $323 , we have two targets based on standard projections:
Conservative : The 100% projection lands us at $336 .
Aggressive : For those holding longer, the 161.8% extension points higher ( approx. $346) .
Here are the levels I would use to set-and-forget in my trading system:
🎯 Take Profit: White lines ($336 - $346) | > 4-7% Potential
🛡️ Stop Loss : ~$314 Zone (Inside the flag structure) | ~ 2.5% Risk
⚖️ Risk/Reward : 2:1 Ratio or more
🎁 Let’s make a simple deal.
I will handle the heavy lifting to find the top 1% of setups like this, and you just HIT the 🚀 Rocket, Follow and Enjoy.
🤝 Deal?

#UMA/USDT#UMA
The price is moving within a descending channel on the 1-hour frame, adhering well to it, and is heading for a strong breakout and retest.
We are seeing a bounce from the lower boundary of the descending channel, which is support at 1.36.
We have a downtrend on the RSI indicator that is about to break and retest, supporting the upward trend.
We are looking for stability above the 100 moving average.
Entry price: 1.39
First target: 1.42
Second target: 1.45
Third target: 1.49

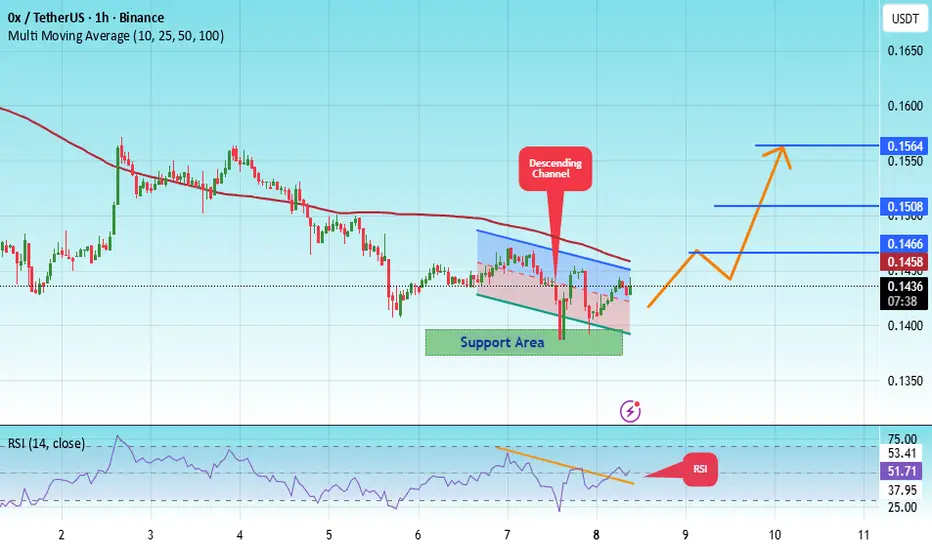
#ZRX/USDT Bullish Impulse, New All-Time High Late 2025#ZRX
The price is moving in a descending channel on the 1-hour timeframe. It has reached the lower boundary and is heading towards breaking above it, with a retest of the upper boundary expected.
We have a downtrend on the RSI indicator, which has reached near the lower boundary, and an upward rebound is expected.
There is a key support zone in green at 0.1380. The price has bounced from this level multiple times and is expected to bounce again.
We have a trend towards consolidation above the 100-period moving average, as we are moving close to it, which supports the upward movement.
Entry price: 0.1436
First target: 0.1466
Second target: 0.1508
Third target: 0.1564
Don't forget a simple principle: money management.
Place your stop-loss order below the green support zone.
For any questions, please leave a comment.
Thank you.
US30 Will Move Lower! Short!
Please, check our technical outlook for US30.
Time Frame: 9h
Current Trend: Bearish
Sentiment: Overbought (based on 7-period RSI)
Forecast: Bearish
The price is testing a key resistance 48,497.6.
Taking into consideration the current market trend & overbought RSI, chances will be high to see a bearish movement to the downside at least to 47,110.8 level.
P.S
The term oversold refers to a condition where an asset has traded lower in price and has the potential for a price bounce.
Overbought refers to market scenarios where the instrument is traded considerably higher than its fair value. Overvaluation is caused by market sentiments when there is positive news.
Like and subscribe and comment my ideas if you enjoy them!

#ZEN/USDT Long plan#ZEN
The price is moving in a descending channel on the 1-hour timeframe. It has reached the lower boundary and is heading towards breaking above it, with a retest of the upper boundary expected.
We have a downtrend on the RSI indicator, which has reached near the lower boundary, and an upward rebound is expected.
There is a key support zone in green at the 296 price level. The price has bounced from this zone multiple times and is expected to bounce again.
We have a trend towards stability above the 100-period moving average, as we are moving close to it, which supports the upward movement.
Entry price: 9.27
First target: 9.52
Second target: 9.90
Third target: 10.36
Don't forget a simple principle: money management.
Place your stop-loss below the support zone in green.
For any questions, please leave a comment.
Thank you.

STRONG BEARISH GOLD FOR NEXT 2 MONTHSGold is going through larger degree correction and that is why a larger price drop is expected. A double top is forming and a slower moving price wave shall take prices to new lows. Be ware that strong bearish waves lasting about 4-6 trading days followed by side ways price action of about 4-6 days is expected to go on till around earlier part of Feb 2027.
If prices go beyond the double top, this trading setup will fail.

#LUNA/USDT Bottom & Bullish Reversal#LUNA
The price is moving within a descending channel on the 1-hour frame, adhering well to it, and is heading for a strong breakout and retest.
We have a bearish trend on the RSI indicator that is about to be broken and retested, supporting the upside.
There is a major support area (in green) at 0.2617, which represents a strong basis for the upside.
For inquiries, please leave a comment.
We are in a consolidation trend above the 100 moving average.
Entry price: 0.2823
First target: 0.3000
Second target: 0.3133
Third target: 0.3331
Don't forget a simple matter: capital management.
When you reach the first target, save some money and then change your stop-loss order to an entry order.
For inquiries, please leave a comment.
Thank you.

USDCAD Is Bullish! Buy!
Here is our detailed technical review for USDCAD.
Time Frame: 1D
Current Trend: Bullish
Sentiment: Oversold (based on 7-period RSI)
Forecast: Bullish
The market is trading around a solid horizontal structure 1.377.
The above observations make me that the market will inevitably achieve 1.395 level.
P.S
We determine oversold/overbought condition with RSI indicator.
When it drops below 30 - the market is considered to be oversold.
When it bounces above 70 - the market is considered to be overbought.
Like and subscribe and comment my ideas if you enjoy them!

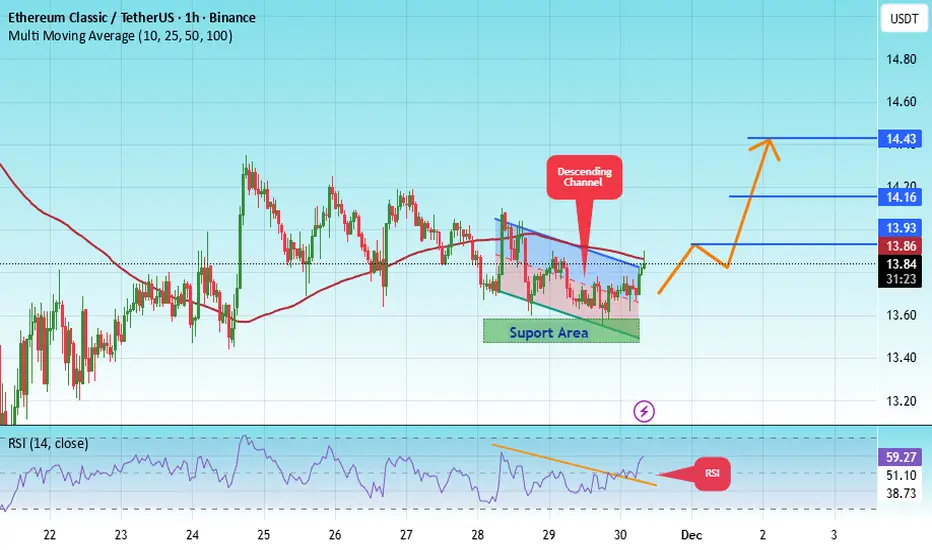
#ETC/USDT The price is moving within an ascending channel#ETC
The price is moving in a descending channel on the 1-hour timeframe. It has reached the lower boundary and is heading towards breaking above it, with a retest of the upper boundary expected.
We have a downtrend on the RSI indicator, which has reached near the lower boundary, and an upward rebound is expected.
There is a key support zone in green at 13.86. The price has bounced from this zone multiple times and is expected to bounce again.
We have a trend towards stability above the 100-period moving average, as we are moving close to it, which supports the upward movement.
Entry price: 13.86
First target: 13.93
Second target: 14.16
Third target: 14.43
Don't forget a simple principle: money management.
Place your stop-loss below the support zone in green.
For any questions, please leave a comment.
Thank you.
#APE/USDT chart (1-hour timeframe)#APE
The price is moving in a descending channel on the 1-hour timeframe. It has reached the lower boundary and is heading towards breaking above it, with a retest of the upper boundary expected.
We have a downtrend on the RSI indicator, which has reached near the lower boundary, and an upward rebound is expected.
There is a key support zone in green at 0.2412. The price has bounced from this zone multiple times and is expected to bounce again.
We have a trend towards consolidation above the 100-period moving average, as we are moving close to it, which supports the upward movement.
Entry price: 0.2453
First target: 0.2500
Second target: 0.2565
Third target: 0.2652
Don't forget a simple principle: money management.
Place your stop-loss order below the green support zone.
For any questions, please leave a comment.
Thank you.

NG1! BULLS ARE GAINING STRENGTH|LONG
NG1! SIGNAL
Trade Direction: long
Entry Level: 4.099
Target Level: 4.647
Stop Loss: 3.733
RISK PROFILE
Risk level: medium
Suggested risk: 1%
Timeframe: 6h
Disclosure: I am part of Trade Nation's Influencer program and receive a monthly fee for using their TradingView charts in my analysis.
✅LIKE AND COMMENT MY IDEAS✅

#INJ/USDT spot plan#INJ
The price is moving in a descending channel on the 1-hour timeframe. It has reached the lower boundary and is heading towards breaking above it, with a retest of the upper boundary expected.
We have a downtrend on the RSI indicator, which has reached near the lower boundary, and an upward rebound is expected.
There is a key support zone in green at 5.46. The price has bounced from this zone multiple times and is expected to bounce again.
We have a trend towards consolidation above the 100-period moving average, as we are moving close to it, which supports the upward movement.
Entry price: 5.60
First target: 5.66
Second target: 5.76
Third target: 5.88
Don't forget a simple principle: money management.
Place your stop-loss below the green support zone.
For any questions, please leave a comment.
Thank you.

USD/CHF BUYERS WILL DOMINATE THE MARKET|LONG
Hello, Friends!
The BB lower band is nearby so USD-CHF is in the oversold territory. Thus, despite the downtrend on the 1W timeframe I think that we will see a bullish reaction from the support line below and a move up towards the target at around 0.801.
Disclosure: I am part of Trade Nation's Influencer program and receive a monthly fee for using their TradingView charts in my analysis.
✅LIKE AND COMMENT MY IDEAS✅

USDT DOMINANCE Update (4H)This analysis is an update to the previous one, which you can find in the related analyses section.
Considering that trading volume in the crypto market has decreased and the volatility of large-cap coins has slowed, analyses now require more time to play out.
We still believe that Tether dominance will experience a drop; however, the supply orders from the previous analysis have been consumed. The correct zone for orders is marked by the red box.
It is expected that after hitting the identified supply zone, the price will move toward the targets marked on the chart and drop.
Let’s see what happens.
For risk management, please don't forget stop loss and capital management
When we reach the first target, save some profit and then change the stop to entry
Comment if you have any questions
Thank You

#CGPT/USDT - READY TO FLY#CGPT
The price is moving in a descending channel on the 1-hour timeframe. It has reached the lower boundary and is heading towards breaking above it, with a retest of the upper boundary expected.
We have a downtrend on the RSI indicator, which has reached near the lower boundary, and an upward rebound is expected.
There is a key support zone in green at 0.03313. The price has bounced from this level multiple times and is expected to bounce again.
We have a trend towards stability above the 100-period moving average, as we are moving close to it, which supports the upward movement.
Entry price: 0.03361
First target: 0.03419
Second target: 0.03515
Third target: 0.03640
Don't forget a simple principle: money management.
Place your stop-loss order below the support zone in green.
For any questions, please leave a comment.
Thank you.

2025 BITCOIN TARGETS: Reality Check
Forecasting is easy. Being right is hard.
1. When Targets Turn Into Illusions
Look at this chart.
Bitcoin at $90,000. Sixteen days left in 2025.
And every “expert” target — JPMorgan, VanEck, Standard Chartered, Tom Lee, Kiyosaki, BlackRock, Cathie Wood —
all of them missed. Every single one.
Why?
Because it’s almost impossible to stay objective when you own the asset you’re predicting.
When you hold a position, your mind paints infinity.
You stop seeing the market — you start seeing your hopes.
You stop analyzing — you start believing.
These price targets were never forecasts.
They were wishful thinking, dressed up as analysis.
2. My Position — Stay Sane
In my posts, I always try to remain objective and grounded.
I don’t trade emotions.
I observe, analyze, and share what I actually see — not what I want to see.
And here’s what I see now:
Those bullish targets might still be achieved one day —
but not by the end of 2025.
Not even by the end of 2026.
According to my cycle analysis, the next real bull market peak will come around 2029.
And even then, it’s hard to name a precise number.
But if history repeats — and each new cycle doubles the previous one —
then levels like $250k, $275k, or even $300k are possible.
Still, even those words must be questioned.
Because the market has one constant lesson — humility.
And those who sound most confident are usually the first to be wrong.
3. Why Bitcoin Will Keep Growing Anyway
Despite all the chaos and uncertainty, one thing remains clear:
Bitcoin will keep growing in the long run.
The reasons are structural, not emotional:
mining difficulty keeps rising,
competition among miners is increasing,
the industry is expanding,
institutional interest is growing,
the circulating supply is shrinking,
the market is becoming more concentrated, leveraged, and volatile.
We’re witnessing moves that a few years ago were unimaginable.
A $20,000 daily swing is no longer shocking — it’s the new normal.
Just look back at October 11th — Bitcoin dropped $20,000 in a single day.
That’s a record.
And it will be broken again.
Because the game keeps escalating.
Bitcoin won’t die.
Unlike thousands of altcoins that fade into oblivion,
Bitcoin has too many players, too much capital, too much gravity to disappear.
4. Where We Are Now
Let’s be honest —
we’re not even halfway through this bear market.
Not even close.
Maybe 20% of the way.
The real pain is still ahead — disappointment, capitulation, and exhaustion.
And not only among retail traders.
Funds, miners, corporations — all of them will face it.
Every cycle demands maximum rejection.
It needs the crowd to give up.
That’s how markets reset.
Bear markets are not crashes — they’re slow, grinding declines that strip away hope.
They don’t destroy capital first — they destroy conviction.
5. The Bicycle Metaphor
If you plan to stay in this market the whole way down,
I’ll compare you to a man riding a bicycle downhill.
He tells himself:
“Yes, I’m going down, but I’ll keep pedaling.
When others quit, I’ll be ahead.”
But the truth is —
when he reaches the bottom,
and the next uphill begins,
he’ll have no strength left to climb.
He’ll be burned out — mentally, financially, emotionally.
He won’t make it up the next mountain.
6. What’s Happening Now
Right now, we’re in a correction phase.
The impulse move is over.
The small bounces you see — they’re not a reversal,
just temporary relief before the next leg down.
This is not the start of a new bull market — it’s a pause between declines.
The macro setup doesn’t support growth yet.
The structure isn’t there.
The market simply isn’t ready.
Every cycle gets heavier.
Each one demands more pain, more time, more cleansing.
7. The Bottom Line
I have no illusions.
No fantasies about instant rallies to $300k.
Only realism and patience.
The market will sort itself out.
But by the time the next real bull run begins,
most of those who are still “pedaling downhill” now
won’t have the energy — or the faith — to climb again.
Best regards, EXCAVO

ENA Compressing Inside Symmetrical Triangle Near Decision ZoneENA is trading inside a well-defined symmetrical triangle after a sustained downtrend. Price is forming lower highs against a descending resistance while buyers continue to defend higher lows, signaling compression and balance between demand and supply.
This structure places ENA at a critical decision zone. A confirmed breakdown below the rising support would favor trend continuation, exposing the lower demand areas around zero point two one four and zero point one nine three, where previous reactions occurred.
On the bullish side, if price manages to reclaim and hold above the triangle resistance, the structure will shift toward recovery. Such a move could open space toward the zero point two seven to zero point three region, marking a short-term trend transition.
This setup is driven by triangle compression, liquidity buildup, and structure equilibrium. Expansion is expected once price exits the triangle, making confirmation essential before directional commitment.

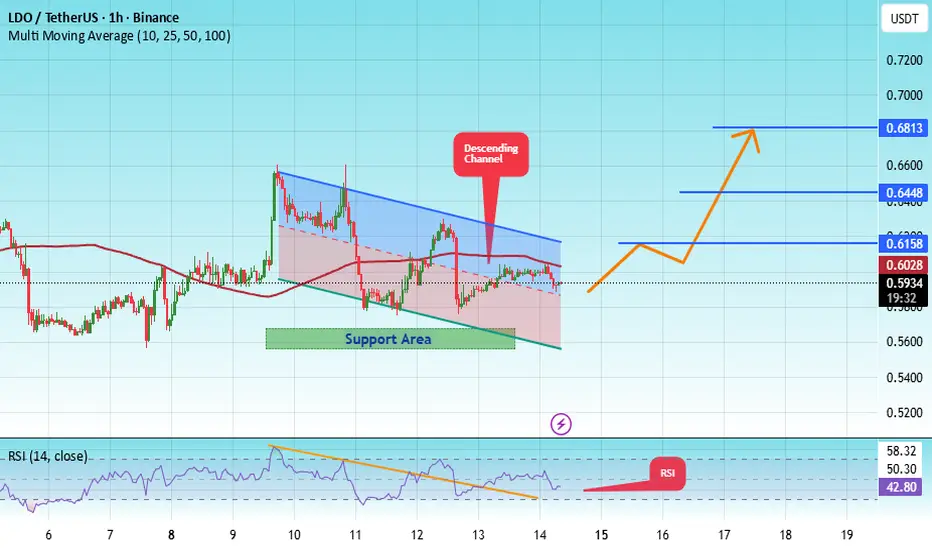
#LDO/USDT — Critical Retest at Demand Zone vs Long-Term Downtr#LDO
The price is moving in a descending channel on the 1-hour timeframe. It has reached the lower boundary and is heading towards breaking above it, with a retest of the upper boundary expected.
We have a downtrend on the RSI indicator, which has reached near the lower boundary, and an upward rebound is expected.
There is a key support zone in green at 0.5625. The price has bounced from this zone multiple times and is expected to bounce again.
We have a trend towards stability above the 100-period moving average, as we are moving close to it, which supports the upward movement.
Entry price: 0.5936
First target: 0.6160
Second target: 0.6448
Third target: 0.6813
Don't forget a simple principle: money management.
Place your stop-loss order below the support zone in green.
For any questions, please leave a comment.
Thank you.
PEPE Falling Wedge at Long-Term Support ZonePEPE is forming a clear falling wedge structure after a prolonged downtrend. Price action is compressing between converging downward trendlines, showing a slowdown in bearish momentum as sellers lose strength near the lower boundary.
The recent liquidity sweep below support followed by consolidation suggests potential base formation. If PEPE manages to break and hold above the upper boundary of the falling wedge, a relief rally toward the major descending resistance becomes likely. This would mark the first structural shift after an extended bearish phase.
On the downside, failure to defend the wedge base will invalidate the bullish reversal setup. In that scenario, price may continue lower toward deeper demand zones, keeping the broader downtrend intact.
This setup is driven by falling wedge dynamics, momentum compression, and liquidity behavior near higher timeframe support. Confirmation through breakout and acceptance is essential before expecting continuation.

GOLD (XAUUSD) – 4H Trendline & Projection Analysis🔹 Higher-Timeframe Context
Gold remains in a broader bullish structure, but price is currently consolidating below a major resistance zone.
The market is transitioning from impulse → range → decision phase.
🔹 Trendline Structure
The ascending trendline drawn from the November lows shows:
Buyers are still defending higher prices
Pullbacks remain corrective, not impulsive
This trendline represents dynamic support within the current range.
As long as price stays above this structure, the bullish bias remains valid.
🔹 Key Zones Explained
🟧 Orange Zone (Lower Support / Demand)
This is a strong demand area, aligned with:
Previous consolidation
Trendline support
Labeled “possible long?” because:
A pullback into this zone would offer better risk-to-reward
Ideal area for buyers to step back in
🔴 Upper Red Zone (Major Resistance)
This zone has previously caused strong rejections
It’s the main upside target if bullish continuation plays out
🔹 Arrow Projection Logic
The arrows outline two possible bullish continuation paths, not predictions:
Scenario 1 – Shallow Pullback (Bullish Continuation)
Price holds above current structure
Minor retracement
Strong push into the upper resistance zone
→ Shows strength and continuation momentum
Scenario 2 – Deeper Pullback (Healthier Reset)
Price rejects near resistance
Pulls back into the orange demand zone
Trendline + demand hold
Strong bullish expansion toward resistance
→ This scenario cleans liquidity and often leads to a stronger breakout
🔹 Bias Summary
Overall Bias: Bullish
Best Long Area: Pullbacks into the orange demand zone
Invalidation: Clean break and close below the trendline + demand
Upside Objective: Previous high / upper red resistance zone
🧠 Community Reminder
“We don’t chase highs. We let price come into structure and let the market confirm.”
You can trade with us. Comment down below.

SOLANA (SOL) ANALYSIS: 3 MODELS TO TRADE THE SWEEP & BREAKOUTMARKET STRUCTURE & ANALYSIS
Solana (SOL) has been trading within a defined accumulation range. We are currently sitting in the middle "no-trade zone," waiting for a decisive move.
Smart money often hunts for liquidity before the real move begins. We have identified a High Time Frame (HTF) Sweep Zone & Order Block (Green Box) below us, and a breakout level above us.
Here are the 3 SPECIFIC MODELS to trade this setup, depending on your risk tolerance:
MODEL 1: ENTRY AT OB (HIGH RISK, HIGH REWARD) The Sniper Approach
This is the aggressive entry for traders who want the best possible price.
The Plan: Set limit orders directly inside the HTF Sweep Zone / Bullish Order Block (Green Box)
The Logic: You are "catching the knife" based on strong institutional demand in this area.
Risk: Price could continue lower. This model requires a strict Stop Loss but offers the massive Risk-to-Reward (R:R) potential.
MODEL 2: WAIT FOR THE SWEEP & TAKE ENTRY (CONSERVATIVE) The Confirmation Approach
This is the safer alternative to Model 1.
The Plan: Let the price drop into the Green Box to sweep liquidity. Do not buy yet.
The Trigger: Wait for the price to pump back up and close a 4H candle back inside the range (reclaiming the support level).
Entry: Enter on the close of that reclamation candle.
Logic: This confirms that the dip was just a "bear trap" and buyers have stepped back in.
MODEL 3: LONG AFTER BREAKOUT & RETEST (CONTINUATION) The Momentum Approach
This model plays the breakout of the upper resistance (White Line, ~$148).
The Plan: Wait for price to break clearly above the resistance.
The Trigger: Wait for a SUCCESSFUL RETEST. Price must come down, touch the old resistance, turn it into support, and bounce.
Entry: Long the bounce after the retest holds.
CRITICAL WARNING: THE "TOP LIQUIDITY SWEEP" TRAP Do not get trapped here.
Model 3 has a specific danger: The Fakeout. If price breaks above the resistance but FAILS to hold the retest (i.e., it crashes back down into the range), this was NOT a breakout. It was a Top Liquidity Sweep (a trap to catch early longs).
Rule: If the retest fails, Model 3 is invalid. Do not FOMO long at the highs without confirmation.
SUMMARY
Aggressive? Use Model 1 in the Green Box.
Conservative? Use Model 2 and wait for the reclaim.
Momentum? Use Model 3 but ONLY if the retest holds.
Which model fits your style? Let me know in the comments!
Disclaimer: This analysis is for educational purposes only. Cryptocurrency trading involves high risk. Always manage your risk properly.

GBPUSD – 4H Structure & Projection Breakdown🔹 Market Structure
Price has shifted from a downtrend into a short-term bullish structure.
We can see a series of higher lows, supported by the ascending trendline drawn from the recent swing low.
This confirms bullish market intent, but price is currently reacting at a key decision area.
🔹 Key Levels (Horizontal Lines)
1.3470 area (upper red line)
→ Major resistance / previous supply zone
→ This is the bullish target if continuation confirms
1.3360 area (current price / mid-level)
→ Short-term resistance & reaction zone
→ Acts as a decision point (break or pullback)
1.3230 area (lower red line)
→ Strong demand / support
→ Confluence with structure + trendline support
🔹 Orange Box (Reaction Zone)
This zone represents a minor supply / pullback area
Price already reacted here, suggesting:
Short-term sellers stepping in
Liquidity resting below before continuation
🔹 Arrow Projection Logic
The arrows illustrate a classic bullish continuation scenario:
Initial pullback
→ Price retraces from the orange zone
Deeper dip into support (near 1.3230)
→ Liquidity sweep + trendline support
Strong bullish reaction
→ Buyers step in from demand
Continuation toward 1.3470 resistance
→ Completion of the higher-high structure
This is not prediction, but a high-probability path if structure holds.
🔹 Bias Summary
Overall Bias: Bullish continuation
Condition:
As long as price respects the ascending trendline and 1.3230 support
Invalidation:
Clean break and close below the trendline + support
“We are in a bullish structure, but not in breakout mode yet. Patience for pullbacks into structure gives better risk and confirmation.”
To someone would trade with us... kindly comment..
