Wave Analysis

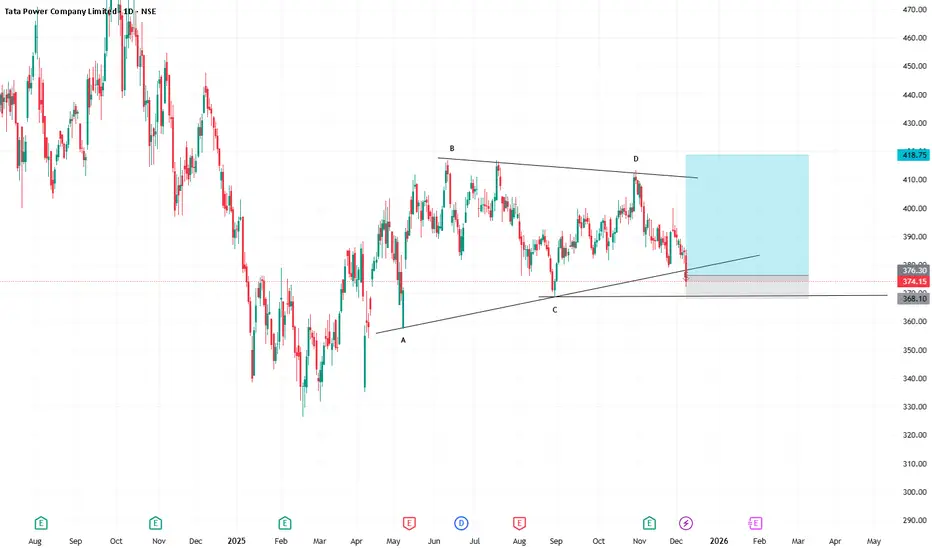
tata power stock potential for longa triangle pattern formation . elliot wave abcde pattern chance to go long on day tf
$LTC Bullish ScenarioLitecoin might be starting a bullish 5 waves to the upside
This is a possible EW counting, combined with the Litecoin Rainbow Chart indicator
Crypto Lama

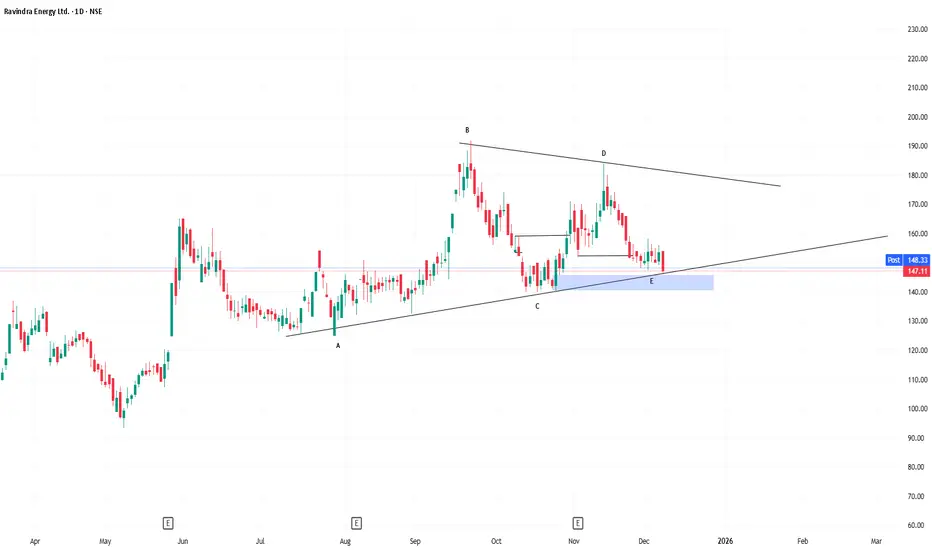
reltd in billish triangle pattern...triangle abcde formation formed any time to imlpulce wave . ready for long upto 30% tp
Analytics: market overview and forecasts
WHAT HAPPENED?
Last week, for bitcoin, we reached the upper limit of a significant support zone and almost immediately received a powerful boost. This led to a change in the local trend to an upward one.
As part of the growth, the resistance of $94,000-$97,500 (volume zone) was reached, from which the correction began. Now we've pushed off from the support of $87,800-$86,400 (volume zone) and maintain the upward context.
WHAT WILL HAPPEN: OR NOT?
The movement potential is aimed at updating the local maximum. To fully reverse the trend, the buyer needs to demonstrate more strength.
The $94,000-$97,500 zone remains relevant, as a significant part of it hasn't been tested. The implementation of a positive scenario is possible both through a confident breakdown of this range, and through the formation of a weak correction in terms of volume and price action.
A negative factor for the development of the long rally this week is the selling pressure on the spot market, as seen by the cumulative delta. The situation is better in futures, but the market needs more "fuel" for a final turnaround.
Alternative scenario: with a strong defense of the nearest resistance, a sideways trend may form in the range of $84,000-$94,000.
Buy Zones
$87,800–$86,400 (volume zone)
$84,000–$82,000 (volume anomalies)
Sell Zones
$94,000–$97,500 (volume zone)
$101,000–$104,000 (accumulated volumes)
$105,800–$106,600 (local resistance)
IMPORTANT DATES
We're following these macroeconomic developments this week:
• Tuesday, December 9, 15:00 (UTC) — publication of the number of open vacancies in the labor market (JOLTS) USA for October;
• Wednesday, December 10, 2:45 (UTC) — announcement of Canada's interest rate decision;
• Wednesday, December 10, 19:00 (UTC) — US FOMC statement and economic forecasts, as well as the announcement of the US Federal Reserve interest rate decision;
• Wednesday, December 10, 19:30 (UTC) — US FOMC press Conference;
• Thursday, December 11, 9:00 (UTC) — press conference of the National Bank of Switzerland;
• Thursday, December 11, 13:30 (UTC) — publication of the number of initial applications for unemployment benefits in the United States for the week;
Friday, December 12, 7:00 (UTC) — publication of the UK GDP for October, as well as the German consumer price index for November.
*This post is not a financial recommendation. Make decisions based on your own experience.
#analytics

EUR Multi Time Frame AnalysisThis 3 Charts Show Probable movement of EURUSD .This charts includes 1W , 1D & 4H time frames. For Short and Long term . For The best Trade We need to illustrate chart from top and higher time frame and we should know where we are . So you can think about this moves and waves .

#HOT/USDT — Testing Demand Zone: Major Accumulation or Breakdo#HOT
The price is moving in a descending channel on the 1-hour timeframe. It has reached the lower boundary and is heading towards breaking above it, with a retest of the upper boundary expected.
We have a downtrend on the RSI indicator, which has reached near the lower boundary, and an upward rebound is expected.
There is a key support zone in green at 0.000490. The price has bounced from this zone multiple times and is expected to bounce again.
We have a trend towards consolidation above the 100-period moving average, as we are moving close to it, which supports the upward movement.
Entry price: 0.000517
First target: 0.000529
Second target: 0.000545
Third target: 0.000567
Don't forget a simple principle: money management.
Place your stop-loss below the support zone in green.
For any questions, please leave a comment.
Thank you.

#FET/USDT bullish momentum#FET
The price is moving in a descending channel on the 1-hour timeframe. It has reached the lower boundary and is heading towards breaking above it, with a retest of the upper boundary expected.
We have a downtrend on the RSI indicator, which has reached near the lower boundary, and an upward rebound is expected.
There is a key support zone in green at 0.2280. The price has bounced from this level multiple times and is expected to bounce again.
We have a trend towards consolidation above the 100-period moving average, as we are moving close to it, which supports the upward movement.
Entry price: 0.2440
First target: 0.2522
Second target: 0.2630
Third target: 0.2765
Don't forget a simple principle: money management.
Place your stop-loss order below the support zone in green.
For any questions, please leave a comment.
Thank you.

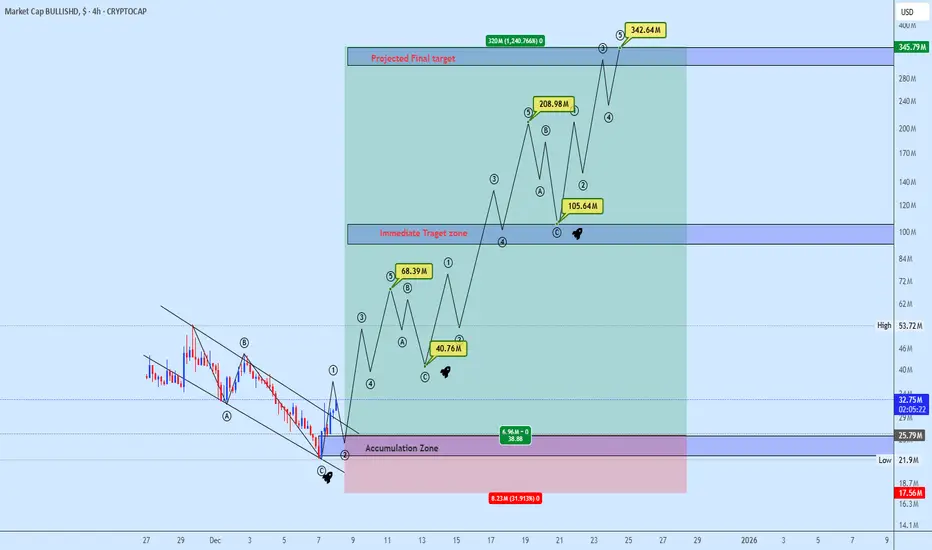
$BULLISH Expanding from Accumulation Begins Roadmap to $342MBULLISHD has completed a clean downside leg into the Accumulation Zone, where the structure has reacted with a strong impulsive breakout from the descending wedge structure. This reaction marks the beginning of a broader expansion phase, and price development now follows a multi-phase impulsive roadmap that is clearly outlined on the chart.
The immediate bullish scenario is driven by a sequence of 1–2 and 3–4 waves, suggesting a continuation path toward the Immediate Target Zone, where the first significant supply test is expected. The projected pivot areas around $40.76M → $68.39M → $105.64M form a stepping structure. Each contraction will likely generate healthy corrections, preserving momentum before continuation.
Above this region, the outlook aligns with a sustained leg into the Projected Final Target Zone with expansions toward $320M and $342.64M, representing the climax of the projected wave cycle. The strength of the community and the structured accumulation zone on the chart suggest the current breakout could be the start of a larger trend.
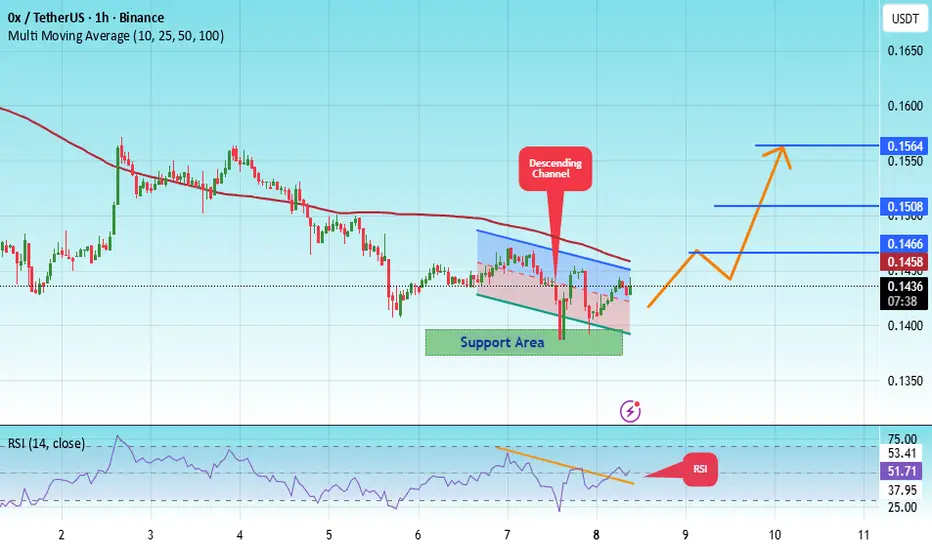
#ZRX/USDT Bullish Impulse, New All-Time High Late 2025#ZRX
The price is moving in a descending channel on the 1-hour timeframe. It has reached the lower boundary and is heading towards breaking above it, with a retest of the upper boundary expected.
We have a downtrend on the RSI indicator, which has reached near the lower boundary, and an upward rebound is expected.
There is a key support zone in green at 0.1380. The price has bounced from this level multiple times and is expected to bounce again.
We have a trend towards consolidation above the 100-period moving average, as we are moving close to it, which supports the upward movement.
Entry price: 0.1436
First target: 0.1466
Second target: 0.1508
Third target: 0.1564
Don't forget a simple principle: money management.
Place your stop-loss order below the green support zone.
For any questions, please leave a comment.
Thank you.
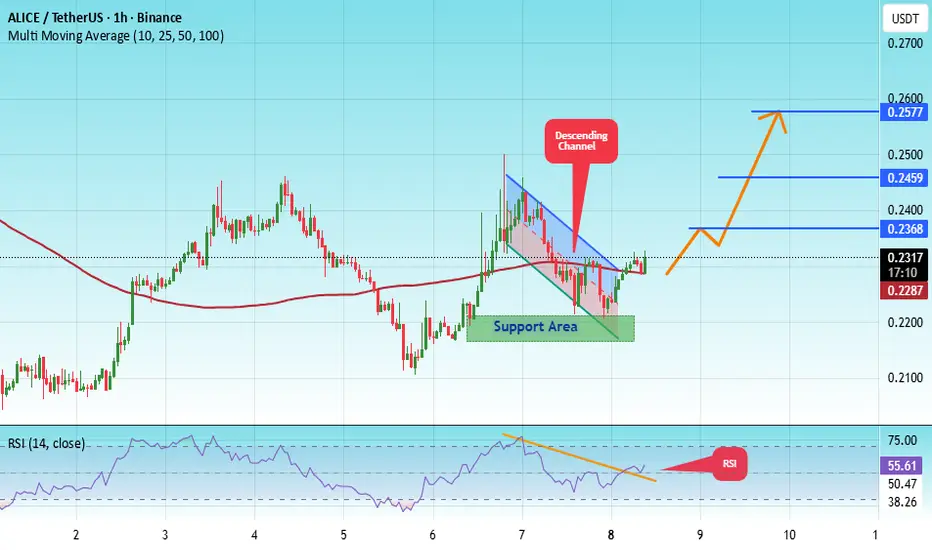
#ALICE/USDT – Potential Trend Reversal After Long Accumulation#ALICE
The price is moving in a descending channel on the 1-hour timeframe. It has reached the lower boundary and is heading towards breaking above it, with a retest of the upper boundary expected.
We have a downtrend on the RSI indicator, which has reached near the lower boundary, and an upward rebound is expected.
There is a key support zone in green at 0.2185. The price has bounced from this zone multiple times and is expected to bounce again.
We have a trend towards consolidation above the 100-period moving average, as we are moving close to it, which supports the upward movement.
Entry price: 0.2320
First target: 0.2370
Second target: 0.2460
Third target: 0.2577
Don't forget a simple principle: money management.
Place your stop-loss order below the support zone in green.
For any questions, please leave a comment.
Thank you.
GOLD → Retest of upward trend support. Focus on 4200FX:XAUUSD is trading near $4,200, remaining cautious at the start of the week ahead of the Fed's decision. The trend is bullish, with the dollar stagnating. A long squeeze of support could trigger a rebound...
The Fed is expected to cut rates by 25 bps (probability ≈90%). Weak US data supports dovish expectations
Attention is shifting to the Fed meeting and its forecasts for 2026. The lack of important US data today shifts the focus to geopolitics and general market sentiment.
There is not much news this week, but from a geopolitical point of view, attention is focused on Japan-China and Russia-Ukraine-US relations.
Gold is awaiting signals from the Fed. The decision on rates and geopolitical news will determine the direction of the breakout from the current range.
Resistance levels: 4220, 4256
Support levels: 4200, 4195, 4180
The dollar previously broke through the support of the uptrend, but has been stagnating for the past few days. A break below 99.0 could trigger a decline in the index, which could support the price of gold.
Gold is testing the support of the trading range within the uptrend. Focus on the 4200-4195 zone. A long squeeze could trigger growth amid a weak dollar...
Best regards, R. Linda!

USDJPY 30-Min — Volume Buy & sell Reversal Triggered⚡Base : Hanzo Trading Alpha Algorithm
The algorithm calculates volatility displacement vs liquidity recovery, identifying where probability meets imbalance.
It trades only where precision, volume, and manipulation intersect —only logic.
✈️ Technical Reasons
/ Direction — LONG / Reversal 155.100 Area
☄️Bullish momentum confirmed through strong candle body.
☄️Structure shifted with higher-low near key demand base.
☄️Volume expanding confirms order-flow alignment upward.
☄️Buyers reclaimed imbalance with sustained clean break.
☄️Algorithm detects rising momentum under low liquidity.
✈️ Technical Reasons
/ Direction — SHORT / Reversal 156.000 Area
☄️Bearish rejection confirmed through sharp candle body.
☄️Lower-high forming beneath resistance supply region.
☄️Volume decreasing confirms exhaustion in price rally.
☄️Sellers regained imbalance with heavy top rejection.
☄️Algorithm detects fading demand and shift to control.
⚙️ Hanzo Alpha Trading Protocol
The Alpha Candle defines the day’s real control zone — the first battle of momentum.
From this origin, the Volume Window reveals where the next precision strike begins.
⚙️ Hanzo Volume Window / Map
Window tracked from 10:30 — mapping true market behavior.
POC alignment exposes institutional bias and breakout potential zones.
⚙️ Hanzo Delta Window / Pulse
Delta window monitors real buying vs. selling power behind each move.
Tracks volume aggression to expose who controls the candle — buyers or sellers.
When Delta aligns with Volume Map, momentum becomes undeniable.

BTCUSD - Short term bearishBTCUSD is currently completing a wxy correction and its showing that the H4 bull trend is a correcting to complete the internal abc correction. Be careful of buying in the middle of a trend. At least I would wait for it to break the lows before considering longs.

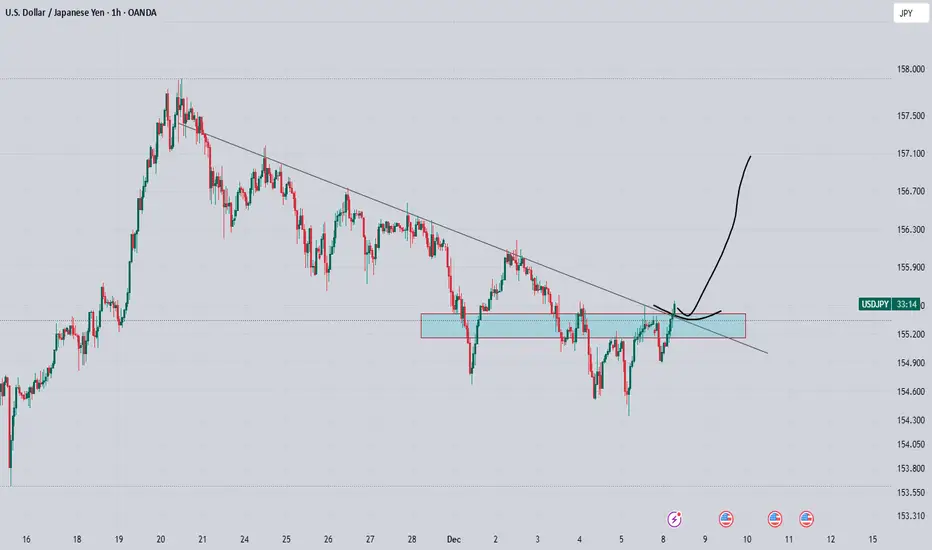
usdjpy looking bullish over all trend is bullish and now trying to break this trendline, successful breakout of tl and horizontal zone can lead 100 pips bullish rally from here
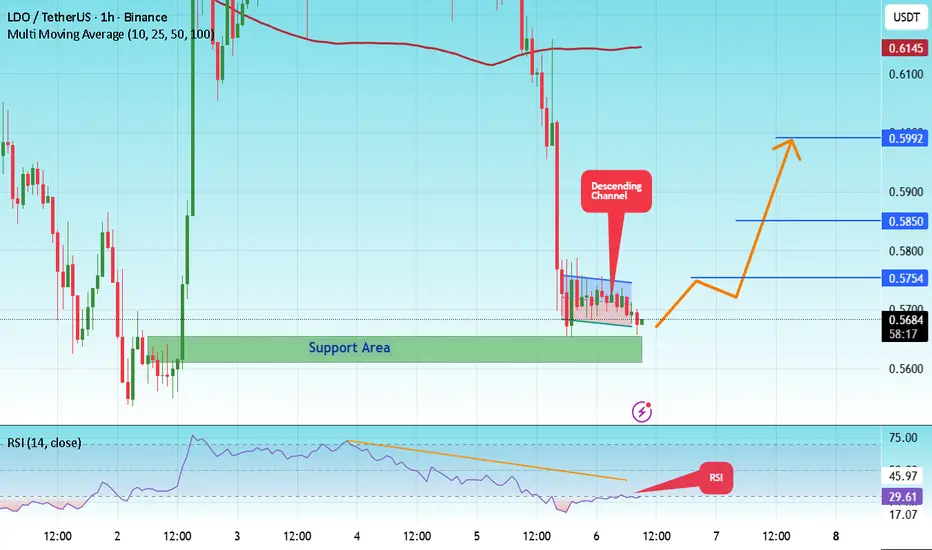
#LDO/USDT — Critical Retest at Demand Zone vs Long-Term Downtr#LDO
The price is moving in a descending channel on the 1-hour timeframe. It has reached the lower boundary and is heading towards a breakout, with a retest of the upper boundary expected.
We are seeing a bearish bias in the Relative Strength Index (RSI), which has reached near the lower boundary, and an upward bounce is expected.
There is a key support zone in green at 0.5635, and the price has bounced from this level several times. Another bounce is expected.
We are seeing a trend towards stabilizing above the 100-period moving average, which we are approaching, supporting the upward trend.
Entry Price: 0.5673
First Target: 0.5757
Second Target: 0.5850
Third Target: 0.5992
Remember a simple principle: Money Management.
Place your stop-loss order below the green support zone.
For any questions, please leave a comment.
Thank you.
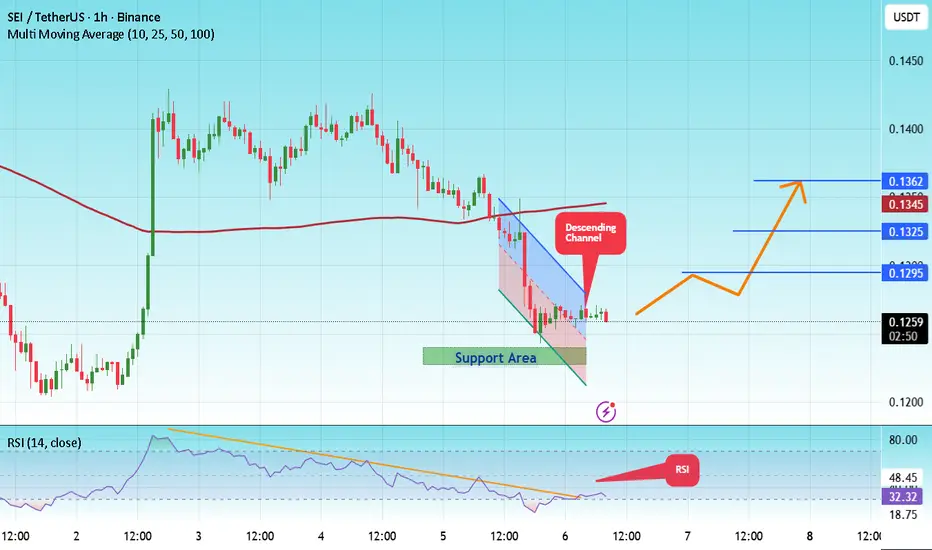
#SEI/USDT - Final Support Before a Major Reversal or Breakdown#SEI
The price is moving in a descending channel on the 1-hour timeframe. It has reached the lower boundary and is heading towards a breakout, with a retest of the upper boundary expected.
We are seeing a bearish trend in the Relative Strength Index (RSI), which has reached near the lower boundary, and an upward bounce is expected.
There is a key support zone in green at 0.1235, and the price has bounced from this level several times. Another bounce is expected.
We are seeing a trend towards stabilizing above the 100-period moving average, which we are approaching, supporting the upward trend.
Entry Price: 0.1262
First Target: 0.1295
Second Target: 0.1325
Third Target: 0.1362
Remember a simple principle: Money Management.
Place your stop-loss order below the green support zone.
For any questions, please leave a comment.
Thank you.
Quick Bitcoin Update (4H)The corrective phase of Bitcoin is an expanding triangle/diametric/symmetrical , with wave C completed and now we are inside wave D. This is a bullish D wave.
There is still time remaining for wave D to complete.
We have marked a green box below the price; if the price reaches this area, we can look for long/buy positions.
Look for long/buy positions in the red box, as there are many sell orders placed there.
For risk management, please don't forget stop loss and capital management
When we reach the first target, save some profit and then change the stop to entry
Comment if you have any questions
Thank You

New update on Tether Dominance (4H)Based on the previous analysis, which you can see in that post (), the price did not move above the defined supply zone and headed downward. We have now analyzed Tether Dominance on the four-hour timeframe.
Now it seems it may have another drop ahead and move toward the green zone. The best area for a rejection is the red zone.
This would make Bitcoin and some altcoins more bullish.
As long as this index has not reached the green zone, look for buy/long positions.
For risk management, please don't forget stop loss and capital management
When we reach the first target, save some profit and then change the stop to entry
Comment if you have any questions
Thank You

AUDCAD: Bullish Continuation is Expected! Here is Why:
Balance of buyers and sellers on the AUDCAD pair, that is best felt when all the timeframes are analyzed properly is shifting in favor of the buyers, therefore is it only natural that we go long on the pair.
Disclosure: I am part of Trade Nation's Influencer program and receive a monthly fee for using their TradingView charts in my analysis.
❤️ Please, support our work with like & comment! ❤️

Bitcoin Roadmap | Short-termBitcoin( BINANCE:BTCUSDT ) began to decline from the resistance zone($95,020-$94,840) exactly as expected in my previous idea , successfully reaching all targets.
At the moment, Bitcoin was able to break the support zone($90,650-$90,000). It seems that the pullback to the broken support zone($90,650-$90,000) could be completed with a symmetrical triangle pattern, although given the low trading volume on Saturday and Sunday, this triangle may not function properly.
In terms of Elliott Wave theory, Bitcoin appears to be completing the microwave C of the main wave B, and I expect at least one more impulsive 5-wave move to the upside.
I expect Bitcoin to start rising from the support zone($89,230-$88,000) or the Potential Reversal Zone(PRZ) maximum. A break of the resistance lines could be a good sign for Bitcoin to rise again.
What do you think? Do you believe Bitcoin will dip below $75,000, or will it bounce back?
Cumulative Short Liquidation Leverage: $98,260-$96,690
Cumulative Short Liquidation Leverage: $90,560-$89,990
Cumulative Long Liquidation Leverage: $87,820-$87,290
Cumulative Long Liquidation Leverage: $83,900-$82,400
First Target: $89,911
Second Target: $92,119
Stop Loss(SL): $86,120(Worst)
Points may shift as the market evolves
💡 Please respect each other's opinions and express agreement or disagreement politely.
📌Bitcoin Analysis (BTCUSDT), 1-hour time frame.
🛑 Always set a Stop Loss(SL) for every position you open.
✅ This is just my idea; I’d love to see your thoughts too!
🔥 If you find it helpful, please BOOST this post and share it with your friends.

USDJPY: Short Trade Explained
USDJPY
- Classic bearish formation
- Our team expects pullback
SUGGESTED TRADE:
Swing Trade
Short USDJPY
Entry - 155.39
Sl - 155.54
Tp - 155.15
Our Risk - 1%
Start protection of your profits from lower levels
Disclosure: I am part of Trade Nation's Influencer program and receive a monthly fee for using their TradingView charts in my analysis.
❤️ Please, support our work with like & comment! ❤️

#ETH/USDT (1h) (spot)#ETH
The price is moving in a descending channel on the 1-hour timeframe. It has reached the lower boundary and is heading towards a breakout, with a retest of the upper boundary expected.
We are seeing a bearish trend in the Relative Strength Index (RSI), which has reached near the lower boundary, and an upward bounce is expected.
There is a key support zone in green at 2970, and the price has bounced from this level several times. Another bounce is expected.
We are seeing a trend towards stabilizing above the 100-period moving average, which we are approaching, supporting the upward trend.
Entry Price: 30019
First Target: 3058
Second Target: 3124
Third Target: 3202
Remember a simple principle: Money Management.
Place your stop-loss order below the green support zone.
For any questions, please leave a comment.
Thank you.
