GBPJPY: Bearish Forecast & Outlook
The price of GBPJPY will most likely collapse soon enough, due to the supply beginning to exceed demand which we can see by looking at the chart of the pair.
Disclosure: I am part of Trade Nation's Influencer program and receive a monthly fee for using their TradingView charts in my analysis.
❤️ Please, support our work with like & comment! ❤️
Wave Analysis

$ZM breaking out. Structure looks good for $100 NASDAQ:ZM breaking out. Structure looks good for $100 in the coming weeks/months.
Zoom Communications is a profitable, cash-rich platform that’s slowly re-accelerating through enterprise + AI, with buybacks cushioning dips.

GOLD: Short Trade with Entry/SL/TP
GOLD
- Classic bearish formation
- Our team expects pullback
SUGGESTED TRADE:
Swing Trade
Short GOLD
Entry - 4234.9
Sl - 4245.4
Tp - 4216.4
Our Risk - 1%
Start protection of your profits from lower levels
Disclosure: I am part of Trade Nation's Influencer program and receive a monthly fee for using their TradingView charts in my analysis.
❤️ Please, support our work with like & comment! ❤️

Gold in extended bullish Gold is anti fall commedity seriously speaking not a joke !
Well, currently we formed a newly bullish cycle targeting 4444 . 4500 $
Best places to buy : 4175 . 4150 . 4124
Invalidation and reassesment only if daily close below 4100$

Selena | XAUUSD 2H — Bullish Continuation SetupFOREXCOM:XAUUSD
Market Overview
Price has built liquidity through multiple sweeps and consolidations, suggesting a possible continuation phase. If price retests the demand zone and holds, buyers may step in to push toward upper structure resistance levels.
Key Scenarios
✅ Bullish Case 🚀
If price holds above 4,157 zone
→ 🎯 Target 1: 4,300
→ 🎯 Target 2: 4,375–4,400 (major resistance / channel top)
❌ Bearish Case 📉
Break and close below 4,052 invalidation zone
→ 🎯 Downside Target: 4,000–3,950 support range
Current Levels to Watch
Resistance 🔴: 4,300 | 4,375–4,400
Support 🟢: 4,157 | 4,122 (demand zone)
Invalidation ⚠️: 4,052
⚠️ Disclaimer: This analysis is for educational purposes only — not financial advice.

EURCAD Expected Growth! BUY!
My dear subscribers,
This is my opinion on the EURCAD next move:
The instrument tests an important psychological level 1.6182
Bias - Bullish
Technical Indicators: Supper Trend gives a precise Bullish signal, while Pivot Point HL predicts price changes and potential reversals in the market.
Target - 1.6228
About Used Indicators:
On the subsequent day, trading above the pivot point is thought to indicate ongoing bullish sentiment, while trading below the pivot point indicates bearish sentiment.
Disclosure: I am part of Trade Nation's Influencer program and receive a monthly fee for using their TradingView charts in my analysis.
———————————
WISH YOU ALL LUCK

NZDCAD– Bullish “Market is forming a bullish ABC structure. Wave C may continue upward if support holds.”

XAUUSD – Bullish Continuation from Demand Block|Market StructureOANDA:XAUUSD
Price reacted sharply from the demand zone around 4,175 – 4,190, validating ongoing bullish structure.
As long as price holds above trend support, a move toward liquidity at 4,263 – 4,270 remains the primary expectation.
Bullish Plan
Entry Area → 4,220 – 4,230 (after retest)
🎯 Target → 4,263 – 4,270
📌 If price breaks above → bullish extension likely continues
Invalidation
❌ Close below 4,195 breaks structure & shifts control to sellers
⚠️ Disclaimer: This is not financial advice. Purely educational analysis.

NZDJPY Buyers In Panic! SELL!
My dear friends,
Please, find my technical outlook for NZDJPY below:
The instrument tests an important psychological level 89.694
Bias - Bearish
Technical Indicators: Supper Trend gives a precise Bearish signal, while Pivot Point HL predicts price changes and potential reversals in the market.
Target - 89.517
Recommended Stop Loss - 89.787
About Used Indicators:
Super-trend indicator is more useful in trending markets where there are clear uptrends and downtrends in price.
Disclosure: I am part of Trade Nation's Influencer program and receive a monthly fee for using their TradingView charts in my analysis.
———————————
WISH YOU ALL LUCK

Going Short On Gold (XAUUSD)Price is still showing signs of bullish continuation, but we need to pay attention to the current structure. The previous resistance on the 5-minute timeframe is now acting as support, and that level also aligns with the high of the day.
If price breaks below this support zone, it opens the door for a deeper decline, with a downside target around the 4,200 price level. A clean break and sustained trading below that area could extend the move further down.
However, if price respects this support and fails to break beneath it, we can expect bullish continuation, with momentum building upward as demand continues to hold.
Right now, the market is positioned at a decision point either reclaim support and continue pushing up, or break it and transition into a deeper sell-side run. Keep an eye on the reaction at that level.

BitcoinBitcoin currently traded at third corrective bullish wave from recent lower high so forcasted retracement to range from 90k to 88k with invalidation point which close daily below 86k . Target for third bullish corrective wave is 102k .

BTC/USDT Analysis. Moving Within the Expected Scenario
Hello everyone! CryptoRobotics trader-analyst here, and this is your daily analysis.
Yesterday, Bitcoin continued its correction after reaching the key resistance zone.
The price has now approached $91,000–$89,800 (mirror volume zone). Volume has slightly increased at this level, but we still do not see a confident reaction from buyers.
We expect a local bounce and a potential break of the recent high once a reversal structure forms on lower timeframes — volume anomalies, buyer clusters, and a local trend shift.
If no reaction appears in this area, the decline may extend toward the next support at $87,800–$86,400 (volume zone).
At the moment, the priority remains on long setups — the upside potential is stronger, and the probability of bullish continuation remains elevated.
Buy Zones
$91,000–$89,800 (mirror volume zone)
$87,800–$86,400 (volume zone)
$84,000–$82,000 (volume anomalies)
Sell Zones
$94,000–$97,500 (volume zone)
$101,000–$104,000 (accumulated volumes)
$105,800–$106,600 (local resistance)
This publication is not financial advice.

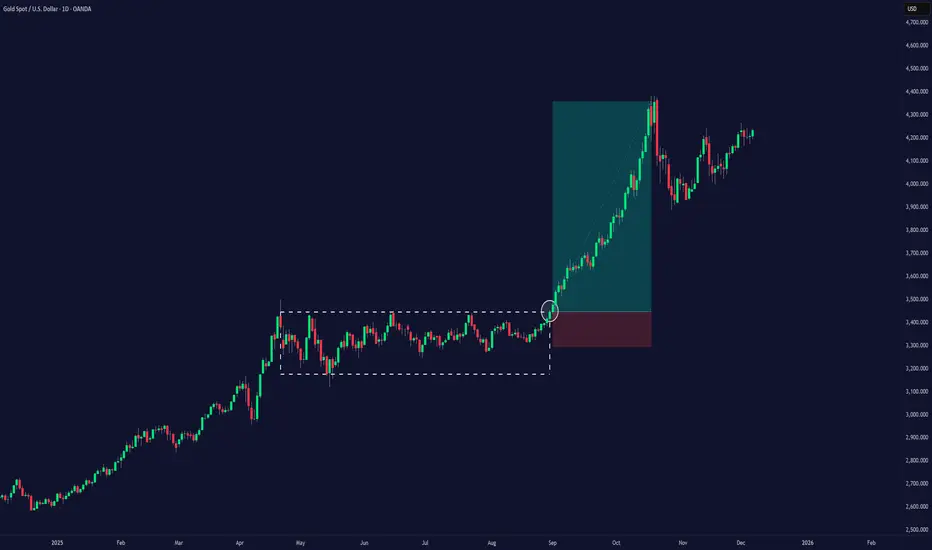
GOLD to ATH?If you look at the daily chart it really does tune out most of the noise we see intraday. While i do see a pullback on the horizon, i also see what appears to be a massive flag forming. Im watching for a break of the measured structures .768 extenstion level, which is the exact .768 retracement of the structure to the downside, depicted with yellow trend line.
If we are unable to break that level with momentum to the upside, then we will most likely fall to test the first standard fib supports of the move up, circled in blue, before attempting another break out

$INJ 1H CHART UPDATE 📌 CRYPTOCAP:INJ is currently showing a price decline ✅
📌 CRYPTOCAP:INJ could be in a bullish reversal again from the green SUPPORT ZONE below 💹
📌Be careful of that Range ! If that happens, CRYPTOCAP:INJ will reach $6+ again 🔥💸

Breakout Trading: How Low Win-Rate Systems Beat the Market█ Breakout Trading: How Low Win-Rate Systems Beat the Market
Most traders misunderstand breakout strategies. They expect high win-rates, smooth equity curves, and clean continuation.
But real breakout systems operate differently:
Low win-rate
Many small losses
Occasional massive winners
And long periods of nothing
A breakout strategy is not about predicting direction. It is about exploiting asymmetry, volatility expansion, and structural price imbalances. It is not about being right often; it is about being paid well when you are right.
█ What a Breakout Really Is
A breakout occurs when the price finally moves out of a range or breaks through a key level. It is not magic, and it is not random. It is mechanics, liquidity, and pressure.
Inside a range or right at a major level:
Liquidity builds on both sides
Stops accumulate above resistance and below support
Traders wait for confirmation
Algorithms sit idle during volatility contraction
When price pushes through a key level, it triggers a chain reaction:
stop orders → breakout entries → momentum algos → forced exits. This cascade is what creates the explosive leg everyone tries to catch.
In simple terms , a breakout happens when the price moves outside a well-defined support or resistance zone with strong momentum. This surge often marks the beginning of a new trend, a volatility expansion, or a major shift in market sentiment.
Breakouts appear in every asset class: stocks, futures, crypto, forex, and commodities, and on every timeframe from minutes to weeks. They are popular because when they succeed, they can deliver large, rapid moves and outsized profits.
But here is the part most traders ignore:
Most breakouts do not follow through. False breaks are common, and markets have become more efficient over time. Only breakouts with the right conditions, such as momentum, liquidity imbalance, and volatility expansion, have a high probability of running.
█ The Truth Most Traders Don’t Want to Hear
Most breakouts fail. Even strong breakout systems may only win 20 to 40 percent of the time.
Why does this happen?
Many breakout levels are weak
Liquidity is thin around obvious highs and lows
Algorithms hunt stop clusters before the real move
Price often snaps back into the range before expanding
But here is the part that actually matters:
Breakouts do not need a high win rate.
They need high asymmetry.
Small, controlled losses.
Occasional large, runaway winners.
This is the core structure behind every profitable breakout strategy.
⚪ Win-Rate and Risk/Reward: What Traders Should Actually Expect
The simple overview above is backed by decades of quantitative research. Breakout systems consistently show low win-rates but high R-multiple payoffs, and this is not an opinion. It is a measurable statistical pattern across markets and timeframes.
1. Low Win-Rate Is Normal and Expected
Across studies, breakout strategies typically win between 20 and 40 percent of the time.
Research by Bulkowski, academic momentum studies, and intraday ORB tests all show the same thing:
Breakouts frequently fail
Modern markets generate more false breaks than in the past
Algorithms exploit obvious levels and stop clusters
Short-term price action is dominated by mean reversion
A low hit rate is not a flaw. It is the natural behavior of breakout mechanics.
2. The Edge Comes From Asymmetric Payoff Distribution
A breakout strategy becomes profitable not by winning often, but by winning big relative to the risk taken.
Historical performance shows:
Losers: usually −1R
Winners: often +3R, +5R, +10R and beyond
When a system captures even a few of these extended moves, it more than pays for the many small stop-outs.
3. Breakout Systems Exploit Fat Tails and Volatility Expansions
Financial returns are not normal. They are fat-tailed. Breakouts are designed to capture these rare, outsized price moves.
The return distribution typically looks like:
Many small losses from failed breaks
A few large wins during volatility expansion
Long flat periods during range-bound conditions
Occasional massive trends that define the entire year
This right-skewed distribution is well-documented in momentum and trend-following research.
4. Academic and Quant Research Confirms the Pattern
Multiple studies validate the same expectations:
Zarattini, Barbon & Aziz (2024): ORB strategy on “stocks in play” produced over 1,600 percent return with modest win-rates
Moskowitz, Ooi & Pedersen: Trend-following (a breakout variant) shows positive expectancy across a century of data
Bulkowski: Breakout failure rates increase over time, confirming the need for filters and asymmetry
CTA/Managed Futures: Long-term breakout systems show strong convexity; a few big winners generate the majority of returns
The conclusion is clear:
Breakout strategies work when they harness asymmetry, not prediction.
█ Example: Breakout System 1
Win-rate: 20.28%
Breakout System Gain: +274%
Buy & Hold Gain: +96%
Explanation of the chart:
Flat periods → range markets
Dips → false breaks and stop-outs
Explosive steps upward → successful breakouts that trend hard
This step-like equity curve is the fingerprint of all trend-and-breakout systems.
█ Example: Breakout System 2
This system shows the same profile:
Many trades fail, but losses stay small
Occasionally a breakout runs far enough to cover dozens of losses
The equity curve’s “zig-zag then spike” pattern is normal behavior
The system wins big because the winners are massive R-multiples, not because it’s right often
This is the signature of low win-rate, high reward asymmetry.
█ The Real Mechanics Behind a Successful Breakout
A real breakout is powered by multiple forces hitting at once:
New longs entering / new shorts entering (initiative flow)
Stops being triggered (forced participation)
Short covering or long liquidation (fuel)
Algos joining the momentum (acceleration)
Volatility expansion is making moves larger
⚪ Read more about what makes prices move up and down:
█ What Makes Breakout Strategies Hard for Humans
Breakout trading is psychologically painful because:
You lose often
You sit through boring periods
Most trades look like “nothing happens”
Only a few trades create 80–90% of the long-term profits
To succeed, you need:
Patience
Small, consistent risk
The discipline to let winners run
The acceptance that many trades will fail
Breakout success = emotional resilience + asymmetry, not prediction.
█ The Takeaway
Breakout strategies are simple in theory and brutal in practice:
Low win-rate
High reward
Long quiet periods
Occasional massive expansions
Step-like equity curves
Outperformance through asymmetry
In the end:
You don’t trade breakouts to be right often — you trade breakouts to get paid big when the market finally moves.
-----------------
Disclaimer
The content provided in my scripts, indicators, ideas, algorithms, and systems is for educational and informational purposes only. It does not constitute financial advice, investment recommendations, or a solicitation to buy or sell any financial instruments. I will not accept liability for any loss or damage, including without limitation any loss of profit, which may arise directly or indirectly from the use of or reliance on such information.
All investments involve risk, and the past performance of a security, industry, sector, market, financial product, trading strategy, backtest, or individual's trading does not guarantee future results or returns. Investors are fully responsible for any investment decisions they make. Such decisions should be based solely on an evaluation of their financial circumstances, investment objectives, risk tolerance, and liquidity needs.
short term long on goldwww.tradingview.com
FX:XAUUSD
according to (Fib 618) the price of gold may go down to 4190-4195 as we notice a huge buyers are located in that area on 15min chart.
I thing in a short term the price will bull from that area and head to its previous high 4215-4220.

Gold & Silver sell trade imminent. It’s not so much an overbought thing for gold and silver because daily RSI is at 70 but not quite near historical RSI highs.
It’s the inverse thing.
Watch for the USD index to turn today to take it hard towards parity over a few sessions next week crossing the 200Ema & then it will subtly reverse engineer moving into that support level for more buying safe haven. .
It creates safe haven buying which might be needed for the FED interest rate reduction causing the frenzy of buying demand, sellers will have had their move first and the safe haven buy trade.
Vix daily is aesthetically perfect as the bottom left leg forms around 15.00 and then volatility will further support my own theory that the USDX will breakout over parity , see my other post, EURUSD and GBPUSD Buy trade is the focus as they take the USD on weakness up around 102.50 to 103.00
Gold target short is daily candle from 24 November, about 4115 to 4125 Tp. Stop loss could go above the Monday high of 4265 . Price at time of writing is 4225 and Short confirmations on intraday confirm the trade.
5m or 2m chart sell break below 4215 and stop loss 4233. TP can still aim at 4120
* infomercial purposes only. The trade is supported by USD INDEX turning bullish after a bearish pattern on daily

EURJPY: Buyers React at 180 Support ZoneEURJPY: Buyers React at 180 Support Zone
EURJPY continues to trade inside a broad corrective structure and today dropped sharply following a strong sell-off across all JPY pairs.
The pair found significant support near the lower boundary of the pattern, around the 180.00 zone. Price reacted immediately from this level, suggesting that buyers may attempt to recover part of the intraday losses.
At the moment, I am expecting a potential short-term correction toward 180.80 and 181.25. The move is relatively small, so I will be watching price action into tomorrow to see whether momentum strengthens or fades.
You may find more details in the chart!
Thank you and Good Luck!
❤️PS: Please support with a like or comment if you find this analysis useful for your trading day❤️

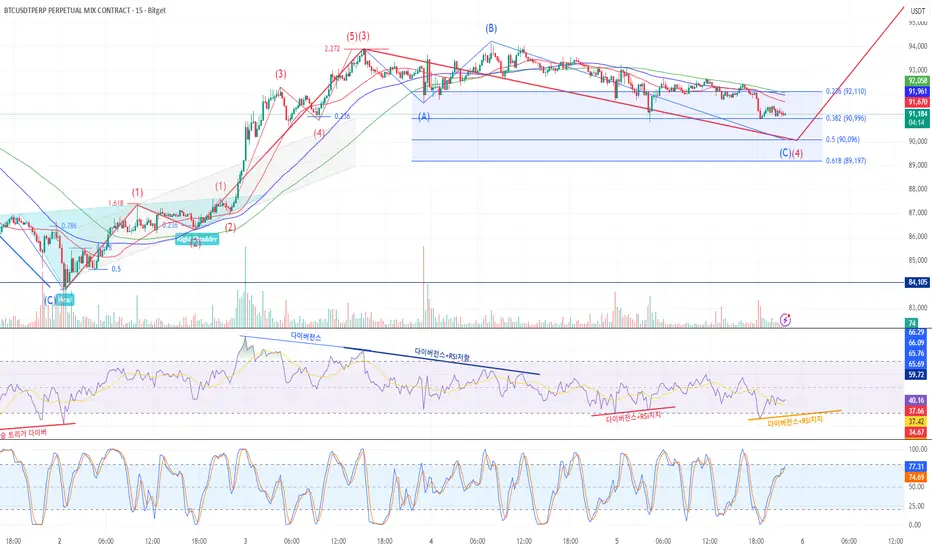
Depend on divergence and RSI support signalsBitcoin 15-Minute Chart Analysis
The larger Wave ③ initiated after a breakout above an inverse head and shoulders pattern.
Wave ③ appears to have completed near the 2.272 Fibonacci extension, followed by a divergence, signaling the start of a correction.
A mild A–B corrective rebound occurred, then another drop followed after a second divergence and RSI resistance.
Currently, moving averages remain in a bearish alignment (death cross).
Refer to Fibonacci retracement levels to gauge the depth of Wave ④.
Wave ④ completion will depend on the presence of divergence and RSI support signals.
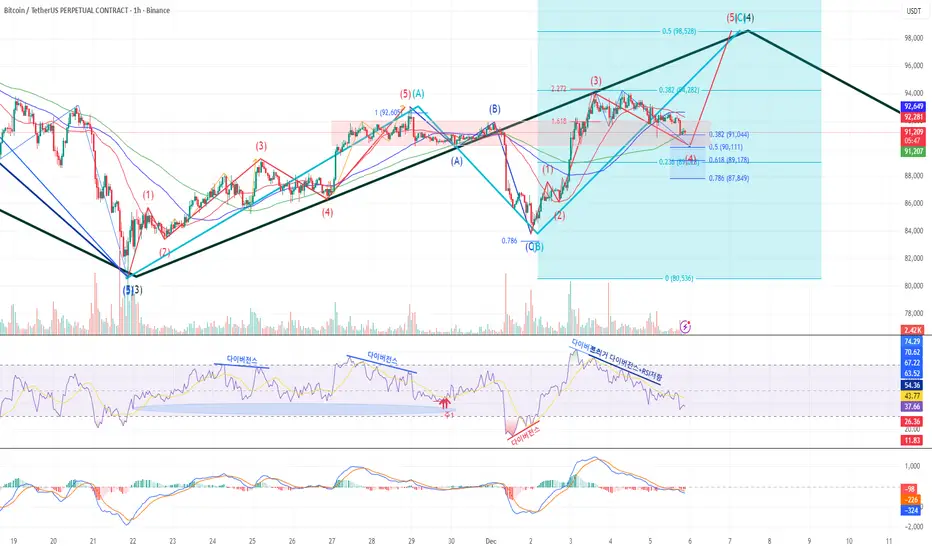
The larger Wave ④Bitcoin 1H Chart Analysis
Currently tracking a light blue ABC correction within the larger Wave ④.
Wave C is unfolding as a 5-wave structure; currently in Wave ④.
Adjusted the wave count this morning: what was initially labeled as Wave ① is now considered Wave ③, due to its extended size.
Wave ③ appears to have completed near the 2.272 Fibonacci extension.
A divergence formed, leading to the current Wave ④ pullback, which is finding support at a key supply-demand zone.
Watch for a MACD oscillator crossover — this could signal the start of Wave ⑤.
Focus on reactions at the support zone for trade decisions.
The larger Wave ③–④ structureBitcoin 4H Chart Analysis
Currently in an ABC correction within the larger Wave ③–④ structure.
Wave B completed around the 0.786 Fibonacci retracement of Wave A.
Wave C is now unfolding as an upward move.
Within Wave C, the internal 5-wave structure is in progress.
Wave ③ of C has completed, followed by a trigger divergence and RSI resistance.
Currently in a Wave ④ pullback.
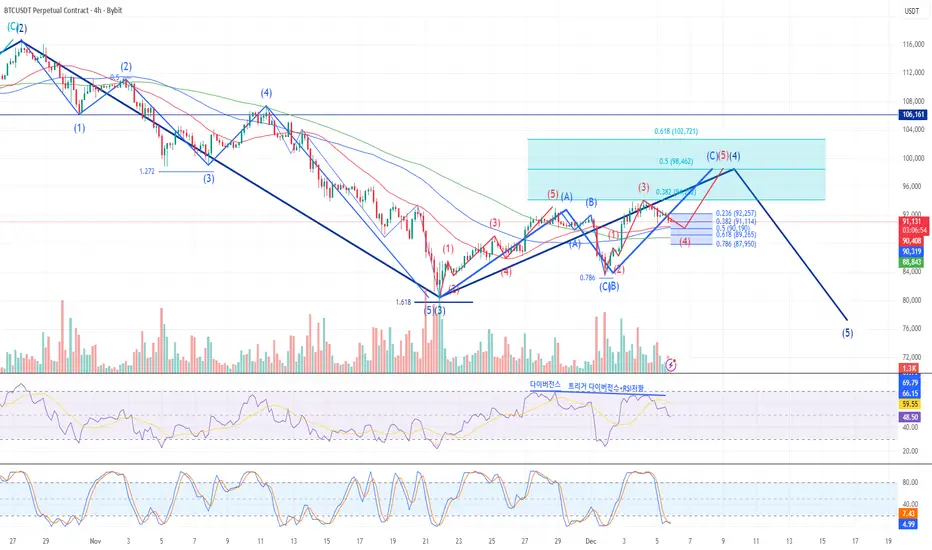
Wave ④ is unfolding as an internal ABC corrective bounce.Bitcoin Daily Chart Analysis
Currently in progress: a 5-wave structure within the larger Wave B–C decline.
Wave ③ appears to have completed near the 1.618 Fibonacci extension.
After exiting RSI oversold territory, a rebound followed.
Wave ④ is unfolding as an internal ABC corrective bounce.
Wave C of ④ is currently in progress, facing resistance at the 60-day EMA, leading to a mild pullback.

A running flat ABCBitcoin Weekly Chart Analysis
After completing Wave ③ of the larger impulse, a running flat ABC correction is unfolding.
A trigger divergence and RSI resistance led to a corrective move.
Wave A found support and completed around the 60-week EMA, followed by a rebound.
After an irregular Wave B, another trigger divergence emerged, initiating Wave C.
Currently, price is holding above the 90-week EMA, but the RSI still has unfilled downside space, suggesting potential for a deeper move before a reversal.
Watch the Fibonacci retracement zones for potential support levels during this correction.
