BTC: The Chart Designed to Wreck You (102k Incoming?)This current correction is extremely deceptive. I have re-labeled this chart more than 8 times, and this is arguably one of the trickiest price actions I’ve seen in my trading experience.
I am sharing this strictly for educational purposes only.
Honestly, trading a complex correction like this is reckless. I see people calling "longs" just because the correction is technically an uptrend or because of some EMA signal— Trading the direction of a correction drastically lowers your win rate compared to trading the main trend. This price action is designed to liquidate reckless and inexperienced people—you won't see it coming.
The structure might be shaping up as a Expanding Triangle to complete a W-X-Y correction.
* **W:** Zigzag
* **X:**
* **Y:** Expanding Triangle (Current)
Unlike standard triangles that contract, this structure shows increasing volatility. In these specific "Expanding" setups, the final Wave E often exhibits a blow-off top expanding significantly in price.
Potential Target:
If the "blow-off" play out, we could see a thrust toward **98,000 – 102,000**
Critical Levels & Invalidation:
- Watch **87,777**. If this level breaks, assume Wave D is extending.
* **Invalidation:** If **84,398** is broken, then this entire triangle idea is invalid.
* **C-5 Confirmation:** If the **80,604** is lost, it confirms C-5 is underway.
Wave Analysis

Gold Update 22JAN2026: Check The Power Of TrendlinePrice follows the path posted last week and even broke out of small uptrend
How far it can go further up?
I switched to a weekly chart and added the trendline built through the peaks of waves 1 and 3
in yellow - it offers strong resistance in $4,950-5,000 area as price usually respects such large trendlines
I also checked the size of wave 5 compared to wave 1-3 distance - it reached whopping 1.618x of it compared to normal 0.618-1x
Indeed, commodities tend to have extended fifth waves and this extended size is still good
RSI on weekly as well as on daily shows Bearish Divergence, this is not the action alert but the
indicator of the final stage
Let's watch how the price reacts to the trendline as this is the only resistance at the moment
The breakdown point now is set at the bottom of the tiny wave 4 at $4,284

1more push to make gold xauusd expensive again/aththis horse has bolted already
one trick pony learns nothing new

$SPY & $SPX — Market-Moving Headlines Thursday Jan 22, 2026🔮 AMEX:SPY & SP:SPX — Market-Moving Headlines Thursday Jan 22, 2026
🌍 Market-Moving Themes
🧠 Relief Rally Test
Markets face a reality check as growth and labor data hit after tariff-driven volatility
💻 Intel Earnings Focus
Intel reports after the close with AI server demand and data center share in focus
🏦 Consumer Credit Scrutiny
Capital One earnings test credit quality amid political pressure on card rates
⚡ Energy Infrastructure Spillover
Kinder Morgan earnings strength lifts attention on pipelines tied to AI power demand
🎮 High-Beta Aftershocks
Meme and media names remain volatile following insider buying and deal reactions
📊 Key U.S. Economic Data Thursday Jan 22 ET
8:30 AM
- Initial Jobless Claims Jan 17: 208K
- GDP Q3 first revision: 4.3%
10:00 AM
- Personal Income Nov delayed: 0.4%
- Personal Spending Nov delayed: 0.5%
- PCE Index Nov delayed: 0.2%
- Core PCE Index Nov delayed: 0.2%
- Core PCE YoY
⚠️ Disclaimer: For informational purposes only. Not financial advice.
📌 #SPY #SPX #Macro #GDP #PCE #Jobs #Earnings #AI #Energy #Markets #Stocks #Options

Sandisk - Final PushLooking at the chart, we see that we are drawing the 5th and final wave of the uptrend.
Remaining movement: 3-18 %.
Key targets:
395
454
After reaching these targets, we expect a correction
---
Please subscribe and leave a comment!
You’ll get new information faster than anyone else.
---

XAUUSD 30M: Parabolic Rally Rejection Targeting DemandOANDA:XAUUSD
Gold made a strong impulsive rally into the 4880–4890 area.
Historically, when Gold accelerates this fast on the 30-minute timeframe:
It attracts late breakout buyers
Volatility expands near highs
Continuation becomes statistically weaker, not stronger
Gold rarely keeps trending cleanly after a parabolic leg — it usually corrects back to structure first.
2. Rejection at Prior Highs (Distribution Zone)
The zone around 4875–4885 aligns with:
Prior session highs
Psychological resistance
Previous supply reactions
Historically:
Failure to hold above prior highs = distribution
Multiple upper wicks and choppy candles = sellers absorbing buy pressure
This is where institutions offload longs, not initiate new ones
That makes this area a sell-from-strength zone, not a breakout zone.
3. Entry Logic (4832 Area)
The short entry is not at the top, but after confirmation:
Price breaks short-term bullish structure
Pullback fails to reclaim previous support
Prior support flips into resistance
Historically, this sequence in Gold signals:
Trend pause → correction phase
Buyers losing control
Sellers gaining acceptance below structure
This avoids emotional top-picking and aligns with how Gold actually reverses.
4. RSI Confirms Regime Shift
RSI(14) rolls over from above 60 toward 40.
Historically in Gold:
RSI above 60 = bullish impulse
Failure to hold above 50 = trend exhaustion
RSI drifting toward 40 during pullbacks = bearish continuation phase
This confirms the move is distribution → correction, not consolidation.
5. Stop Loss Logic (Above 4878)
Stop above 4878–4885 is logical because:
A reclaim of highs invalidates the rejection
It would mean buyers absorbed supply successfully
Historical rejection thesis fails → exit immediately
This is structural invalidation, not random risk placement.
6. Target Logic (4779 Zone)
The target sits at:
Prior consolidation base
High-volume launch area of the impulse
Unfilled demand zone
Historically, Gold:
Retraces to the origin of the last impulsive move
Respects demand zones more than Fibonacci levels
Often corrects 50–70% of impulsive legs before continuing higher
This makes 4779 a historically favored reaction level.
7. Why the Correction Is Expected to Be Clean
Gold corrections tend to:
Start slowly (confusion phase)
Break structure
Accelerate into demand
This path traps:
Late buyers
Early dip buyers
Weak longs holding hope
Which fuels the continuation down into the target.
Summary (Historical Behavior Logic)
✔ Parabolic advance → exhaustion
✔ Rejection at prior highs
✔ Structure break + failed pullback
✔ RSI confirms regime shift
✔ Target at impulse origin
This is a classic Gold correction trade — trading how Gold has behaved historically, not predicting a top

XAGUSD Short — Rounded Top Distribution & Structure Failur????OANDA:XAGUSD
Silver has formed a rounded / arc-style top after a sustained push higher.
Historically, this structure signals distribution, not continuation.
Why this matters in Silver:
Silver often tops slowly and visibly, unlike Gold
Rounded highs show buyers losing urgency
Smart money sells gradually into strength instead of dumping
This is classic late-stage bullish exhaustion.
2. Failure at Key High (Historical Rejection)
Price failed to hold above the 95.0–95.8 zone, which aligns with:
Prior swing highs
Psychological round-number resistance
Previous supply reactions
Historically:
When Silver fails multiple times near a major high,
The next move is usually a deep corrective leg, not a shallow pullback
This is not a breakout failure — it’s trend termination behavior.
3. Entry Logic (93.6 Area)
The entry comes after structure breaks, not at the top.
Historically preferred behavior:
First sharp drop = weak hands exit
Pullback = late buyers attempt “dip buy”
Failure to reclaim prior structure = high-probability short
The entry aligns with:
Lower high formation
Prior support turning resistance
Momentum shift confirmed by RSI
This avoids emotional top-picking.
4. RSI Confirms Distribution
RSI(14) is sitting around 35–44 and trending lower.
Historically in Silver:
RSI failing to hold 50 = bearish regime
Each RSI bounce below 50 = sell opportunity
RSI sliding toward 30 during price pullbacks = trend continuation, not reversal
This supports continuation lower, not consolidation.
5. Stop Loss Logic (95.0+)
Stop above 95.0–95.8 is structurally sound.
Historically:
If Silver reclaims the rounded-top highs,
Distribution thesis is invalid
Sellers are wrong → exit immediately
This is a behavioral invalidation, not arbitrary risk placement.
6. Target Logic (90.2 Zone)
The target aligns with:
Prior demand base
High-volume accumulation zone
Previous impulsive launch area
Historically, Silver:
Retraces deeply after topping
Often returns to the origin of the prior impulse
Does not respect shallow Fibonacci levels as much as raw structure
This makes 90.2 a realistic, behavior-backed target.
7. Why the Projected Path Makes Sense
Silver rarely drops in a straight line.
Historically after topping:
Sharp sell-off
Choppy pullbacks (false hope for buyers)
Final acceleration into demand
This path maximizes trapped longs and fuels continuation.
Summary (Historical Logic)
✔ Rounded top = distribution
✔ Rejection at major highs
✔ Lower high + structure break
✔ RSI confirms bearish regime
✔ Target aligns with prior accumulation
This is a classic Silver mean-reversion + trend-shift short, based on how Silver has behaved for years — not a prediction, but recognition.


Swing trade- USD/CHFHi retail Trader
We have a opportunity today on USDCHF
We can expect dollar to get weaker
Please do yourself own Analysis
Make sure use stop loss ✋🛑
For more updates please Follow me
And hit the booster for me 🚀🚀🚀

It’s Executing a Clean Stair-Step Expansion Toward New ATHOn the Gold H4 timeframe, price action is displaying a highly constructive bullish expansion, not a blow-off move. The market has progressed through a clear three-phase cycle: Phase 1 accumulation after a sharp correction, Phase 2 re-accumulation with higher lows above the EMA, and Phase 3 compression beneath resistance before expansion. Each phase resolved higher, confirming strong demand absorption and trend continuation behavior rather than distribution.
The most important technical feature is the series of unfilled value gaps (GAPs) left behind during impulsive moves. These gaps represent inefficient price discovery and act as strong dynamic support zones. Notice how price respected each GAP perfectly before continuing higher this is classic institutional stair-step markup, where pullbacks are shallow, controlled, and corrective. The EMA continues to slope aggressively upward and remains well below price, reinforcing the strength of the trend and showing no signs of bearish divergence.
The recent breakout above the Phase 3 consolidation zone is critical. Price did not reject or stall instead, it expanded cleanly and accelerated, indicating acceptance above prior value. This behavior significantly increases the probability of continuation rather than mean reversion. As long as Gold holds above the upper GAP region (~4,628–4,650), any pullback should be viewed as trend continuation entry, not reversal risk.
From a projection standpoint, the measured expansion and momentum structure support a move toward the 5,000+ region, aligning with the marked NEW ATH / TARGET zone. Importantly, the projected path anticipates healthy pullbacks, not vertical price which is exactly what strong bull markets do before printing new highs.
Bottom line:
Gold is in a confirmed bullish expansion cycle with clean structure, strong EMA support, and no distribution signals. Unless price aggressively reclaims and closes below the upper GAP zones, the technical bias remains firmly bullish, with new all-time highs as the next logical objective, not an outlier scenario.


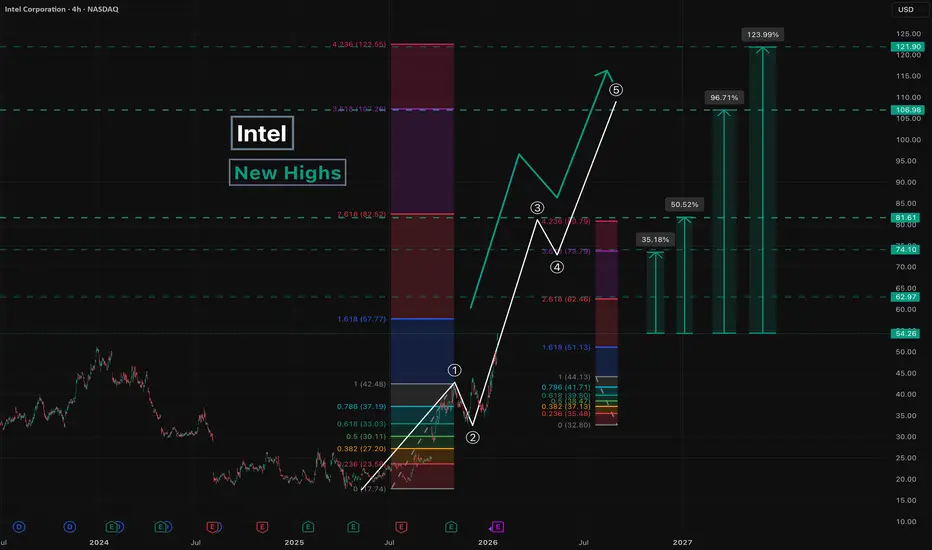
Intel - New Highs
Following up on the previous idea, where the projected targets have been completed.
Let’s revisit the chart.
Since price continued higher without entering a correction, this suggests that wave 3 of the larger move has begun.
Key levels:
62 - local correction within wave 3
74/81 - potential completion zone for wave 3 , followed by a correction
106/121 - potential completion zone for the entire move
Estimated upside potential from current levels:
35-50% for wave 3
96-124% for the entire move
---
Please subscribe and leave a comment!
You’ll get new information faster than anyone else.
---
XAUUSD | Gold Signal |January 22,2026Gold's Long-Term Outlook: Resilience and Potential Risks Amid Uncertainty
Despite a short-term pullback, the long-term outlook for gold remains optimistic. As a safe-haven asset, gold continues to attract inflows amid heightened global economic uncertainty. The 64% gain in 2025 and the over 10% cumulative gain so far in 2026 are driven by multiple factors: inflation expectations, geopolitical conflicts, controversies surrounding Federal Reserve policy, and the potential escalation of the Arctic resource competition. Even though Trump's agreement framework appears stable, the unease among NATO allies and the upcoming EU summit suggest that the Greenland issue is far from resolved. Russia and China's ambitions in the Arctic, along with legal challenges to the Federal Reserve's independence within the US, could reignite safe-haven demand.
Investors should note that concerns about Japanese fiscal policy have made the yen precarious, potentially indirectly supporting the relative strength of the US dollar and gold. Experts suggest that while the gold sell-off may be temporary, the market should be wary of news-driven volatility. In the future, if details of the agreement are revealed or new variables emerge, gold may resume its upward trend. Overall, in a volatile geopolitical environment, gold's safe-haven appeal will continue, but a rational investment strategy based on macroeconomic data is necessary.
In conclusion, while Trump's retraction of his Greenland threat narrowed gold's gains, it failed to reverse its long-term upward trend. This event reminds us that financial markets are highly sensitive to headlines, but gold's inherent resilience stems from the persistent global uncertainty. Investors should remain vigilant when pursuing gold, paying close attention to subsequent diplomatic developments and economic indicators to seize genuine opportunities.
Today, continued attention should be paid to news regarding Trump's actions and geopolitical developments, as well as the performance of data such as the US November PCE and initial jobless claims

Light Crude Oil (CL) Looking for Larger Degree CorrectionThe short-term Elliott Wave outlook for Oil (CL) shows the cycle from the June 23, 2025 peak ended at the December 16, 2025 low of $54.98. After this completion, Oil began correcting the prior cycle in a larger degree, expected to unfold in either three or seven swings. From the December 16 low, wave ((i)) advanced to $58.88. The pullback in wave ((ii)) developed as a zigzag structure. Within this correction, wave (a) ended at $56.65, wave (b) reached $58.87, and wave (c) declined to $55.76. This sequence completed wave ((ii)) in higher degree.
Oil then resumed higher in wave ((iii)), subdividing into five waves. From wave ((ii)), wave (i) ended at $57.17, followed by a pullback in wave (ii) that concluded at $55.86. Wave (iii) advanced to $59.8, while wave (iv) corrected to $58.45. The final leg, wave (v), extended to $62.36, completing wave ((iii)) in higher degree. A corrective phase unfolded in wave ((iv)), again forming a zigzag. From wave ((iii)), wave (a) ended at $59.19, wave (b) advanced to $61.85, and wave (c) declined to $58.7. This completed wave ((iv)) in higher degree.
Oil has since turned higher in wave ((v)). From wave ((iv)), wave (i) ended at $60.68, while the pullback in wave (ii) concluded at $59.22. Near term, as long as the pivot at $55.76 remains intact, Oil is expected to continue higher.

BTCUSD | 30M – Bearish Structure with Relief BounceBITSTAMP:BTCUSD
Bitcoin experienced aggressive sell pressure, breaking previous intraday support and forming a bearish continuation leg. The current bounce is a reaction from a demand zone and should be treated as a pullback or mitigation move, not trend change. Unless price reclaims and holds above key resistance, sellers remain in control and upside is capped.
Key Scenarios
✅ Bullish Relief Case 🔄
Hold above 89,200 – 89,000
Upside reaction toward:
🎯 90,200
🎯 91,300 (supply / target zone)
❌ Bearish Continuation Case 📉
Rejection from 90,200 – 91,300
Continuation toward:
🎯 88,000
🎯 87,500 liquidity zone
Current Levels to Watch
Resistance 🔴: 90,200 – 91,300
Support 🟢: 89,200 – 89,000 | Major: 88,000 – 87,500
⚠️ Disclaimer: This analysis is for educational purposes only. It is not financial advice.

US100 Short From Resistance!
HI,Traders !
#US100 made a retest
Of the horizontal resistance
Of 25725.0 from where we
Are already seeing a local
Bearish reaction so a further
Move down is to be expected !
Comment and subscribe to help us grow !

ETH — Price Slice. Capital Sector. 3158.18 BPC 9© Bolzen | The Architect | BPC Framework
Bolzen Market Institute
🏷 ETH — Price Slice. Capital Sector.
TradingView Publication Date: 22.01.2026
🏷 3158.18 — price not yet reached at time of publication.
🏷 BPC — The Bolzen Price Covenant — Strength Index: 9
Quantum structure of obligations and capital flow in price formation via energy blocks.
🏷 Vertical chart — Energy Grid Dashboard.
🏷 Static Stream 1: price published in energy-block production sequence.
🏷 The price energy block is already ordered—not by time, but by execution priority. Crucially: block priority dynamically reconfigures in response to hidden energetic impulses, whereas price execution order records their market manifestation. Every price in the dynamic stream is tied to proprietary energy-production metrics inaccessible to the general public. Those who perceive structure before its manifestation do not follow price—they anticipate it.
EΞ2Φ8Ψ45Θ·ζ⁻¹·106Λ732·Ω²
📎 Screenshot:
🏷 When trading from levels, use liquidity zones from BPC 10 and above.
🏷 Bolzen Liquidity Map — ETH (numerical equivalent):
🏷 I. Interactive Reference Guide: BPC — The Bolzen Price Covenant
🏷 P.S. English is not my native language — I offer no apologies for stylistic imperfections. What you see here is not a post. It is a demonstration of another level of preparation: the symbiosis of human intuition and algorithmic precision. Mathematics and aggressive market analysis — against the machine of liquidations.
The persistent ETH and BTC Energy Grid Dashboard remains publicly accessible and is intended for international institutional review.
Dear international community,
I extend my gratitude to the TradingView moderation team for their impartiality and support of analytical work at the global level, as well as to all who follow my research. This platform serves as a space to demonstrate contributions to the advancement of market analytics.
Attention and time are your most valuable resources. ATH is emotion; timeframes are your truest allies. Thank you.
— The Architect
BPC — The Bolzen Price Covenant

Jan 22, 2026 - XAUUSD GOLD Analysis and Potential Opportunity📊 Summary:
Market sentiment is shifting rapidly, and today the downside has the upper hand. For now, 4800 is the key line separating bullish and bearish bias.
If price holds above 4800, the strategy focuses on buying pullbacks into support.
If price breaks below 4785, the strategy shifts to selling rallies where resistance holds.
🔍 Key Levels to Watch:
• 4828 – Resistance
• 4815 – Resistance
• 4810 – Resistance
• 4802 – Resistance
• 4785 – Support
• 4766 – Support
• 4755 – Support
• 4747 – Support
📈 Intraday Strategy:
SELL: If price breaks below 4785 → target 4780, with further downside toward 4774, 4770, 4766
BUY: If price holds above 4802 → target 4805, with further upside toward 4810, 4815, 4821

Coeur Mining (CDE) Elliott Wave Outlook - Count 1 Alt1 (4H)This is an alternate outlook which sees that NYSE:CDE is already in the red wave 3 which again is approaching a typical wave 3 target at the 1.618 extension. I prefer the red wave 2 as a running flat on this outlook compared to the expanding leading diagonal count previously used, and with silver approaching $100, this outlook allows for the completion of this 5 wave sequence quicker than the previously posted 4H outlook.
That last comment suggest I have one eye on a reaction at $100 silver (I suppose I can’t rule it out also Gold approaching $5K), and that I’m preparing for a larger pull back. Well once I anchor red wave 5, yellow (5), and cyan 3 or C this does suggest a larger pullback. I am going to review this count based on my higher timeframe outlook on silver, but looking at CDE in isolation, I think this leg potentially completes a 5 wave sequence higher and the potential for pull back still exists. A pull back that I may not want to hold all of my current holding through, so may trim a little more from CDE and other miners based on correlation as this wave progresses.
The situation is of course fluid, and something could happen tomorrow that changes that sentiment.

BITCOIN WAVE COUNTING - DAILY - RETURNING TO 2017 TREND LINE Clear ABC Correction to now a 1-5 impulse with extended 5th wave, returning to the 2017 Trend line.

Wave counting for Bitcoin - 5th wave to 100K We see completion for 4th wave with consolidation and testing. Now in process to complete 5th wave of similar direction.

Wave Counting for potential upcoming EURO/USD move downward.We see 4th wave pending completion, if we break above major lines with consolidation we may see moves up, however with direction lines matching for 1st and 5th wave projection, with 1 over 2 Fibonacci retracement landing on major trend lines. I post this idea with confidence.

ROUGH WAVE ANALYSIS IDEA FOR UPCOMING GOLD MOVEWe see upcoming completion of impulse wave with fib timing. Considering Elliot rules, we should see a reaction after action.
