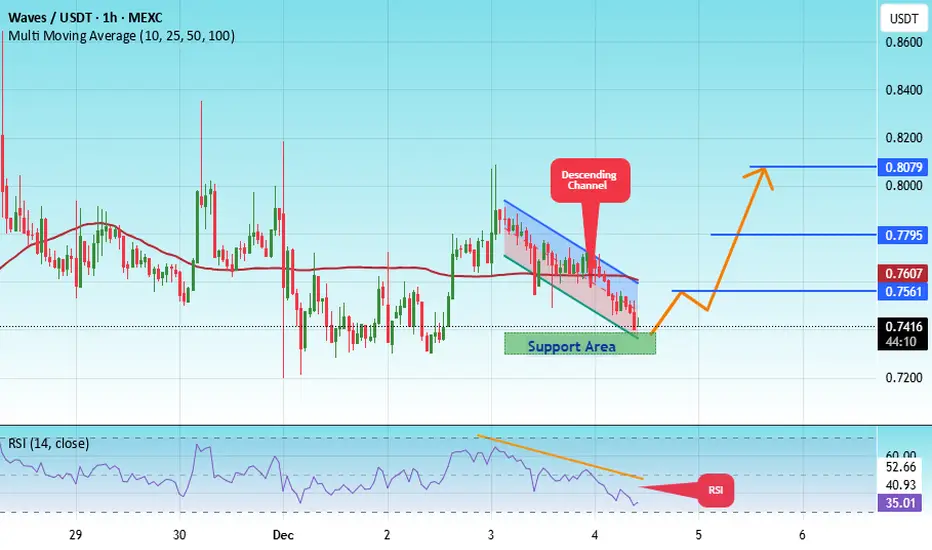
#WAVES/USDT is currently strongly bullish#WAVES
The price is moving in a descending channel on the 1-hour timeframe. It has reached the lower boundary and is heading towards breaking above it, with a retest of the upper boundary expected.
We have a downtrend on the RSI indicator, which has reached near the lower boundary, and an upward rebound is expected.
There is a key support zone in green at 0.7335. The price has bounced from this level multiple times and is expected to bounce again.
We have a trend towards consolidation above the 100-period moving average, as we are moving close to it, which supports the upward movement.
Entry price: 0.7416
First target: 0.7560
Second target: 0.7795
Third target: 0.8080
Don't forget a simple principle: money management.
Place your stop-loss order below the support zone in green.
For any questions, please leave a comment.
Thank you.
Waves
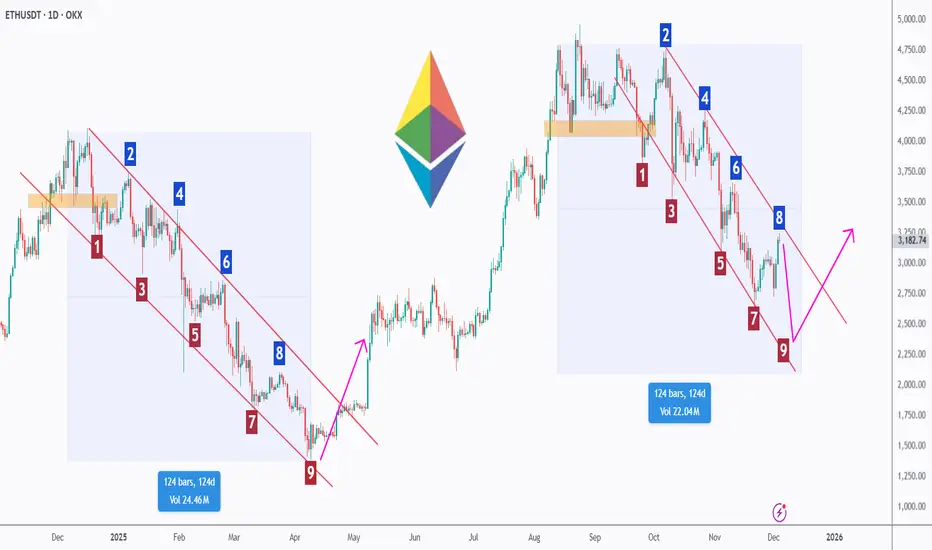
ETH - Same Pattern. Same Timeline. Same Outcome?Ethereum is showing something extremely interesting… and extremely familiar.
When we compare the previous corrective cycle to the current one, both have unfolded almost identically, not just in structure, but also in duration, each measuring around 124 days.
🌊Both cycles followed a clean 1-to-9 wave sequence inside a falling channel before ETH broke out aggressively. And right now, ETH is completing the same exact structure, approaching wave 9 once again.
🔄If history rhymes, and it often does in crypto, ETH may be preparing for a major impulsive phase, similar to what happened after the previous 124-day correction.
From the lower bound of the channel, we will be looking for trend-following longs, anticipating a potential bullish reversal that mirrors the last breakout.
Cycles don’t repeat perfectly…
But they rhyme more often than people think. 📈✨
⚠️ For now, the trend remains bearish, however, ETH would invalidate the entire bearish structure if the upper trendline breaks upward aggressively, signaling that bulls have fully taken over.
Do you believe ETH is about to repeat its previous breakout? Share your view below! 👇🔥
⚠️ Disclaimer: This is not financial advice. Always do your own research and manage risk properly.
📚 Stick to your trading plan regarding entries, risk, and management.
Good luck! 🍀
All Strategies Are Good; If Managed Properly!
~Richard Nasr
$BTCUSD - #Bitcoin cycle analysisHi guys! 👋🏻
🔔I'd like to share with you my current Bitcoin BTCUSD analysis here.
🔔 The last correction is taking an impulse 5-wave structure, it seeems like we are about to complete the 5th wave of the Intermediate A, bounce back to $102K to complete the B and drop back to the levels near $70K - 64K to complete the correction.
🔔 I know it sounds disappointing but we need a correction to regain power. Now, before throwing tomatoes, please see cycle charts below. And never underestimate the power and rules of cycles in the market.
🔔 Why channels always matter
🔔Wave paths
🔔Fibo
🔔 Path to $150K shall look like this
🔔Concetration of Supports and Resistances
Sharing for educational purposes!
✊🏻 Good luck with your trades! ✊🏻
If you like the idea hit the 👍🏻 button, follow me for more ideas.

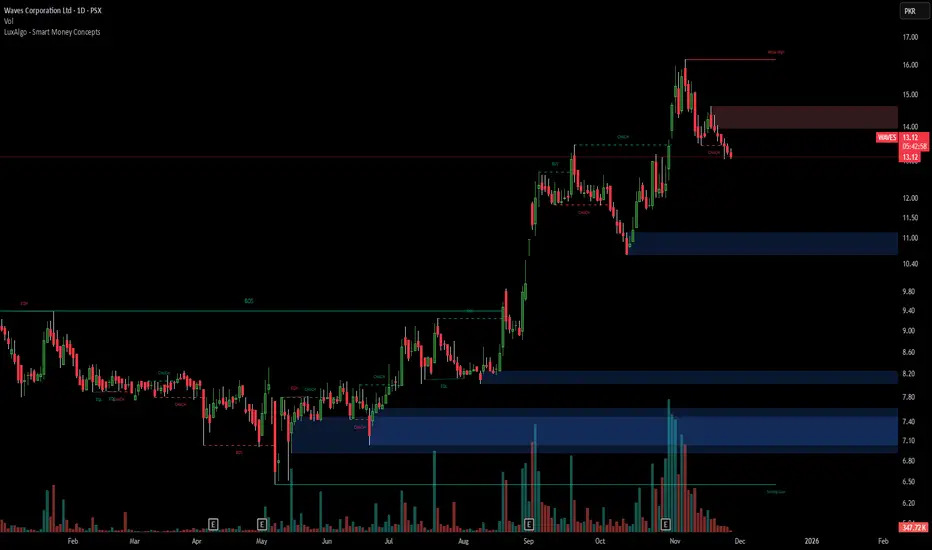
Technical Analysis - Waves Corporation (PSX)Current Price Action
Current Price: PKR 13.13 (down 0.91%)
The stock is trading near concerning technical levels after a significant decline from recent highs.
Key Technical Observations
Trend Structure
The stock experienced a strong uptrend from August through early November, rallying from around PKR 10.50 to a peak near PKR 16.00 (approximately 50% gain). However, the recent price action shows a sharp rejection from the resistance zone and a breakdown in trend.
Critical Support & Resistance Zones
Resistance Zone (Red): PKR 14.00-14.40
This area previously acted as consolidation support but has now flipped to resistance. The stock is struggling below this level, which is a bearish signal.
Current Support Zone (Blue): PKR 11.00-11.40
This represents the former breakout level from October. If this zone fails, the stock could see accelerated selling pressure.
Major Support Zone (Blue): PKR 8.00-8.20
A critical demand zone that provided strong support during the summer consolidation period.
Volume Analysis
Notice the volume spikes marked with "E" (likely earnings releases):
High volume accompanies both rallies and declines
Recent selling volume appears elevated, suggesting distribution
The latest decline shows sustained selling pressure
Technical Pattern
The chart displays a classic "parabolic rise and rejection" pattern. The sharp spike to PKR 16.00 followed by immediate reversal is concerning and often indicates exhaustion of buying momentum.
Trading Outlook
Bearish Scenario (Higher Probability):
Break below PKR 13.00 could trigger a move toward the PKR 11.00-11.40 support zone
Failure of that level opens the door to PKR 8.00-8.20
Bullish Scenario (Requires Confirmation):
A reclaim above PKR 14.00 with strong volume would invalidate the bearish structure
Would need to see consolidation and base-building rather than immediate recovery attempts
Risk/Reward Assessment
Current positioning suggests unfavorable risk/reward for long entries. The stock needs to establish a new base before attempting sustainable upside moves.
Strategy Considerations:
For traders: Wait for clear support hold at PKR 11.00-11.40 or reclaim of PKR 14.00
Momentum has shifted bearish in the short term
Any bounce attempts into the PKR 14.00 resistance zone could provide shorting opportunities
The technical picture suggests caution here, with downside risks outweighing immediate upside potential until the stock can stabilize and form a new accumulation pattern.
MGNT Short 5M Conservative CounterTrend DaytradeConservative CounterTrend trade
+ short impulse
+ resisting bar test level
+ 1/2 correction
+ weak approach
+ biggest volume 2Ut-
- manipulation signal configuration needs a test
Calculated affordable virtual stop
1 to 2 R/R take profit
1H Countertrend
"- long impulse
+ volumed TE / T1
+ weak approach
+ biggest volume 2Ut-"
1D Trend
"+ short impulse
+ BUI level
+ 1/2 correction
+ resistance level
- volumed retest"
1M
Trend
"+ short impulse
= neutral zone type 2
+ continuation of the trend"
1Y CounterTrend
"- long impulse
- T2 level
- support zone
- 1/2 correction
- biggest volume Sp?
+ model doesn't work"

The market seems to have completed the A wave of the ABC correctI mainly focus on Elliott Wave analysis. The chart has already completed a 5-wave impulse to the upside, and we are now in the ABC corrective phase. It looks like wave A has finished, and the market seems to be entering wave B at the moment.
I'm not sure how high wave B will extend, but I expect it to retrace to 0.382, 0.5, 0.618, or possibly 0.786 before dropping in a 1:1 measured move.

Hellena | EUR/USD (4H): LONG to the resistanse area 1.16296.Colleagues, the rather complicated correction suggests that the upward movement is gradually slowing down and I think that we will see a rather confident move towards the 1.16296 area.
The difficulty is that on higher timeframes we are dealing with a ending diagonal, and these are quite complicated figures to analyze.
Nevertheless, I think that there is a probability of reaching the support area of 1.14647 before the upward movement.
Fundamental context
The U.S. dollar is under pressure: weak economic data and expectations of monetary easing are reducing its appeal as a safe-haven asset. The euro is receiving moderate support amid relative stability in the eurozone economy and investor interest in non-dollar assets. These conditions set the stage for a resumption of the EUR/USD pair’s upward move.
Manage your capital correctly and competently! Only enter trades based on reliable patterns!

Swing-trading ReturnsYou got to look long-term or use an outside view.
-using qullamaggie's 10/20/50 (upsloping) concept
and that
-you cant run away from 200dma.
Your best returns will be on periods with perfect setups.
Where you most likely want to know the best stocks to own?
//ie during upswingy or in-pattern VIX, small caps underperform etc.
simple but not easy.
ie the edge.
market forces.

Hellena | SPX500 (4H): LONG to max of wave "3" area of 6929.4.Good afternoon colleagues, it looks like the correction is ending and soon I expect wave “5” in the upward movement. Perhaps wave “4” will update the low of 6637.8 before the upward movement.
I expect to reach the maximum of wave “3” at 6929.4. Further we will observe the price behavior in this area.
Fundamental Background
The US stock market remains positive: business activity data showed a steady expansion, which strengthens confidence in corporate earnings.
Manage your capital correctly and competently! Only enter trades based on reliable patterns!

DTM Investment 1D Conservative CounterTrend TradeConservative CounterTrend Trade
+ short impulse
- unvolumed T2 level
+ resistance level
+ 1/2 correction
+ weak approach?
+ biggest volume 2Ut-
- interaction bar bigger volume
Calculated affordable virtual stop loss
1 to 2 R/R take profit
Bough put
Monthly CounterTrend
"- long impulse
- unvolumed T1
+ resistance level
+ biggest volume 2Ut-
+ more volume on reaction bar"
Yearly CounterTrend
"- long impulse
- neutral zone 2
- continuation if the trend
+ exhaustion volume?"

IREN 5M Short Conservative Trend DayTradeConservative Trend Trade
+ short impulse
+ unvolumed T2
+ resistance zone
- before 1/2 correction
+ strong approach
+ volumed 2Ut+
+ weak test
+ first bullish bar close entry
Calculated affordable virtual stop loss
1 to 2 R/R take profit within 5M range
Bought put
1D Trend
"- short balance
+ volumed T2
+ resistance zone
+ 1/2 correction
- strong approach
+ biggest volume 2Ut-"
1M CounterTrend
"- long impulse
+ volumed T1
+ resistance zone
+ weak approach
+ biggest volume Ut
+ test"
1Y CounterTrend
"- long impulse
= neutral zone
+ exhaustion volume?"

NRG 1H Swing Short Conservative CounterTrend TradeConservative CounterTrend Trade
+ short impulse
+ resisting bar level
+ 1/2 correction
+ resistance zone
+ volume Ut?
Bought put
Calculated affordable virtual stop
1 to 2 R/R take profit before 1/2 1D
Daily CounterTrend
"- long impulse
+ volumed T1
+ resistance zone
- strong approach
+ volumed 2Ut+"
Monthly CounterTrend
"- long impulse
- unvolumed T1
+ resistance zone
+ volumed manipulation bar
- volumed reaction bar looks for break
- volume distribution is long"
Yearly CounterTrend
"- long impulse
= neutral zone"

DIA 1H Swing Short Conservative CounterTrend TradeConservative CounterTrend Trade
+ short impulse
- resisting bar level below BUI
+ resistance zone
+ 1/2 correction
+ volumed 2Ut-
Bought a put
1 to 2 R/R take profit
1D CounterTrend
"- short balance
+ biggest volume expanding CREEK
+ volumed 2Ut+
+ weak test"
1M CounterTrend
"- long impulse
- neutral zone
+ exhaustion volume?"
1Y CounterTrend
"- long impulse
+ beyond rotation point
- neutral zone"

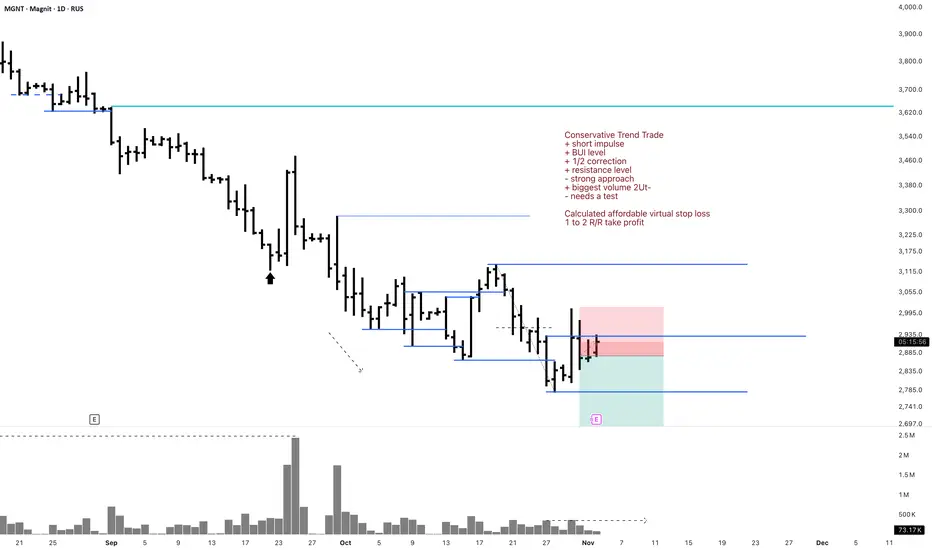
MGNT Conservative Trend TradeConservative Trend Trade
+ short impulse
+ BUI level
+ 1/2 correction
+ resistance level
- strong approach
+ biggest volume 2Ut-
- needs a test
Calculated affordable virtual stop loss
1 to 2 R/R take profit
Daily Trend
"+ short impulse
+ BUI level
+ 1/2 correction
+ resistance level
- strong approach
+ biggest volume 2Ut-
- needs a test"
Monthly Trend
"+ short impulse
= neutral zone type 2
+ continuation of the trend"
Yearly CounterTrend
"- long impulse
- T2 level
- support zone
- 1/2 correction
- biggest volume Sp?
+ long setup
+ model doesn't work"
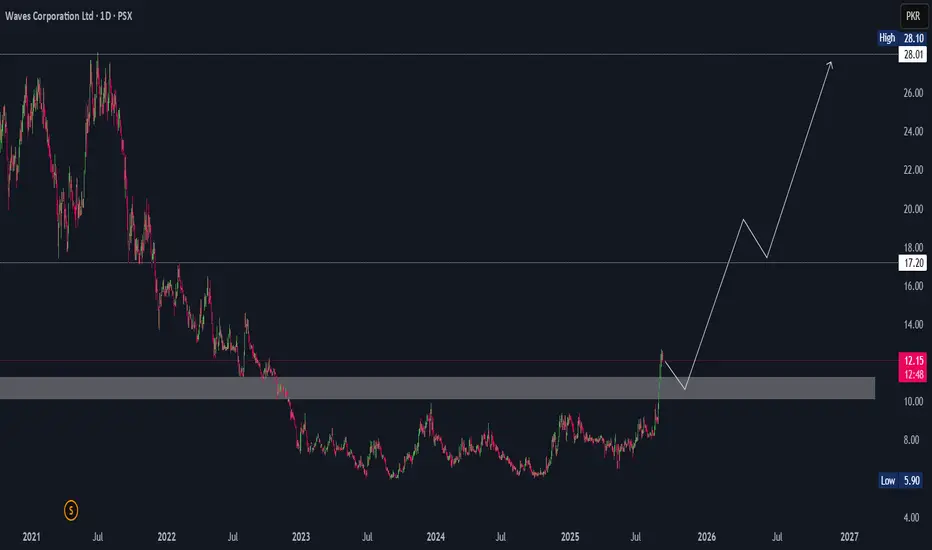
Waves Breakout and Buy Idea !Waves Corporation Ltd (PSX: WAVES) – Long term Technical Setup
Waves has finally broken out of a multi-year accumulation zone after trading sideways since late 2022. The stock has cleared the major supply area around 10–11 PKR, turning that region into a fresh support base.
From here, I expect a healthy pullback into that zone (shakeout/retest) before the next leg higher. The first major resistance sits around 17.20, and a sustained breakout above that level could open the way towards the 28–30 PKR zone over the longer term.
Volume has been picking up, which suggests real money is starting to rotate in. As long as price holds above 10, the structure remains bullish.
This chart is setting up for a classic accumulation → breakout → retest → markup phase. Longer term investors may want to watch closely how it behaves on the retest before positioning for the bigger move.
OKE 1D Investment Short Conservative Trend TradeConservative Trend Trade
+ short impulse
+ T2 level
+ resistance zone
+ biggest volume Ut
+ weak test?
Bought a put
1 to 2 R/R ratio
1M Trend Trade
"+ short impulse
- neutral zone"
1Y CounterTrend Trade
"- long balance
+ biggest volume resistance level
+ volumed reaction bar"

INTC Swing Long Conservative Trend Trade Conservative Trend Trade
+ long impulse
+ expanding T2 level
+ support level
+ unvolumed 2Sp
+ volumed test
+ below first bullish bar closed level entry
Calculated affordable virtual stop loss
1 to 2 R/R take profit
Daily Context
"+ long impulse
+ SOS level
+ support level
+ unvolumed Sp"
Monthly Context
"+ long impulse
+ SOS level
+ support level
+ 1/2 correction"
Give me a way better price at afterhours.
I just need my 2 R and I'm out!

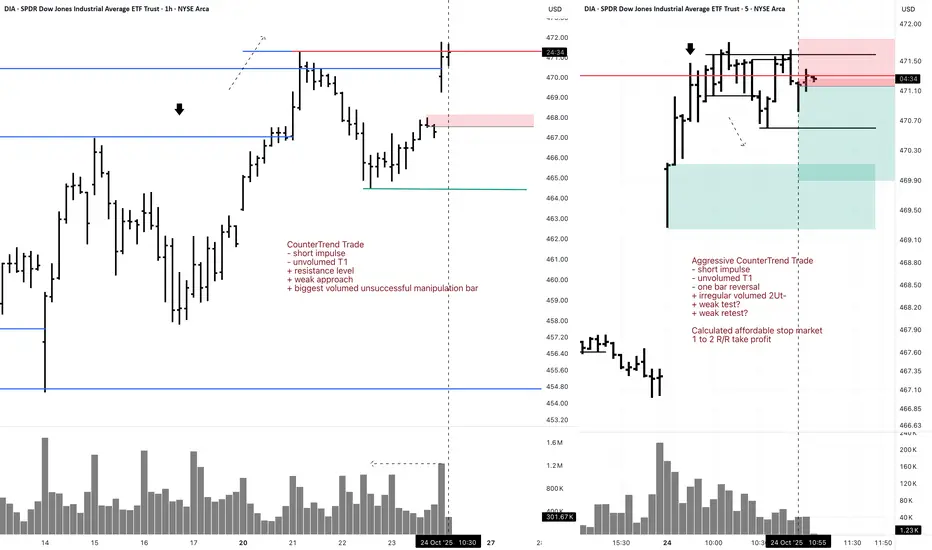
DIA 5M Short Aggressive CounterTrend DayTradeAggressive CounterTrend Trade
- short impulse
- unvolumed T1
- one bar reversal
+ irregular volumed 2Ut-
+ weak test?
+ weak retest?
Calculated affordable stop market
1 to 2 R/R take profit
1H CounterTrend
"- short impulse
- unvolumed T1
+ resistance level
+ weak approach
+ biggest volumed unsuccessful manipulation bar"
1D CounterTrend
"- short balance
+ expanding CREEK
+ weak approach"
1M countertrend
"- long impulse
- neutral zone
+ exhaustion volume?"
1Y CounterTrend
"- long impulse
+ beyond rotation point
- neutral zone"
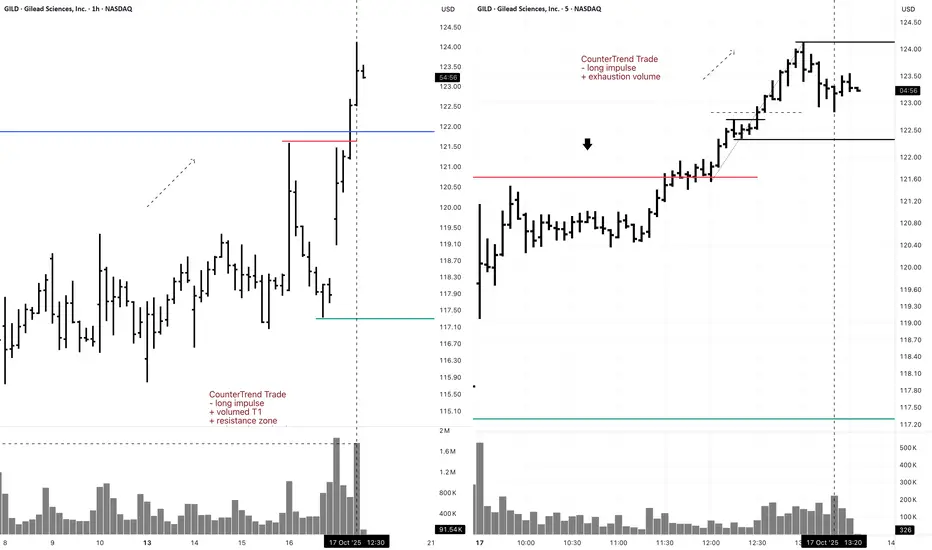
GILD 5M Short CounterTrend Daytrade (Buy Put to Open)5M CounterTrend Trade
- long impulse
+ exhaustion volume
1H CounterTrend
"- long impulse
+ volumed T1
+ resistance zone
+ volumed reaction bar"
1D CounterTrend
"- long impulse
- unvolumed T1
+ resistance level
+ volumed manipulation bar "
1M CounterTrend
"- long impulse
+ volumed T1 level
+ resistance zone"
1Y CounterTrend
"- long impulse
- unvolumed T1
+ resistance zone"
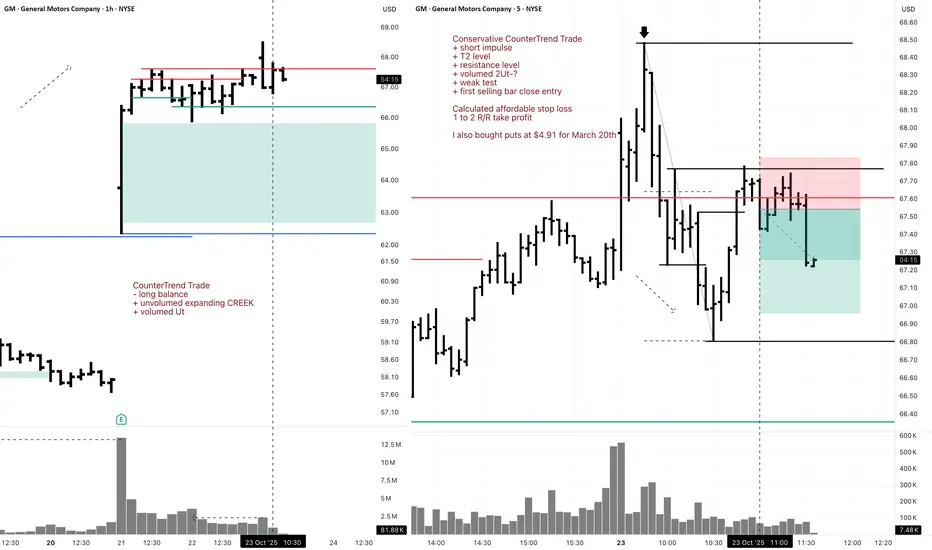
GM Short 5M DayTrade Conservative CounterTrend TradeConservative CounterTrend Trade
+ short impulse
+ T2 level
+ resistance level
+ volumed 2Ut-?
+ weak test
+ first selling bar close entry
Calculated affordable stop loss
1 to 2 R/R take profit
I also bought puts at $4.91 for March 20th
1H CounterTrade
"- long balance
+ unvolumed expanding CREEK
+ volumed Ut"
1D CounterTrend
"- long impulse
- neutral zone
+ exhaustion volume?"
1M CounterTrade
"- long impulse
- unvolumed T1
+ resistance zone
+ volumed manipulation bar
- volumed reaction bar looks for break
- volume distribution is long"
1Y CounterTrend
"- long balance
+ expanding volumed CREEK
+ resistance level"
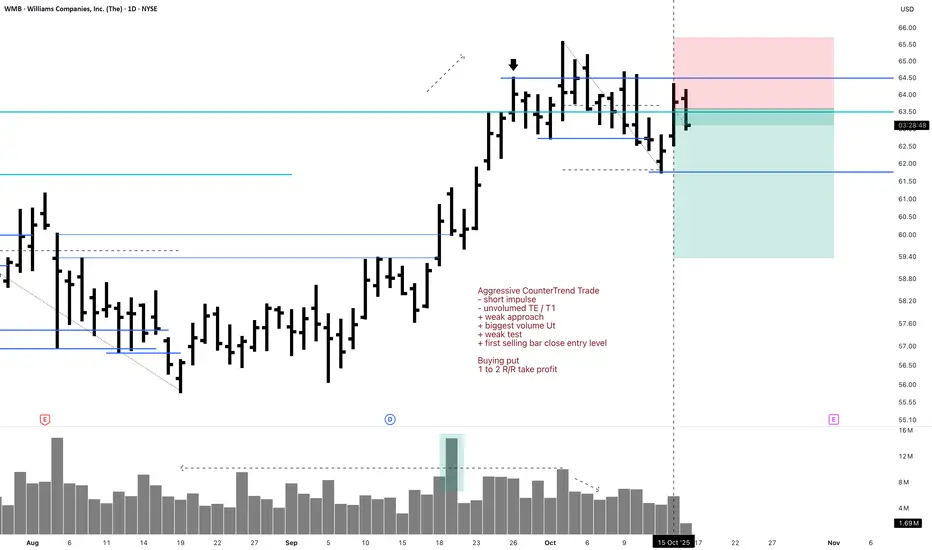
WMB 1D Short Aggressive CounterTrend Trade (Put Buy to Open)Aggressive CounterTrend Trade
- short impulse
- unvolumed TE / T1
+ weak approach
+ biggest volume Ut
+ weak test
+ first selling bar close entry level
Buying put
1 to 2 R/R take profit
Monthly CounterTrend
"- short balance
+ volumed expanding CREEK
+ resistance level
= wrong volume distribution weak approach"
Yearly CounterTrend
"- short balance
+ volumed expanding CREEK
+ resistance level
= wrong volume distribution weak approach"
Ford 1D Investment Aggressive CounterTrend TradAggressive CounterTrend Trade
- short impulse
+ exhaustion volume
+ 1/2 correction
Calculated affordable stop limit
Take profit:
1/3 to 1/2 Month Trend
1/3 to Month T2
1/3 to Year 1/2
Sell F Limit at $14.95 (Good 'til Canceled)
Sell F Limit at $11.57 (Good 'til Canceled)
Sell F Limit at $10.21 (Good 'til Canceled)
Monthly CounterTrend
"- short impulse
+ 1/2 correction
- unvolumed T1
+ support level
+ reverse volume approach
+ volumed manipulation"
Yearly Trend
"+ long impulse
+ volumed T2 level
+ volumed 2Sp+
+ weak test"

F 5M Daytrade Long Aggressive Trend TradeAggressive Trend Trade
- short impulse
+ volumed TE / T1 level
+ support level
+ long volume distribution approach
+ biggest volume 2Sp+
- no test
Calculated affordable stop limit
1 to 2 R/R take profit before 5M T2
Hour Trend
"- long impulse
- volumed T2
+ support level
+ 1/2 correction
+ biggest volume manipulation"
Day Trend
"+ long impulse
+ 1/2 correction
- neutral zone
- context direction short"
Month CounterTrend
"- short impulse
+ 1/2 correction
- unvolumed T1
+ support level
+ long volume distribution
+ biggest volume manipulation"
Year Trend
"+ long impulse
+ volumed T2 level
+ volumed 2Sp+
+ 1/2 correction
+ weak test"
