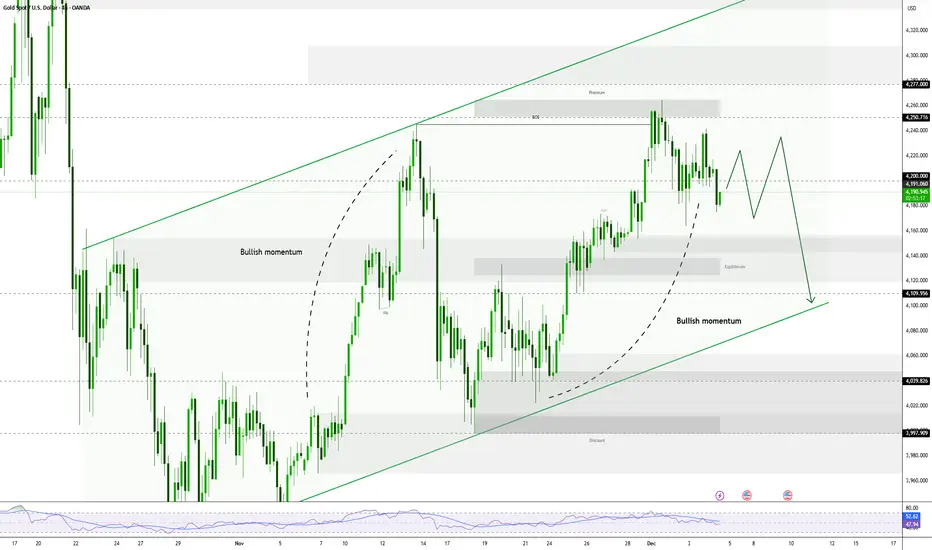
Gold’s Sharp Sell-Off Is a Reset, Not the Start of a Bear TrendHello everyone,
Price OANDA:XAUUSD has now reacted strongly from the 4.30x–4.32x demand zone, which aligns with a previous base and marks the end of the impulsive leg down. The current bounce should be viewed as a technical reaction, not a trend reversal. Structurally, this fits well with the early stages of an ABC corrective structure.
4.38x–4.40x: first resistance zone, previously broken support and near EMA34. This is a high-probability reaction area for sellers (wave A).
4.34x–4.35x: potential pullback zone (wave B) if price fails to reclaim structure.
4.46x–4.48x: corrective upside extension (wave C) if momentum sustains, but still within a corrective context.
Price continues to rebound to retest the 4.40x – 4.41x zone (short-term resistance / Wave A).
- A corrective phase B may occur here before:
- If buying pressure is strong enough → price continues wave C, heading towards a higher zone (4.48x – 4.50x).
- If the price fails to break through zone A and is strongly rejected, the market will return to a sideways consolidation phase within the Liquidity range, needing more time to absorb supply.
Only a clean reclaim above EMA89 and acceptance back above the broken channel would signal that buyers have regained control and reopen the path toward the 4.55x–4.60x region. Until that happens, any upside movement on H1 should be treated as corrective rebalancing after a completed trend, not a fresh impulsive advance.
Wishing you all effective and disciplined trading.
Wavetheory

Hellena | GOLD (4H): SHORT to support area of 4360 (Correction).Colleagues, the price has shown fairly steady growth, reaching a new historic high, and I believe that a correction is not far off.
So, at the moment, wave “1” of the higher order is coming to an end, and I expect this to happen around the 4545 level, followed by the start of corrective movement “2” towards the 4360 level — this is the minimum target. Of course, I expect a deeper correction, but I prefer to take more likely targets.
I would also like to point out that the price may already begin its correction, which would mean that wave “1” is already complete.
Manage your capital correctly and competently! Only enter trades based on reliable patterns!

Hellena | Oil (4H): SHORT to support area of 55.74 (Wave 5).Colleagues, wave “4” of the minor order is ending or has already ended. As part of a major downward movement in wave ‘5’ of the major movement, I expect a downward movement in wave “5” of the minor order.
This wave should update the low of wave “3”, but I believe it is worth looking at the nearest target in the support area of 55.746.
I also allow for the possibility of reaching the 59.00 area before the price begins a downward movement.
Manage your capital correctly and competently! Only enter trades based on reliable patterns!

Hellena | SPX500 (4H): LONG to resistance area of 7010.Colleagues, I expect the upward movement in the medium-term wave “1” to continue.
The minor wave “3” should still be developing, and I expect a repeat update of the high of the higher-order wave “3” (6929.4).
I consider the 7010 area to be the nearest target. If we calculate using Fibonacci expansion, the target is higher, but I always play it safe and take the nearest targets.
Manage your capital correctly and competently! Only enter trades based on reliable patterns!

ETH Just Printed a “Fake Breakout” Into ResistanceETH/USD (4H)
Ethereum is currently behaving like a textbook range market: aggressive wicks into supply, quick pullbacks, and price rotating around moving averages. The chart shows a strong resistance band overhead and a well-defined demand zone below, meaning the next high-probability trades come from reaction points, not prediction.
1) Technical Structure: Sideways Range With a Supply Rejection
ETH is trading inside a broad consolidation after the prior drop, and the latest push into the upper band has been rejected (large wick / immediate retrace). That is classic “liquidity grab into resistance”: buyers chase the breakout, sellers absorb, then price mean-reverts back into the range.
Key read:
When price repeatedly fails to hold above resistance, the market is telling you upside needs a clean acceptance close, not just a spike.
2) Levels That Matter
Resistance (Sell-side pressure)
3,050–3,080: Primary supply zone (where rejection is occurring).
3,100–3,110: Upper cap / “hard ceiling” (major range high on the chart).
Support (Buy-side defense)
2,900–2,880: Primary support zone (first area buyers must defend).
2,800–2,760: Lower demand (if 2,880 breaks, this becomes the next magnet).
Practical implication:
Inside 3,050–3,110, risk is skewed toward pullback unless bulls can close and hold above the band.
Inside 2,900–2,880, risk is skewed toward bounce unless price breaks and accepts below it.
3) Scenarios (High-Probability Map)
Scenario A — Rejection Continues (preferred while below 3,050–3,080)
If ETH remains capped under the supply band:
Expect a rotation lower into 2,900–2,880.
A weak bounce there can still be sold again back into ~3,000–3,050.
A clean breakdown below 2,880 opens the door to 2,800–2,760 (range expansion).
Scenario B — Bull Breakout (only if acceptance happens)
If ETH breaks and holds above the supply:
Confirmation is a 4H close above 3,080–3,110 and then holding on retest.
That flips the band into support and typically triggers momentum buying (short-cover + breakout buyers).
4) Macro Drivers: Why ETH Is Choppy Right Now
ETH is not trading in isolation. This range behavior matches the current macro mix: rate expectations, yields, and the dollar are still the dominant volatility levers for risk assets.
Dollar and yields are the immediate headwind/tailwind
The U.S. dollar index (DXY) has been soft overall, reported around 98.44, down roughly 0.6% on the week and about 1.1% lower in December at that time. A softer dollar typically supports risk assets on the margin, including crypto.
Reuters
Meanwhile, U.S. 10-year yields were referenced near 4.178% in mid-December. When yields drift lower, financial conditions ease and risk appetite improves; when yields spike, ETH tends to retrace.
Reuters
Year-end liquidity amplifies fake moves
Late December markets often see thinner liquidity and sharper stop-runs. That increases the probability of wicky breakouts that fail—exactly what this ETH chart is signaling at resistance.
5) What Traders Should Watch Next
Bearish trigger:
Failure to reclaim 3,050–3,080 + breakdown back toward < 2,980–2,960 (momentum rolls over).
Bullish trigger:
4H close above 3,080–3,110 + successful retest (acceptance, not a wick).
Risk note:
In range markets, the edge comes from trading edges of the box (support/resistance), not the middle.

Bias Remains Bullish, But Bearish Potential RemainsAlthough Gold recorded a daily correction (into negative territory), the long-term market structure remains constructive. The uptrend remains dominant as long as the price maintains its position above critical support levels.
✅ Key Upward Resistance Levels
If buyers successfully take control after this consolidation phase, the targets are:
- $4,550: All-Time High. This is the nearest psychological and technical hurdle.
- $4,600: A major psychological figure that will become a new long-term target if a record breakout occurs convincingly.
✅ Key Downward Support Levels
If selling pressure continues during this "digestion period," the following levels should be watched:
- $4,430: Initial support (December 23rd low).
- $4,338: Next downside target (December 22nd low).
- $4,300: A psychological round number and the December 17th low.
Conclusion: Technically, Gold is in a healthy correction phase from overbought conditions.
As long as the price doesn't fall below $4,300, the prospect of a rally towards a new record of $4,600 remains wide open, especially if supported by uncertainty regarding the Fed's independence and slow progress in the Ukraine peace process.

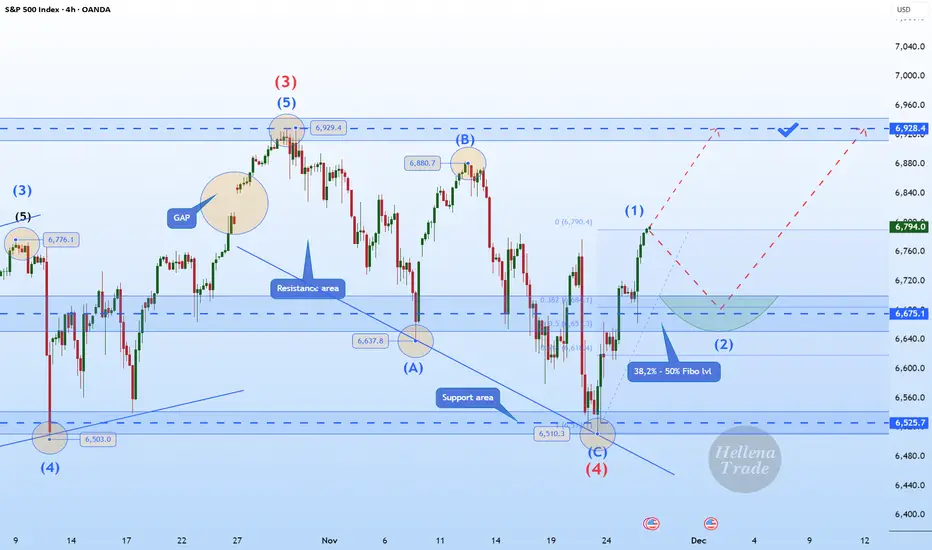
Hellena | SPX500 (4H): LONG to the area of 6956.Hello, colleagues!
I previously published a forecast for an upward movement, and I believe it is time to update the plan slightly. The direction of movement remains the same, but wave “1” has lengthened, which means that the correction in wave “2” may occur slightly higher than previously.
I expect a corrective movement to the support area of 6764, followed by a continuation of the upward movement and an update of the peak level of wave “3” of the higher order 6929 and reaching the area of 6956 at a minimum.
An extension of wave “1” is also possible, but then it will be necessary to slightly revise the wave markings again.
Manage your capital correctly and competently! Only enter trades based on reliable patterns!
Hellena | EUR/USD (4H): LONG to resistance area of 1.18000.Colleagues, the price is successfully moving in an upward impulse “12345” in a medium-term wave “3”.
I believe that this week we will see a continuation of the upward movement.
A slight correction to the support area of 1.17049 is possible to complete wave “4”, followed by an update of the local maximum of the lower-order wave “3” and reaching the resistance area of 1.18000.
Manage your capital correctly and competently! Only enter trades based on reliable patterns!

Hellena | Oil (4H): LONG to 50% Fibo lvl (58.00).The structure has broken down. Wave “2” of the middle order should not have updated the minimum of 56,420 of wave “B” of the higher order, but this has happened.
This means that the wave structure will have to be revised.
It seems that the major correction is not yet complete, and in order for the scenario to be completed, impulse “12345” must be completed.
At the moment, I think that the price will begin to form wave “4”.
I expect movement towards the 50% Fibonacci level from wave “3” at 58.00.
The target is not far off, but at the moment we need confirmation of the impulse.
This would mean that the price will update the local minimum, but more on that later.
Manage your capital correctly and competently! Only enter trades based on reliable patterns!

Gold (4H) — Supply is holding… for nowContext
On the left of the chart, Gold reached the higher-timeframe C target .
That was a valid place for sellers to take control — and they didn’t.
Price absorbed selling pressure and kept moving.
Now we’re at a different level.
The red zone is the all-time-high supply.
Sellers are active here. Price is being held.
That part matters and shouldn’t be ignored.
What formed under supply
Instead of a dump, price built structure:
A clear base
Liquidity sweep
MSS
A fresh ABC sequence
B held.
B broke A.
That tells me buyers are still participating, even with supply overhead.
Expectation
I’m not expecting an immediate breakout.
What makes sense here is a pullback first.
A revisit into the continuation breaker , clearing inducement and resetting positioning.
If that zone holds and price flips back up, then a break of supply opens the path toward C .
If the structure fails, I step aside.
No forcing it.
Watching how price behaves — not guessing the outcome.
SmellyTaz — decoding chaos.
Not financial advice. Shared for educational purposes only.

XAUUSD | Opportunity To Continue Buying If Correction RecursGold's strong overnight move has confirmed a new bullish breakout above its two-week trading range.
With the daily oscillator in positive territory and far from overbought, the path of least resistance for Gold prices remains to the upside.
✅ Bullish Scenario
Upside Confirmation: A bullish breakout above the $4,245-$4,250 barrier has been confirmed.
Upside Target: The $4,300 round figure now acts as an immediate hurdle. Above it, Gold could:
- ⚡Rise to the next relevant hurdle in the $4,328-$4,330 region.
- ⚡Extend further to challenge the all-time high around the $4,380 zone (October peak).
- ⚡Major Upside Trigger: Continued buying beyond the $4,400 round figure will be seen as a new trigger and set the stage for a larger uptrend extension.
✅ Corrective Downward Scenario (Buying Opportunity)
Buy-the-Dip Opportunity: Any price pullback should be viewed as a buying opportunity.
Initial Key Support: Losses are expected to be limited near the resistance breakout, now support, at $4,245 – $4,250.
Next Support: If $4,250 is breached, losses will be limited near the $4,220 – $4,218 region, followed by the $4,200 mark.
Bias Reversal: A convincing break below the $4,170 – $4,165 support area may shift the bias in favor of bearish traders and pave the way for deeper losses.

Hellena | GOLD (4H): LONG to resistance area of 4298.I suggest to consider the lower timeframe (1H), which has some peculiarities.
I see here an upward impulse in the red wave “3”, which is not over yet.
I believe that we should expect the price in the resistance area of 4298.33.
A small correction in the form of continuation of wave "4" to the area of 4174.78 is also possible. But in general, I am set for long positions.
Manage your capital correctly and competently! Only enter trades based on reliable patterns!

Hellena | EUR/USD (4H): LONG to resistance area of 1.17561.Colleagues, I assume that wave “C” ended at 1.14668 and at the moment we see an upward movement in the mid-order impulse “12345”.
I think that the wave “1” of lower order will either extend to the area of 1.17561, or we will see a correction to the area of 50% Fibonacci level 1.15967, and then the movement in the wave “3” to the area of 1.17561.
Manage your capital correctly and competently! Only enter trades based on reliable patterns!

Hellena | Oil (4H): LONG to the area of the maximum of wave “1”.Colleagues, I believe it is necessary to update the forecast slightly. Overall, it remains unchanged, with an upward movement expected.
At the moment, I believe that the higher-order wave “B” has formed, and now in wave ‘C’ I see a five-wave movement “12345”.
I expect wave “3” to begin its movement soon, and I consider the first target to be the maximum area of wave “1” at 60.576.
Manage your capital correctly and competently! Only enter trades based on reliable patterns!

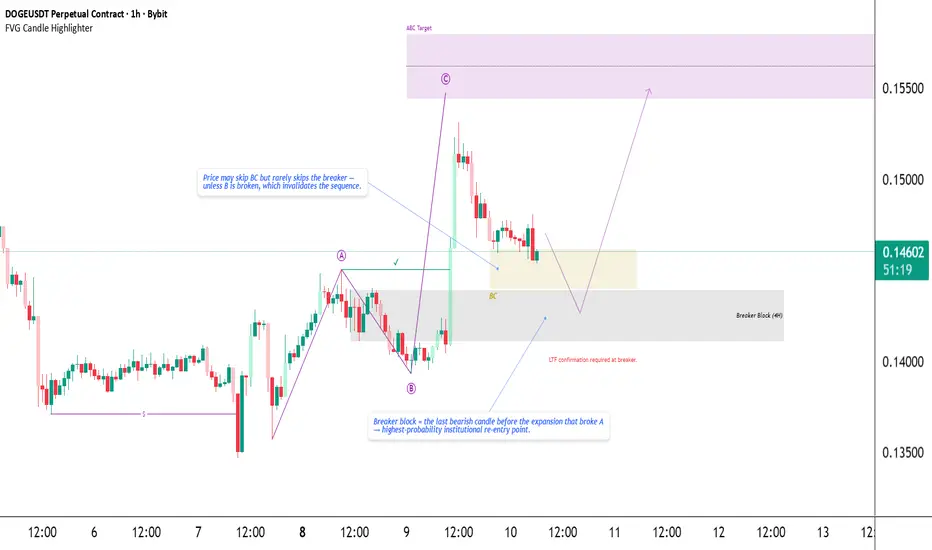
DOGE — SK Structure Breaker Block Re-Entry Toward C-TargetDOGE has completed a clean SK bullish sequence :
• A → B → C , with C breaking above A and confirming bullish intent.
• This expansion created two important reaction zones:
— BC zone → structural strength (broader discount area)
— Breaker Block → precision re-entry (highest probability)
From testing across assets, price may skip BC entirely, but it almost always respects the breaker block , as long as swing B remains protected.
➡️ If B breaks, the sequence is invalid.
Trade Plan
I’m waiting for price to retrace into the Breaker Block (4H) .
Inside that zone, I will look for LTF confirmation before entering — ideally a small BOS/MSS or shift in delivery.
Targets & Invalidation
• Target : The projected C-Target zone above
• Invalidation : ➡️ Any wick through B instantly invalidates the SK sequence — setup is dead.
This setup reflects my current blueprint:
Structure → Breaker → LTF confirmation → Ride back to C-Target.
Not financial advice.
GBPUSD | Prices Continue Uptrend✅ Short-Term Price Direction (H4):
After a sharp decline from its peak, the H4 movement indicates a strong short-term uptrend from the recent low around 1.2100 - 1.2200. The price has created a series of clear Higher Highs (HH) and Higher Lows (HL).
The price is currently consolidating below Short-Term Resistance around 1.3100 - 1.3200, which is also the Low Volume Node (LVN) on the Daily Volume Profile. This indicates potential uncertainty after the rapid rise.
This consolidation is occurring within the newly formed High Volume Node (HVN) area on the H4 (around 1.2900 - 1.3000), which serves as strong Short-Term Support.
Short-Term Bias: Bullish (Upward), as the HH and HL structures on the H4 are still intact.
✅ H4 Key Levels:
- Short-Term Resistance (Consolidation Top): Around 1.3100 - 1.3200.
- Short-Term Support (HVN/HL): Range 1.2900 - 1.3000 (Important).
- H4 Value Area Low: Around 1.2700.
✅ Potential Scenarios
- Strong Bullish Scenario: Price successfully breaks through and maintains above the Short-Term Resistance at 1.3200, paving the way for a test of the Daily POC at 1.3400 - 1.3500.
- Correction/Reversal Scenario: A break and close below the Short-Term H4 Support (1.2900) will invalidate the H4 bullish bias and could lead to further declines to test the H4 Value Area Low at 1.2700 and the Daily Key Support.

EURUSD: This Move Wasn’t Accidental…EURUSD MARKET ANALYSIS – 1H
1. Current Price Structure
- EURUSD has completed a full parabolic rounded bottom formation, pushing price back into the upper boundary of the ascending channel.
- After touching the resistance zone (1.16800), price sharply rejected and transitioned into a descending channel, signaling a shift from bullish continuation to correction.
- The recent rally lost momentum, and price is now moving inside a bearish correction channel, confirming that buyers are weakening.
- The circled area shows a failed breakout attempt, followed by strong re-entry inside the bearish channel → classic distribution signal.
2. Liquidity Zones
Resistance Liquidity (1.16800):
Price tapped this level multiple times and got rejected aggressively → liquidity above remains intact, suggesting the market is not ready for a breakout.
Support Liquidity (1.15900):
The support zone below holds significant liquidity — multiple previous wicks show repeated absorption by buyers.
Current structure indicates
Smart money is distributing near resistance and collecting liquidity for a deeper move toward support.
3. Today’s Market Scenario
🔻 Main Scenario – Bearish Correction Toward Support
The price is expected to continue moving inside the descending channel:
Multiple lower highs forming at the top of the channel.
Price likely oscillates sideways with bearish bias, forming repeated LH–LL structures.
Final target of this correction: 1.15900 (support zone).
This aligns perfectly with the red path drawn on your chart:
- Zig-zag correction
- Progressive decline
- Reaching support zone for liquidity sweep.
Unless the resistance zone is broken convincingly, bearish continuation remains the highest-probability scenario.
4. Market Psychology
The chart reflects a classic sentiment shift:
- Before reaching resistance, traders were optimistic due to the strong bullish rally (rounded bottom).
But the sharp rejection at resistance created psychological distribution, where:
-Early buyers take profits
-Late buyers get trapped
- Smart money sells into retail optimism
The descending channel represents controlled selling pressure, not panic — this is strategic distribution.
Price will typically move slowly downward, trapping breakout traders until deeper liquidity at support is reached.
This is textbook smart-money behavior:
Euphoria → Distribution → Controlled Decline → Liquidity Sweep.
5. Intraday Strategy
🔻 Short Bias (High Probability)
Trade with the correction channel.
Entry: Short at the upper boundary of the descending channel (1.16500 – 1.16600).
SL: Above mini-swing high or above channel top (≈ 1.16750).
TP1: 1.16250
TP2: 1.16050
TP3: 1.15900 (major support zone)
🔹 Conservative Strategy
Wait for price to retest 1.16500 and show rejection before shorting.
🔸 Long Setup (Low Probability)
Only consider long if:
Price breaks the descending channel
AND Retests above 1.16650 with strong bullish confirmation.
Target if breakout occurs: 1.16800 – 1.17000.

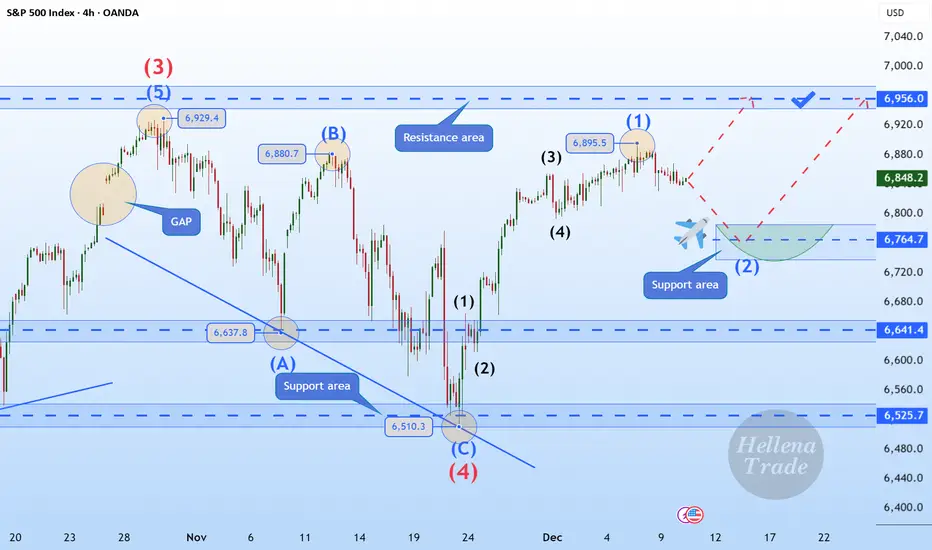
Hellena | SPX500 (4H): LONG to MAX of wave "3" of 6928.Colleagues, we continue the previous scenario of upward movement in the impulse “12345”.
I expect a small correction in the middle order wave “2” approximately to the area of 38.2%-50% Fibonacci levels (6675).
Then I expect a continuation of the upward movement to the maximum of the wave "3" of the higher order 6928.4.
It is possible that the first wave may be stretched, which may mean a correction-free movement to the target.
Fundamental Context.
Market sentiment remains cautiously bullish ahead of this week’s US data releases. Investors continue to price in a softer Fed policy path for 2026, which supports the equity market after the recent correction.
US Treasury yields remain under pressure, and the latest macro indicators — especially labor market cooling and weaker business activity components — reinforce expectations of an economic slowdown. This backdrop typically favors equity upside as markets look ahead to potential policy easing.
Manage your capital correctly and competently! Only enter trades based on reliable patterns!
Price Under Pressure and Fails to Break $4,245Gold (XAU/USD) is under pressure as it has repeatedly failed to break through the $4,245-$4,250 barrier. This failure, followed by a decline, supports the bearish view.
✅ Bearish Scenario
- ⚡Initial Critical Point: Diverse technical oscillators indicate that further declines are likely to find decent support near the weekly low, which is the $4,164-$4,163 area.
- ⚡Downside Target: Continued selling below this level could drag Gold towards the $4,100 round figure.
- ⚡Strong Support Base: The next decline will test the confluence support at $4,085.
Note: $4,085 is composed of the 200-period EMA on the 4-hour chart and an ascending trendline. This level should act as a strong short-term base.
✅ Bullish Scenario
- ⚡Strong Hurdle: The $4,245 – $4,250 zone will continue to act as an immediate strong barrier.
- ⚡Next Target: Above $4,250, the price could head towards the $4,277 – $4,278 region.
- ⚡Strong Upside Trigger: Sustained strength beyond the $4,300 round figure will be seen as a key trigger for bulls and pave the way for additional short-term gains.
BTC Is Heating Up — The Next Big Move Is Closer Than You Think!1. Market Analysis (Updated)
Bitcoin has just touched $89,000, aligning perfectly with the recovery structure we expected earlier. After the deep drop toward the $80,000–$85,000 zone, buyers stepped in aggressively, creating a clean rebound and pushing price back into momentum territory.
Today’s move coincides with a strong rally in U.S. tech stocks, shifting overall sentiment toward risk-on assets — a boost that often strengthens crypto markets.
However, the sharp drop earlier this week triggered over $200M in long liquidations, exposing how fragile leveraged positions are in current conditions. This volatility shows that while buyers are present, the broader market still carries elevated risk.
ETF inflows are slowly returning, supporting Bitcoin’s liquidity and helping stabilize short-term price swings. Yet several analysts warn the recent bounce could still be a “dead-cat bounce” if BTC fails to reclaim key structural levels.
In short:
Momentum is back — but conviction is not yet confirmed.
2. Technical Structure Update
The chart shows:
- A major Support Zone at $85,000–$86,000 — recently tested and respected.
- The current rally brings BTC back toward the $89,000–$90,000 Resistance Zone, which previously acted as a pivot and rejection point.
- If price stabilizes and breaks above this zone with strength, the bullish recovery could expand toward higher targets.
- If price gets rejected here, downside pressure can quickly return.
Right now, BTC is trading at a decision point.
3. Scenarios & Trading Strategy
🔸 Main Scenario – Bullish Continuation (Higher Probability)
If BTC holds above $89,000 and successfully breaks through $90,000, price may aim for:
Target 1: 92,500
Target 2: 94,000+
Why this matters:
- Tech-stock rally boosts risk appetite
- ETF inflows returning
- Liquidations flushed weak long positions → cleaner market structure
Strategy: Buy dips above $89K, wait for breakout confirmation.
🔹 Sub Scenario – Bearish Rejection (Caution Required)
If BTC fails to hold $89,000, and especially if it breaks below $86,000, the structure turns bearish again.
Downside targets: 83,000 - 80,000
Why?
- Market still fragile
- Heavy liquidation clusters below
- Risk sentiment turns quickly if buyers lose strength
Strategy: Expect lower highs → potential short setups toward support zones.
4. Summary & Personal View
- Overall Trend: Neutral → Slightly Bullish
- Short-Term Bias: Bullish above $89K; Bearish below $86K
- Momentum: Returning, but not fully confirmed
- Opportunity: High volatility = high reward if risk is managed
- Caution: Market still sensitive to macro news & ETF flows
BTC is entering a decisive phase — the next move will shape the rest of the week.
Hellena | GOLD (4H): LONG to resistance area of 4382(Wave 3).In the past forecast, many have rightly pointed out that wave “4” went behind the high of wave “2” and yet we are not dealing with a diagonal.
This means that the waves have stretched and have a larger range of motion and now the correction in wave “2” is ending.
Essentially the upward movement is still prioritized and I expect two scenarios:
1) Continuation of the upward movement to the resistance area of 4382 (market entry)
2) Reaching the support area 3994.4, after which the correction can be considered complete and only then the movement to the area 4382 will start.
Manage your capital correctly and competently! Only enter trades based on reliable patterns!

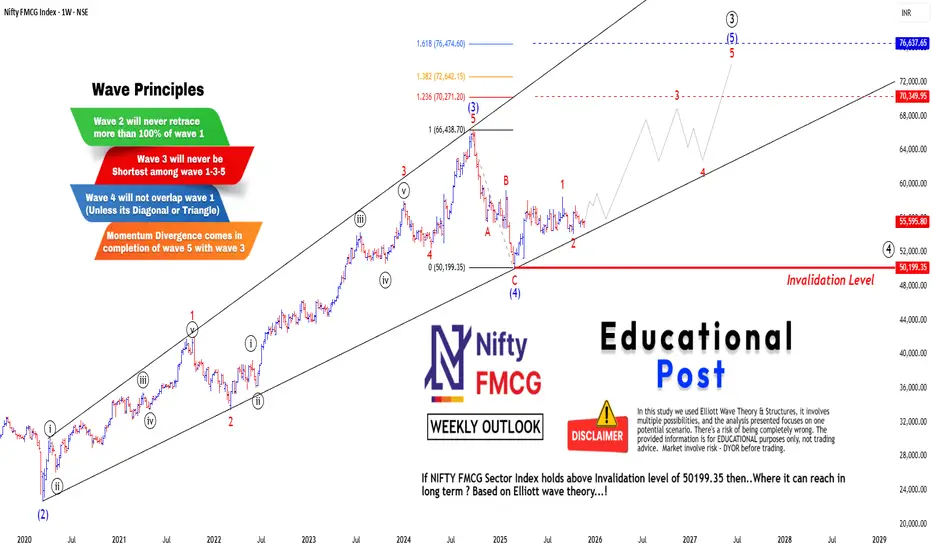
Nifty FMCG: A Deep Dive into the Elliott Wave AnalysisHello Friends,
Welcome to RK_Chaarts.
Today, we have brought this post to illustrate how we apply Elliott Wave Theory using the FMCG sector chart as an example for educational purposes.
In this post, we will analyze the Nifty FMCG Sector Index chart and see how Elliott Wave Theory can help us anticipate the potential direction of the market. We have previously discussed Elliott Wave Theory several times, and today we will apply it to the FMCG sector.
During this analysis, we will observe how the FMCG sector chart can be divided into various waves according to Elliott Wave Theory & its Principles, and how we can use these waves to forecast the future market direction. This post is purely for educational purposes and is not intended to provide any investment recommendations.
Elliott Wave Theory Principles
1) Wave 2 will never retrace more than 100% of wave 1.
2) Wave 3 will Never be shortest among all three Impulses (1-3-5)
3) Wave 4 will Never enter into the Territory of wave 1.
(Except Diagonals and Triangles)
4) Momentum RSI Divergence in Wave 3 & Wave 5.
Let's start,
We can clearly see that the sector index chart completed Wave (2) of intermediate degree (Blue) during the March 2020 fall (COVID period). After that, it moved continuously bullish and completed Wave (3) of intermediate degree (Blue) at the top of September 2024. From there, it continuously showed a fall downwards, completing Wave (4) of intermediate degree (Blue) at 50199.35 which is bottom in March 2025.
After that, the index has been moving slightly sideways to bullish, but there is still no strength or momentum visible in it. So, friends, if we assume the projection where Wave (5) can reach using Fibonacci trend-based Fib extension based on Elliott Wave Theory, Considering move in Waves (3) to (4), it can potentially reach around somewhere between fib level 1.236 to 1.618 levels in the long term in the future because this is a weekly time frame chart.
It has an invalidation level which is the low of Wave (4) pegged at 50199.35 on the chart. If the price falls even one point below this level, we will definitely have to reanalyze our wave counts and all these assumptions will get invalidated. Then we have assume that Wave (4) is still ongoing or something else is possible. So currently, assuming Wave (4) is finished, we have started the journey of Wave (5). These are assumptions as long as the price stays above the invalidation level; we can assume it will reach somewhere between fib level 1.236 to 1.618 levels in the next 1.5 to 2 years.
This analysis is based on Elliott Wave Theory and is shared purely for educational purposes to show how Elliott Wave Theory can be used to forecast a market roadmap.
I am not Sebi registered analyst.
My studies are for educational purpose only.
Please Consult your financial advisor before trading or investing.
I am not responsible for any kinds of your profits and your losses.
Most investors treat trading as a hobby because they have a full-time job doing something else.
However, If you treat trading like a business, it will pay you like a business.
If you treat like a hobby, hobbies don't pay, they cost you...!
Hope this post is helpful to community
Thanks
RK💕
Disclaimer and Risk Warning.
The analysis and discussion provided on in.tradingview.com is intended for educational purposes only and should not be relied upon for trading decisions. RK_Chaarts is not an investment adviser and the information provided here should not be taken as professional investment advice. Before buying or selling any investments, securities, or precious metals, it is recommended that you conduct your own due diligence. RK_Chaarts does not share in your profits and will not take responsibility for any losses you may incur. So Please Consult your financial advisor before trading or investing.
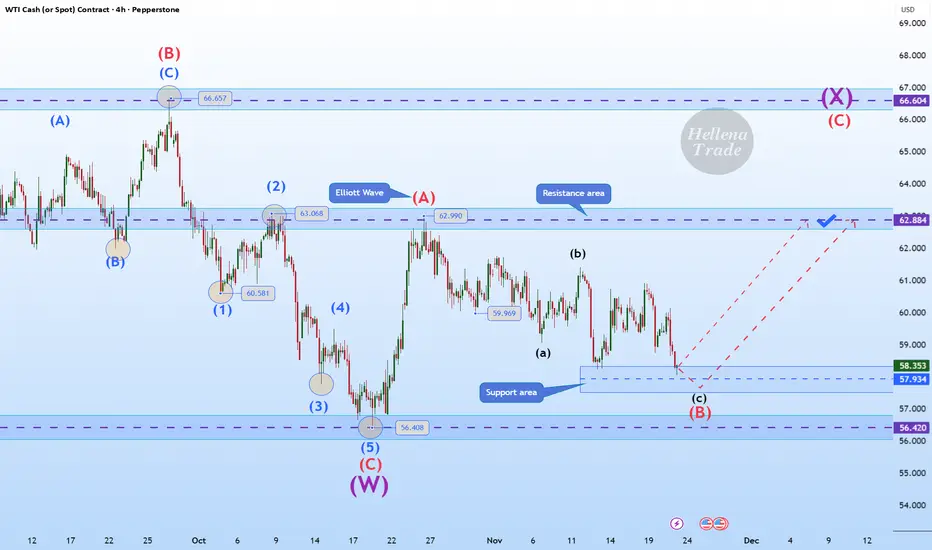
Hellena | Oil (4H): LONG to the area of the maximum of wave “A”.Colleagues, the past forecast has not been canceled, but I see some changes and therefore feel it is necessary to make a fresh forecast.
Apparently, the corrective wave “B” has extended to the area of 57.930. This is quite close to the low of wave “C” at 56.408 and the price should not update it, otherwise there will be a full-fledged break of the structure.
In connection with the above, I think that the price is already completing the downward movement and I expect the resumption of the upward movement at least to the area of the maximum of wave “A” - 62.990.
Manage your capital correctly and competently! Only enter trades based on reliable patterns!