DXY IDEADXY LOOKING LIKE ITS SETTING UP FOR A BREAK OF THE RANGE (AWAIT PRICE ACTION). SENTIMENT IS NOW TURNING BEARISH AFTER JUNE NFP, STUNTING GROWTH IN THE ECONOMY.
ON BREAK OF RANGE EXPECTING A SHARP SELL OFF TO 200MA (YELLOW)
Weakness

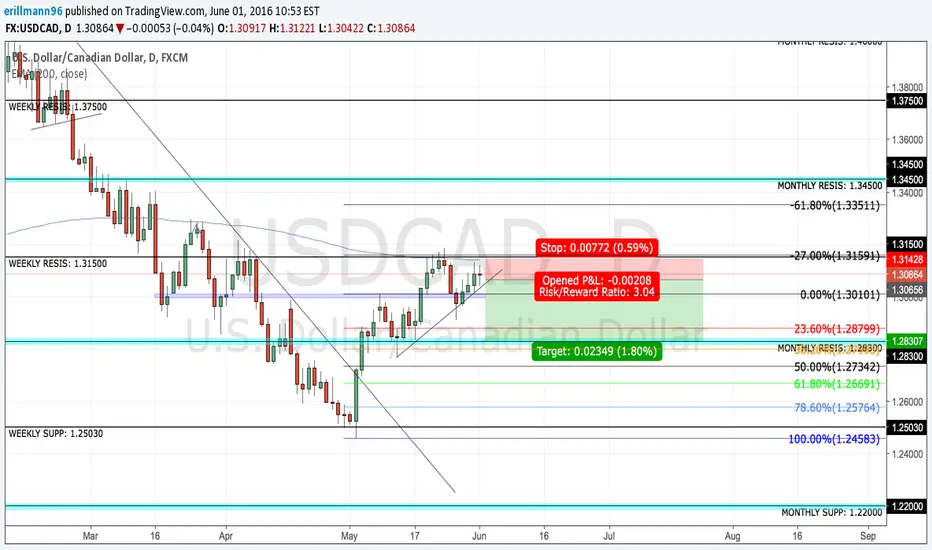
USDCAD BIAS SHORTUSDCAD FULFILLED -27.27% FIB LAST WEEK
1.31000 AREA SEEMS TO BE ACTING AS STRONG DAILY RESISTANCE ALONG WITH THE 200EMA
DXY SHOWING SEVERE DIVERGENCE TO THE DOWNSIDE
LOOK TO SELL UPON A PHASE LINE BREAK SHOWN
3:1 RISK REWARD TO KEY LEVELS 1.28300 AND 38.2% FIB
HAVE A NICE DAY
Conmed ignores recent rally and builds bear flagFundamentals :
CONMED Corporation, a medical technology company, develops, manufactures, and sells surgical devices and related equipment for minimally invasive procedures
Technicals :
$CNMD ignored recent rally in $SPY, showing that it is relatively weaker. We are in major Head&Shoulders pattern with major support (neckline) at $36. Price has built a bear flag and break lower can lead us to this major support and probably break down.
Trade and Risk Management:
Break of $38.80 will trigger an entry Short with tight stop above $40. Potential target is $34.30
CShort

SPY we are in right shoulderOther sectors like $QQQ and $IBB lost leadership and $SPY is still hanging there. Still very choppy and range-bound with no real follow through. That is why, I will wait for reliable signal.
For me, it is break and close below that neckline $204.39.
Stop above right shoulder at $208.54, but for more active traders who want lower risks I would recommend $206.70 stop above 8/21 EMAs.
My first target will be $201, then $198.

ILMN showing weakness in front of major support Fundamentals:
Illumina made a disappointing start to first-quarter 2016 missing the estimates. Also, rising costs has potential to hamper its growth significantly. This rise in higher operating expenses impacted Ilumina’s cash flow reserve in the reported quarter.
Technicals:
In the mid of summer 2015 the price of stock accelerated with top $242. But big, engulfing, bear candle ended this run to the sky. Then it broke major trend line and deeper correction started. Then, it built sereis of lower highs, which mean that bear are in control. And now, we are sitting in front of major support $130 after dissapointing earnings.
Trade Management:
Break down of major support at $130 and hold below for a few days will trigger Short Entry. Shouldn't go back above $144.50, otherwise it will be break out failure. Respective Target is $92, which make this trade attractive from Risk/Reward point of view.
Market:
$IBB - ETF for bios is underperforming the market. And overall market ($SPY) is building Head&Shoulders pattern (now, we are in right shoulder). That also supports this idea.

Smart money steering clearAs I've said before. Volume divergence is the mark of a weak market movement. Smart money is not buying right now. The peaks of volume have coincided with selling from levels like the one we're currently at, so we should see more of that to come. The price in the last rally and today has gone up on the lowest level of volume we've seen in months.
Down it goes

NFLX continuation weakness after earningsFyndamentals:
Netflix stock plunged down after earnings report as the leader of streaming video companies offered weak guidancefor subscribers growth. But it is not the only reason. The arrival of Prime Video as a more direct competitor, as well as Amazon Prime can create some challenges for Netflix.
Technicals:
The price gapped down below 200 EMA and holds near the bottom - the sign of weakness. It failed to reverse as $IBM did. And may continue its weakness, especially if market will bounce off from resistance (now, it is curling down).
Trade Management:
With today's candle, it broke down support at $94.20 (which was an entry) with the STOP above $97.40 and TARGET (next important support) at $88. The risk/reward ratio is 1:2, that makes tjis trade attractive.

$WBA forms a bear flagBig Picture:
Market is hovering around major resistance and curling down. Index for biotechnology is lagging.
The company posted an earnings and reaction of investors was negative. No, it is building nive bear flag and with today's close it was resolved.
Trade Management:
Entry near $80.70 with respective stop at $82.20 make this trade very attractive from risk/reward point of view.
WShort

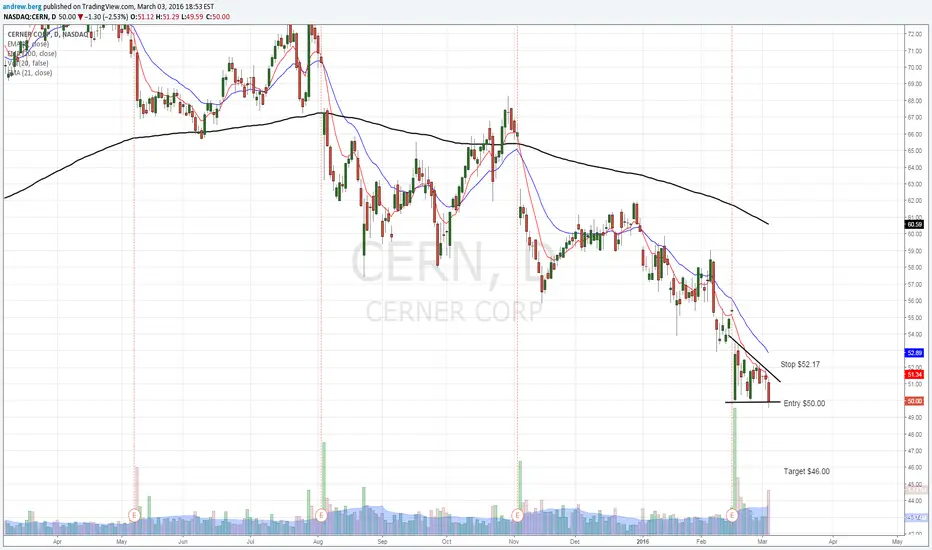
CERN under pressure + relative weaknessOverview
CERN continues to underperform. Overall chart is very weak, below all moving averages. And It feels like stock can accelarate to the downside when futures will find resistance. Today, it dropped down on big volume and closed right on $50 support, which acts like strong psychological level.
Trade- and Risk-management
Break below $50 will add some fule. This could be my netry short with stop above $52.17 and target at $46 - support from weekly chart.
CShort
5 year view of previous ideaThis weekly chart shows over all market weakness.
However for the short term I think a bounce can be expected

Buy Strength, Not WeaknessEasy to try and call bottom on a stock that looks as cheap as $JCP but the fact is they are still losing money and the downtrend is in tact. Look for a stronger retail player.
J

AUD/USD SHORT FIB LEVELSAUD/USD MONTHLY LOOKS LIKE WILL FINISH ON A SHOOTING STAR, WEEKLY ENGULFED 3 WKS PRIOR. BROKEN CHANNEL MA CROSSOVER STILL MAKING LOWER SWING HIGHS A LOWER LOWER NEEDS TO BE FORMED. ALSO LEG A,B ,C COMPLETE NOW AWAITING LEG D WHICH IS 0.74460 AREA .FUNDAMENTALS WITH DOLLAR VERY STRONG AT MOMENT

AUD/USD Analysis 30.04.2015Background:
Aud/Usd Remains in a downtrend but we found support @0.75600 ish level and price found balance,
we formed a minor range between 0.7560 support and 0.7914 resistance , where price broke thru resistance
but price traded back into the broken resistance, however its not over for the bulls as the up channel is still intact
and if we find buyers we may head back aboove to retest the current high @0.80600
Signs of Strenght:
price found support
broken resistance
up channel
Signs of Weakness:
Downtrend
broken resistance didnt turned support @ retest
Key Levels above current price:
80750
82500
79800
Key Levels below current price:
78180
77200
75600
sidenote:
A Trading channel is nothing but a diagonal trading range where the upper limits is the oversold level and the lower limits is the oversold level , whereas the mean in this case rising represents fair value. and as it rises so does demand , if price fails to take out the lower limits of the channel and we break the RED trendlines this indicates that demand is in charge and any higher low can be used as an entry signal for a long position

DXY RoadmapHere is the roadmap for the DXY, the green lines highlight smart money buyers, the red lines are smart money sellers, the highest probability is when price returns to the level for the first time. I use the DXY to gauge strength/weakness in the USD and then play the clearest setup it through cable, fiber or gold. At the moment I am still expecting further weakness in the USD.

AUDUSD 4 HOUR SHORTPrice bounced off the 0.236 fib several times forming a evening star and then several bearish pinbar candlestick patterns in a row. This is indicating selling pressure, we could see price advance to the downside soon. My preference is a rally up to the 0.5 fib in confluence with some structure but advancing up to that level is looking less likely. RBA meeting on Tuesday so id advise to get in before the meeting because im confident RBA will be dovish which will weaken AUD causing AUDUSD to plummet

Selling a weak EUR/USDIn its prominent down trend, price continues to have pronounced consecutive cycles below the 20 ema pushing EUR/USD lower. Today’s bearish reversal bar bumped just shy of a past level, now acting as resistance, at 1.2500, and closes below 20 ema and 0.618 Fibonacci level. If a short trade does not trigger a re-entry can taken at the test of 50 ema and/or 1.2500.
Entry – below today’s reversal bar
Stop – above today’s reversal bar
Target – once triggered, will let the trade run for price to rendezvous at 1.2000 where it’s been before
Reverse set up of the same nature on USD/CHF.

EURJPY the battle of the weakening currencies!After reaching a multiyear high last Thursday, with an RSI indicating overbought and a shooting star candle indicating an imminent drop in price, the dovish tone of Draghi´s language Friday morning immediately weakened the €, resulting in a significant drop for this pair. It fell over 100 pips during his speech and about the same amount during the rest of the day! According to Draghi, risks going forward are still substantial and more needs to be done to raise inflation fast.
The question before us: is this pullback temporary and will the market (after hitting the obvious support level) be looking for buyers OR will the support be broken and is more downside to come next week?
On one hand more weakness is to be expected for the Yen, due to the ongoing monetary easing by the BoJ. On the other hand more weakness is to be expected for the Euro, due to the talk of driving up inflation fast by the ECB.
My advise is to not chase a trade for this pair and to wait for now. Monday (24) is a bank holiday in Japan, Tuesday (25) morning Kuroda will speak at an international financial forum, potentially giving a new impulse to this pair. If a supportive candle will confirm the support level, I will be looking to buy it again. If however no support is found and the down side continues, I would short it first.

DDD showing weaknessIf you're looking for a sell opportunity then DDD looks promising. The decline has been steep since the high (which didn't quite touch $100) at the end of 2013.
On the weekly chart price looks almost certain to end the week below the 200ma. If this does occur then a shorting opportunity may present itself (although we should wait one more trading day just to be certain).
On the daily chart there was a large reversal candle at the 200dma (1st July) since which price has continued it's bearish move. A further gap down (on higher volume on 22nd October) gave yet more weight to a continued decline.
There could be resistance at the $28-$30 zone but, if you like to short in an overall bull market, DDD should be added to your watchlist.

CMG Cup&Handle pattern, potential gap coveringChipotle Mexican Grill formed bearish pattern called Cup&Handle with lower high (reversal candle) on 6th of October. Important level of support was at $649 and was broken yesterday with conviction. Combine it with $SPX break down of 200 EMA first time since long time and that is how you get in on the right side.
Risk Management: ENTRY was at $649 break. After 3 outside down days it feels a bit oversold. Maybe, wait for a bounce to fill with better price. STOP above $660 makes sence if sellers want to keep pressure and momentum. Then we have $682 reversal point. TARGET: as there is no visible support below previous support I will put my target at $609 which was resistance before gap up on earnings.

Possible H&S: another opportunity to short USDCAD As stated in a previous idea () this pair has already been rejected on major daily structure. Now is setting up a possible head and shoulder pattern on lower timeframe (4h).
Many pin bars formed on Friday showing price rejection below left shoulder level of the formation.
Action:
On Monday look for price to not gap nor open above pin bar's tails and sell at market.
Target 1 at neckline, next profit taking zones on relevant structures looking left

CSCO Head&ShouldersCisco is forming bearish reversal pattern with potential Right shoulder near $25.20. Previously, I was bullish on this stock (check my ideas in the links below) but sentiment is constantly changing and point to reduce risk was at $25.60 on 31 of July when upper-level base was broken.
Now, price broke down trend up and trading on its 100 EMA that acted like support in the mid of August.
Break and close below 100 EMA will trigger my SHORT entry with risk above $25.00. Also, I switch my bias from neutral to negative on overall market, as S&P looks broken (doesn't mean its short especially when oscillators are oversold below -75).

VZ looks ready for another down leg Telecoms caught some weakness after earnings release. $51.50 was important resistance above which buyers failed to hold eventhough company released numbers higher than expectations.
Now, we have tight consolidation near lows with resistance at $49.15. Break below consolidation support $48.50 will trigger Short entry and will open doors to $46 major support.
If market will enter into correction mode (complicated geopolitical situation combined with potential rate hike) that will add arguments to this idea. Risk/Reward 1:4 make this idea attractive with high-winning rate.

SLB sentiment changing to bearishDuring this recent move up in S&P (100 handles from the last bottom) Oil&Gas ($XOP) stayed one of the weakest sectors and specifically shares of Slumberger.
After exhausted move up on the end of June, it entered into correction and broke down its 50 EMA that was in control since the beginning of 2014.
Now, sellers keep preassure and hold resistance at $110 which could be stop line for short position.
My approach is active trade management. Initiate tier 1 now, then add on break down of $107.50 gap point, then add if it will close and hold below $105.39 with target at $102 - reasonable level, earlier it acted like resistance and now should act like support.
