ETH/USDT | Ethereum Rebounds Strongly – Eyes on $5K Next!By analyzing the #Ethereum chart on the weekly timeframe, we can see that after our previous analysis, price continued to rise and reached as high as $4,200. It is currently trading around $3,800, and if it can hold above this level, we could expect further upside movement.
The next potential bullish targets are $4,300, $4,500, $5,000, and $5,500.
Please support me with your likes and comments to motivate me to share more analysis with you and share your opinion about the possible trend of this chart with me !
Best Regards , Arman Shaban
Web3

ADA/USDT | ADA Setting Up for 10% to 100% Gains, Don’t Miss ThisBy analyzing the Cardano (ADA) chart on the 3-day timeframe, we can see that price is currently trading around $0.67.
Based on the current structure, I expect ADA to start a strong bullish move after a short period of consolidation.
The expected potential returns are around +10% short-term, +40% mid-term, and over +100% long-term. This analysis will be updated soon!
Please support me with your likes and comments to motivate me to share more analysis with you and share your opinion about the possible trend of this chart with me !
Best Regards , Arman Shaban

Hyperliquid Price Scenario 10/15Wait for Liquidity sweep and close of candle above range on the 4hr timeframe to confirm entry. Manage risk accordingly, if price fails to close above range then entry is not valid.

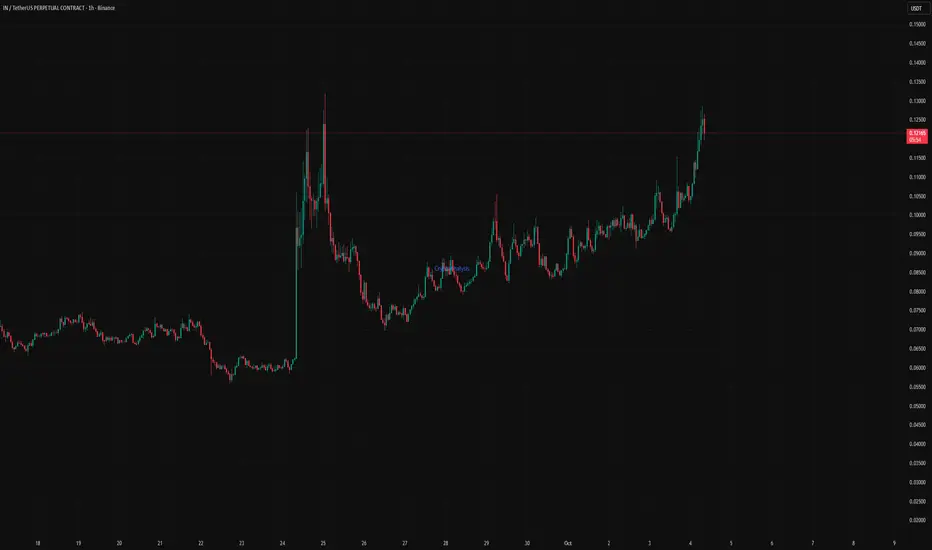
$IN — Agentic DeFi Awakening | Momentum Building for $1
Infinit Labs is gaining strong traction across both technicals and fundamentals — fueled by the rise of Agentic DeFi and upcoming reward distributions.
Key Points:
24H Pump: +75% gain, reaching new all-time highs at $0.1256.
Volume Surge: IN volume up significantly, signaling renewed retail and institutional attention.
Strong Narrative: Backed by Electric Capital, Mirana, and Hashed — Infinit is pioneering AI-powered DeFi Intelligence where agents execute on-chain strategies autonomously.
Catalysts Ahead: Season 2 rewards distribution and a “big announcement” expected within 48h could drive continued upside.
Technical Breakdown
Trend: Bullish continuation confirmed after a breakout from consolidation near $0.09.
EMAs: Price trading well above EMA20 and EMA50 — short-term momentum remains intact.
Volume Profile: Increasing buy-side pressure on dips; consistent higher lows forming.
Targets:
Short-term: $0.18 – $0.22 (Fib extension zone)
Mid-term: $0.35 – $0.50 if momentum and liquidity sustain
Long-term: $1 psychological target, aligning with growing adoption and token utility
Support Levels:
$0.10 (retest zone / former resistance)
$0.085 (EMA50 confluence)
$0.065 (bullish invalidation zone)
Fundamental Context
Utility: Staking IN earns protocol fees, unlocks premium AI-agent features, and grants governance rights.
Ecosystem Growth: “Attention-based tokenomics” will reward users and creators based on real DeFi agent usage — aligning token value with utility and engagement.
Tokenomics: 1B max supply, 49.5% reserved for community and ecosystem incentives over 4 years — fostering long-term sustainability.
Conclusion
IN is transitioning from a stealth narrative to a mainstream Agentic DeFi play. With strong technical momentum, on-chain utility, and a rapidly growing community, the setup remains favorable for continuation toward $0.2+ in the short term and potentially $1 in the coming months if catalysts deliver.
Undeads (UDS) Bullish Setup: Targeting 3 USD After CorretionSince the beginning of September, UDS (Undeads) has delivered a nice rally of more than +50%, showing strong momentum and growing interest from both gamers and investors.
Built on a solid GameFi and Web3 foundation, Undeads combines a metaverse economy, staking, NFTs, and a post-to-earn model that keeps the community engaged and expanding.
With the native UDS token at the core of the ecosystem, every step of the game’s evolution drives fresh demand: from in-game purchases to staking rewards and community participation.
What makes this project even more attractive is its growing fan base and accessibility, with the game available on Steam, opening the door to mainstream adoption. At the same time, staking opportunities and play-to-earn mechanics add a strong incentive to hold UDS, reinforcing its long-term value proposition.
The fundamentals remain bullish, positioning UDS as one of the standout performers in the GameFi sector. 🚀
________________________________________
Key Question
Is this just the beginning of UDS’s bullish run, or will the current correction push prices lower before the next breakout?
________________________________________
Why a Healthy Correction is Good
• 2 USD resistance: Price just tested this area twice, creating a double top before pulling back.
• Support retest: The 1.35–1.30 zone, which acted as resistance since late August, is now turning into support – a classic technical setup.
• Higher lows structure: Since April, UDS has consistently made higher lows, confirming the broader bullish trend remains intact.
________________________________________
Trading Plan
The correction we see now could provide a better entry zone around 1.35–1.30, aligning with both technical and structural support. As long as this zone holds, bulls remain in control.
A soft target for this bullish scenario stands around 3 USD, which would represent the next key resistance and a natural profit-taking zone for short-term traders.
________________________________________
Final Thoughts
UDS combines strong fundamentals with a clear technical structure: bullish trend, healthy corrections, and expanding adoption. If the 1.35–1.30 support zone holds, we may see the next leg higher toward 3 USD in the weeks ahead.

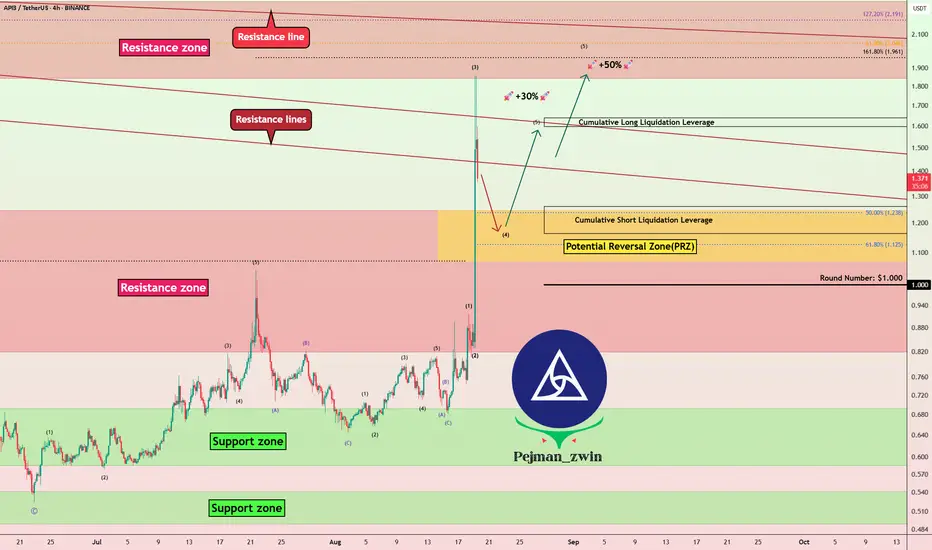
API3 Breaks Resistance – Is the Next Bullish Wave Coming?The listing news of API3 ( BINANCE:API3USDT ) on South Korea’s major exchange Upbit has boosted interest in the project. Starting from August 19, 2025, API3 will be available for trading on both KRW and USDT markets .
Reason for the surge : Being listed on one of the largest Korean exchanges not only brings more liquidity to API3 but also increases investor attention towards Web3-focused infrastructure and decentralized APIs.
API3 is a project designed to provide decentralized APIs for Web3 applications , aiming to give dApps secure and cost-effective access to real-world data without centralized intermediaries.
------------------------------------------
Now let's check whether we can still use the uptrend of the API3 token or not !? To answer this question, we need to refer to the API3 token chart on the 4-hour time frame .
The API3 token appears to have broken the Resistance zone($1.250-$0.820) with high momentum ( due to the above news ).
In terms of Elliott Wave theory , it seems that the API3 token has successfully completed wave 3 near the Resistance lines and is currently completing wave 4 . Wave 4 could be a pullback and complete at Potential Reversal Zone(PRZ) .
Note : Wave 5 could be a truncated wave due to the high momentum of wave 3.
I expect that the API3 token can start increasing again after the pullback(wave 4) is completed and at least +30% .
Cumulative Short Liquidation Leverage: $1.638-$1.597
Cumulative Long Liquidation Leverage: $1.260-$1.164
Note: Worst Stop Loss(SL): $0.923
Please respect each other's ideas and express them politely if you agree or disagree.
API3 Analyze (API3USDT), 4-hour time frame.
Be sure to follow the updated ideas.
Do not forget to put a Stop loss for your positions (For every position you want to open).
Please follow your strategy and updates; this is just my Idea, and I will gladly see your ideas in this post.
Please do not forget the ✅' like '✅ button 🙏😊 & Share it with your friends; thanks, and Trade safe.
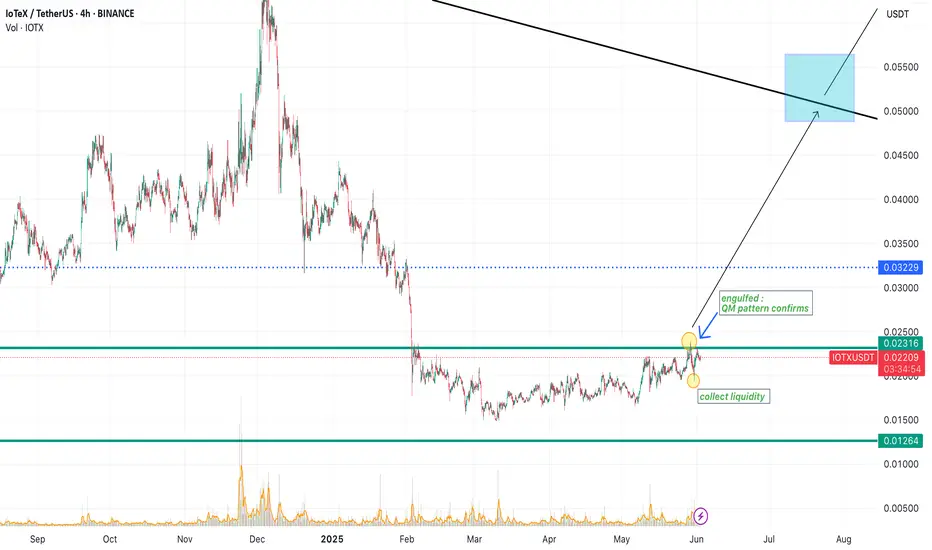
IOTXUSDT🚀 IoTeX (IOTX): A Hidden Gem for Short-Term Gains & Long-Term Growth?
Looking for a crypto project with real-world utility and strong upside potential? IoTeX (IOTX)—a decentralized platform powering the Internet of Things (IoT)—might be worth your attention.
Why IoTeX?
✔ Innovation Meets IoT: Combines blockchain + IoT for secure, privacy-focused machine-to-machine (M2M) ecosystems.
✔ Partnerships & Adoption: Backed by industry giants (like Samsung) and used in real-world applications (smart devices, DePIN).
✔ Price Potential: Volatility offers short-term trading opportunities, while long-term growth aligns with IoT’s explosive expansion (projected $2.4T market by 2029).
📌 Short-Term: Watch for bullish trends amid crypto market rebounds and project updates.
📌 Long-Term: HODL potential as IoT adoption grows and IoTeX cements its niche.
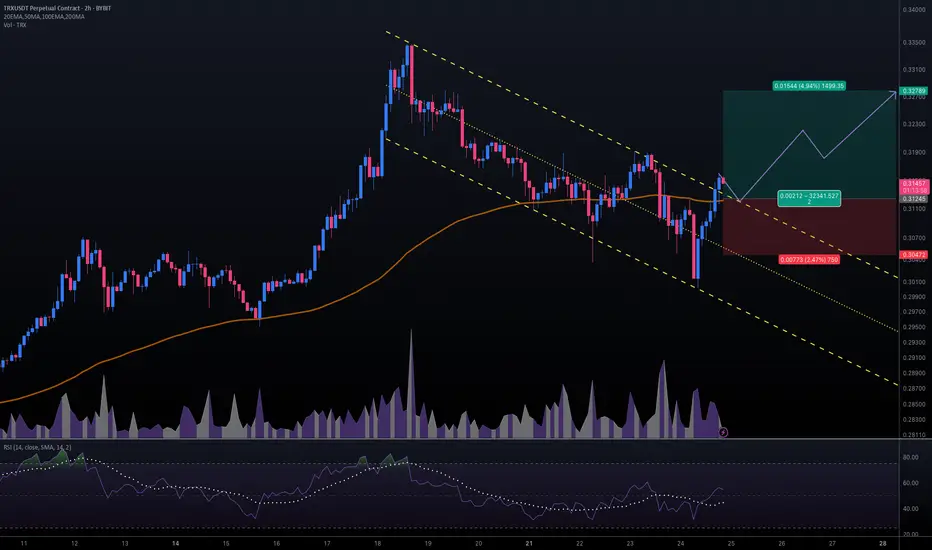
#TRXUSDT #2h (ByBit) Descending channel breakout and retestTron just regained 100EMA support and seems ready for bullish continuation after a pullback to it.
⚡️⚡️ #TRX/USDT ⚡️⚡️
Exchanges: ByBit USDT
Signal Type: Regular (Long)
Leverage: Isolated (16.0X)
Amount: 5.1%
Entry Targets:
1) 0.31245
Take-Profit Targets:
1) 0.32789
Stop Targets:
1) 0.30472
Published By: @Zblaba
CRYPTOCAP:TRX BYBIT:TRXUSDT.P #2h #TRON #DPoS #L1 #Web3 trondao.org tron.network
Risk/Reward= 1:2.0
Expected Profit= +79.1%
Possible Loss= -39.6%
REI/USDT CYCLE UPDATE $0,90 by 2025 - Price prediction📈 REI/USDT CYCLE UPDATE – $0.90 by 2025
REI could break above its old ATH, targeting $0.90 in the upcoming cycle. Why?
Upcoming
✅ Ultra-fast blockchain (⏱️ 1.5s block time)
✅ Gas-free or near-zero fees – perfect for DeFi, NFTs & gaming
✅ EVM-compatible – easy migration for Ethereum dApps
✅ Low market cap → high upside potential
✅ Clean tokenomics with staking + resource model
✅ Built for speed, scale & adoption
DATA
Data shows that there is a structural trend going on, where this coin can break soon.
If the altcoin market heats up, REI has the fundamentals & tech edge to explode past previous highs. 🚀
🧠 Watch this one closely.
#REINetwork #Crypto #Altseason #EVM #PricePrediction #Web3
This is not trading advice, but a view from a side of study.

GRT Short Term BullishOverall this crypto is very weak. Most alts are weak, with few exceptions. The Graph has actually been non-stop building even though the coin has bled out for 4+ years. I doubt the long-term trend is bullish, but on the short term, it looks like a standard head and shoulders pattern on the 1-hour. On the 4-hour we have a golden cross - although every other time frame is so bearish.
I started buying some on the left shoulder while it fell in the target zone; I loaded the trade fully on 40x leverage after the right shoulder completed and broker through the zone of resistance.
Looking to see a break of $0.13, which is the top of the head pattern. If we see blow off top in crypto, it should break through decisively over the next 30 days and we could see low .20s
Anything is possible but I may be out of this trade by the time you read this. Not Financial Advice. Probably completely random nonsense.

CLV Clover FinanceIf we do see a bank less world these interoperable plays could be trusts/less providers.
I do believe we will see the world financial system change dramatically in this lifetime and sooner than later.
I've decided today to toss $1,000 into CLV and if it hits that's cool and if it does not.... It does not.
I will roll half my position into LTC if this does giga pump.
THIS IS NOT FINANCIAL ADVICE!!!

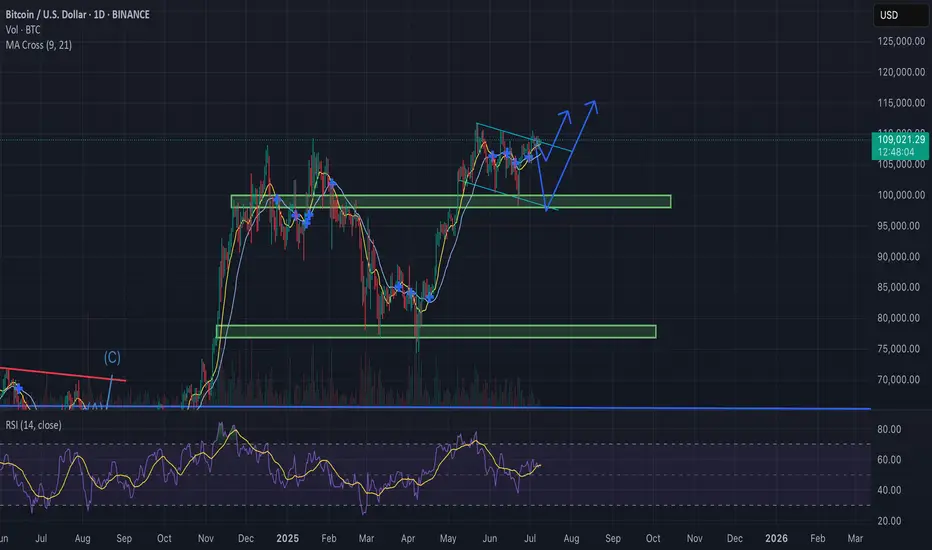
Bitcoin Update – Bullish Falling Wedge in Play?BTC/USD is currently trading near $108.8K, compressing within a falling wedge formation — historically a bullish continuation pattern, especially after a strong uptrend.
Why the Bias Remains Bullish:
Bullish MA Cross: Short-term MAs (9/21) are aligned for upside momentum.
Falling Wedge: Price compressing with lower highs and lows, coiling for a breakout.
RSI Strength: RSI (purple) remains elevated, supporting continued upside pressure.
Fundamental Catalysts:
Trump delays trade war announcements, reducing global uncertainty.
FOMC meeting in late July: Trump pushes for rate cuts, potentially bullish for risk assets like BTC.
If BTC breaks out above the wedge resistance with convincing volume:
Retest likely at ~$110K
Targets : $115K → $120K+
TradeCityPro | WLD Builds Pressure Inside Long-Term Range👋 Welcome to TradeCity Pro!
In this analysis, I want to review the WLD coin for you. It’s one of the Privacy and Identity coins with a market cap of $1.5 billion, ranked 55 on CoinMarketCap.
⏳ 4-Hour Timeframe
In the 4-hour timeframe, a ranging box has formed for this coin between the 0.855 and 0.969 zones, and it’s been fluctuating within this range for several weeks.
📊 Volume is gradually decreasing within this box, which could indicate that a move is approaching.
⚡️ For now, we can say the volume slightly favors buyers, as the green candles have more volume than the red ones. Additionally, the size and strength of the green candles are greater, which increases the likelihood of the box breaking upward.
📈 If the price moves up toward the 0.969 zone with increased volume, we can enter a long position upon breaking 0.969.
✔️ Alternatively, if the price is supported at the 0.855 bottom, we could also open a long position—but it’s riskier, and in my opinion, not worth it. It’s better to wait for the main trigger to activate.
🔽 For a short position, if the price forms a lower high below 0.969 and then moves toward 0.855, we can open a short if 0.855 breaks. The next support zone would be 0.795.
📝 Final Thoughts
This analysis reflects our opinions and is not financial advice.
Share your thoughts in the comments, and don’t forget to share this analysis with your friends! ❤️

#RLCUSDT #1D (Binance Futures) Descending wedge on supportiExec RLC just printed a dragonfly doji which may have marked the bottom on daily.
A morning star is drawing now, recovery towards 100EMA resistance seems around the corner.
⚡️⚡️ #RLC/USDT ⚡️⚡️
Exchanges: Binance Futures
Signal Type: Regular (Long)
Leverage: Isolated (4.0X)
Amount: 5.9%
Current Price:
0.9126
Entry Targets:
1) 0.9002
Take-Profit Targets:
1) 1.1854
Stop Targets:
1) 0.7859
Published By: @Zblaba
GETTEX:RLC BINANCE:RLCUSDT.P #DePIN #AI #iExec iex.ec
Risk/Reward= 1:2.5
Expected Profit= +126.7%
Possible Loss= -50.8%
Estimated Gaintime= 1 month

Hut 8 Corp (HUT) From Miner to Digital Infrastructure PowerhouseCompany Overview:
Hut 8 NASDAQ:HUT is transforming into a next-gen digital infrastructure leader, blending Bitcoin mining, AI compute, and cloud services for diversified, long-term growth.
Key Catalysts:
Major Operational Upgrades ⛏️
79% QoQ jump in deployed hashrate and 37% fleet efficiency gain in Q1 2025.
Positions HUT for cost-effective BTC production as crypto markets rebound.
Massive Bitcoin Reserves ₿
10,264 BTC on balance sheet (~$847M as of Mar 31, 2025).
Acts as a digital asset custodian + infrastructure operator, offering leveraged upside to BTC.
Diversification into Compute & AI Infrastructure 🧠
Q1 Digital Infrastructure + Compute revenue tops $21M.
Reduces mining dependency and captures tailwinds from AI and HPC demand.
Investment Outlook:
Bullish Case: We remain bullish on HUT above $15.00–$16.00.
Upside Target: $30.00–$32.00, driven by crypto exposure, AI-driven growth, and operational scaling.
⚙️ Hut 8 – Mining the Future of Digital Infrastructure.
#HUT #Bitcoin #CryptoMining #DigitalInfrastructure #AICompute #HPC #Web3 #BTCExposure

TradeCityPro | HNT: Testing Resistance in DePIN Uptrend Structur👋 Welcome to TradeCity Pro!
In this analysis, I’ll review the HNT coin. The Helium project is a U.S.-based Web3 and DePIN initiative.
✔️ This coin has a market cap of $9.26 million and is ranked 97th on CoinMarketCap.
⏳ 4-Hour Timeframe
On the 4-hour chart, HNT has an ascending trendline with a resistance zone near 4.372.
💥 If this resistance is broken, the main upward move may begin, and a breakout above this level confirms a bullish trend for HNT.
📈 So for a long position, you can enter on the breakout or a pullback to this zone. The next resistance level is 5.333.
🔽 For a bearish scenario, the ascending trendline must be broken first to signal a potential reversal. A break below 3.971 would be the first confirmation of that trendline break and can be used as a short trigger.
⚡️ The main short trigger would be a break of 3.642, which could push the price down toward 3.245.
🧩 The RSI oscillator is currently sitting on the 42.91 support; a breakdown here would confirm bearish momentum for a short setup.
📝 Final Thoughts
This analysis reflects our opinions and is not financial advice.
Share your thoughts in the comments, and don’t forget to share this analysis with your friends! ❤️

Reploy (RAI) – Web3 x AI Revenue-Earning Project with 61x UpsideReploy (RAI) is a rapidly emerging project at the intersection of Web3 and artificial intelligence, designed to streamline how developers build, deploy, and monetize AI agents across blockchains. Unlike many speculative tokens, Reploy stands out for one critical reason: it already earns real revenue.
According to Reploy.ai, the platform offers a no-code/low-code experience that allows anyone to launch custom AI agents and integrate them into DeFi protocols, gaming environments, and decentralized applications. Their architecture combines an on-chain identity layer with decentralized agent hosting, positioning RAI as core infrastructure for the next evolution of intelligent Web3 tools.
The project is still under the radar, trading well below $2, but the fundamentals support a much larger valuation. My 12–18 month price target is $105, which represents a 61x increase from today’s levels. This forecast is based on:
Early revenue traction from agent deployment and API integrations
Strong market tailwinds for decentralized AI applications
Platform stickiness due to unique agent monetization tools and developer incentives
Token utility driving recurring demand (staking, gas, and access control)
RAI isn’t just another AI narrative coin, it's building real infrastructure, already being used, and gaining traction. As adoption grows and more AI agents are hosted through the protocol, the value capture for RAI token holders could be exponential.
Price Target: $105
Current Price: ~$1.72 (as of May 2025)
Upside Potential: +6,000%

Why Ethereum Could 10x in the Next Few Years🚀
1. Ethereum ETF Approval
ETFs are approved in the U.S. (similar to the Bitcoin ETFs in early 2024), institutional money will flood in.
Grayscale, BlackRock, and others have already filed.
Ethereum’s price jumped significantly after similar events in the past.
2. Deflationary Supply (Post-EIP-1559)
Since EIP-1559, ETH has been burned with every transaction.
Combined with Proof-of-Stake (The Merge), ETH is now net deflationary during periods of high network activity.
3. Layer 2 Ecosystem Is Exploding
Rollups (Arbitrum, Optimism, Base, zkSync) are scaling Ethereum.
These L2s settle on Ethereum L1, driving fees and activity.
Vitalik’s "rollup-centric roadmap" is playing out — this benefits ETH long-term.
4. Real Yield from Staking
Ethereum now offers a real, sustainable yield from staking (~3–5%).
Institutions love yield. ETH becomes more like a productive asset, not just a speculative token.
5. Ethereum as the Base Layer of Web3
DeFi, NFTs, gaming, DAOs — Ethereum is still the dominant smart contract platform.
The most secure, battle-tested, and widely adopted chain.
Developers and enterprises continue to build on Ethereum over competitors.
6. Macro Tailwinds
As the U.S. moves toward looser monetary policy, risk assets (including crypto) historically benefit.
Crypto adoption is growing globally — from Latin America to Asia — and Ethereum is often the entry point.

TradeCityPro | FET: AI Token Eyes Breakout After Sharp Rebound👋 Welcome to TradeCity Pro!
In this analysis, I’m going to review the FET coin for you. This project is one of the top AI-related projects in the crypto category.
💫 With a market cap of $1.8 billion, it currently ranks 48th on CoinMarketCap.
📅 Weekly Timeframe
In the previous analysis, I mentioned that if the ascending trendline in this timeframe is broken, the price would make a higher high beyond 3.099, and with the activation of the trendline trigger, we could confirm a trend reversal in this timeframe.
✔️ As you can see, that scenario has played out. After breaking the trendline and the 0.382 Fibonacci level, the price dropped sharply down to the 0.786 level.
✨ The price reaction at this level was very quick, and after hitting this zone, it gained bullish momentum again with a bullish engulfing candle and has now reached the 0.797 area.
📈 If the 0.797 level breaks, the price could experience another sharp upward move. The next resistance levels are 1.095, 2.068, and 3.099 — with 1.095 overlapping with the 0.382 Fibonacci level.
📊 The main confirmation of trend reversal will be given by forming a higher high and higher low above the 0.797 level — confirming Dow Theory.
🔽 For a bearish continuation, the confirmation comes with a break of the 0.786 Fibonacci level. The main support levels are 0.185 and 0.058.
📅 Daily Timeframe
In the daily timeframe, we can better see the details of this bullish move. As observed, the price has had a sharp leg up from the 0.379 bottom to 0.791 without any real correction.
🧩 Given the strength of the 0.791 resistance, a correction is more likely here. If the price moves upward without correction, it’s usually not a good sign for trend sustainability. A healthy trend includes corrections.
🎲 However, if 0.791 breaks and RSI enters the Overbought zone, the price could continue rising toward the 1.128 resistance. While this might not be ideal for trend health, the risk-to-reward ratio makes opening a position worthwhile.
🛒 In my opinion, a correction followed by a new bullish wave would be a more ideal setup, increasing the chances of a breakout. Breaking this level could be a strong trigger for both spot buying and futures positions.
📉 For a bearish scenario, we need to wait for the price reaction to 0.791 and then enter after confirmation of trend reversal. Lower-level triggers would be the breaks of 0.567, 0.455, and 0.379.
📝 Final Thoughts
This analysis reflects our opinions and is not financial advice.
Share your thoughts in the comments, and don’t forget to share this analysis with your friends! ❤️

TradeCityPro | ICP: Breakout Watch in Web3 Veteran’s Price Range👋 Welcome to TradeCity Pro!
In this analysis, I’m going to review the ICP coin for you. The Internet Computer project is one of the older projects in the crypto space, focused on Web3 and gaming.
⚡️ The coin currently has a market cap of $2.65 billion, placing it at rank 36 on CoinMarketCap.
⏳ 4-Hour Timeframe
As you can see in the 4-hour timeframe, a range box has formed between the levels of 4.648 and 5.239, and the price has currently reached the top of the range.
✔️ During this upward leg from the bottom of the box, market volume has been increasing, which indicates that the probability of breaking through 5.239 is high.
🔍 If 5.239 is broken, we can enter a long position. The next resistance levels are at 5.558 and 6.313.
✨ There’s also a larger range box between 4.648 and 6.313, and as long as the price stays above 4.648, we can say that this broader range is valid and price is fluctuating within it.
📉 To open a short position, wait for the break of 4.648. The momentum in higher timeframes for this coin is bearish, so if this level breaks, the trend may continue downward with another leg to the downside.
📊 For that to happen, selling volume must increase, so that when 4.648 breaks, there is no volume divergence, ensuring a healthy continuation of the trend.
📝 Final Thoughts
This analysis reflects our opinions and is not financial advice.
Share your thoughts in the comments, and don’t forget to share this analysis with your friends! ❤️

TradeCityPro | WLD: Waiting for Reversal in Altman’s Web3 Coin👋 Welcome to TradeCity Pro!
In this analysis, I want to review the WLD coin for you. This project is one of the notable Web3 and Identity projects, founded by Sam Altman, who is also the CEO of OpenAI — and that adds a layer of trust to the project.
🔍 Currently, this coin has a market cap of $984 million, placing it at rank 64 on CoinMarketCap.
📅 Daily Time Frame
As you can see in the daily time frame, the price has dropped significantly since the previous analysis. After breaking below the 1.349 level, the main bearish leg began, and the price fell to the 0.603 area.
🧩 Currently, the price is in a correction phase, moving slowly upward on low volume, and has broken above the SMA25, now trading above this moving average.
🎲 Keep in mind: even though the price is above the SMA25, the slope of the moving average is still downward, which indicates that bearish momentum is still present in the market. However, since the price is now above the SMA, bearish strength is weakening.
📈 To confirm a bullish reversal for WLD, the key trigger right now is the breakout of the 0.947 level. If the price stabilizes above this level, we can say the trend has shifted to bullish.
✔️ A sooner confirmation of the trend change would be a positive slope on the SMA25 combined with increasing volume and green candles — this would be an early sign of a reversal.
🛒 For spot buying, the first trigger is the break of 0.947, and if the price holds above that, the bullish trend could begin.
🔽 The next resistance levels — which could act as targets or secondary buy triggers — are at 1.349 and 2.5776 respectively.
📊 If you already hold this coin and are looking to set a stop-loss, a break and confirmation below 0.603 would be a good level to activate your stop.
📝 Final Thoughts
This analysis reflects our opinions and is not financial advice.
Share your thoughts in the comments, and don’t forget to share this analysis with your friends! ❤️

TradeCityPro | EOS Retraces Gains: Key Levels to Watch Now👋 Welcome to TradeCity Pro!
In this analysis, I’m going to review the EOS coin for you. This is one of the American-based projects operating in the Web3 space, currently ranked 63 on CoinMarketCap with a market cap of $970 million.
⌛️ 4-Hour Timeframe
On the 4-hour timeframe, as you can see, the price formed a bullish move after breaking through the 0.5997 level, which continued up to the 0.8604 zone before entering a correction phase.
🔍 After being rejected from the 0.8604 top, the price experienced a significant decline and has now returned to the 0.5997 level, fully retracing all of its previous bullish waves.
📈 For a long position, you can enter on a breakout above 0.6338. If the price stabilizes above this zone, it could move upward toward the 0.8064 level.
🔽 For a short position, you can enter if 0.5997 is broken, and the next bearish leg could potentially extend to 0.5433.
📝 Final Thoughts
This analysis reflects our opinions and is not financial advice.
Share your thoughts in the comments, and don’t forget to share this analysis with your friends! ❤️

TradeCityPro | AR: Key Triggers in Web3 Storage Coin’s Downtrend👋 Welcome to TradeCity Pro!
In this analysis, I want to review the AR coin for you. This project is one of the Storage and Web3 platforms, and the coin of this project, with a market cap of $352 million, is ranked 124th on CoinMarketCap.
⏳ 4-Hour Time Frame
In the 4-hour time frame, as you can see, this coin is in a downtrend, and in its latest leg, after being rejected from the 7.70 top, it started to drop, and this decline continued down to the 4.78 zone.
✔️ Currently, the price has retraced to the 0.382 Fibonacci level and has created a range box between 4.78 and 5.65. A break of this box can determine the trend of this coin for the coming days or even weeks.
✨ The SMA99 indicator has so far acted well as a dynamic resistance, and within the current box, the price has already reacted to it once and is now again pulling back to this moving average.
💥 If the price is rejected from this indicator and forms a lower high than 5.65, the probability of breaking the 4.78 bottom increases significantly, and the price could move toward lower lows.
⚡️ The 4.78 support is actually a support range between 4.78 and 4.92, and to confirm a bearish move, the risky trigger is 4.92, and the main trigger is 4.78.
🔼 For a long position or spot buy, we should first wait for the SMA99 to break and for the 5.65 zone to activate. The break of this zone would be the first confirmation of a trend reversal, and the main confirmation would come after the price makes a higher low and higher high above the 5.65 zone.
🎲 The main resistance levels above this area are the 0.5, 0.618, and 0.786 Fibonacci levels. Another key resistance is the 7.70 zone.
📝 Final Thoughts
This analysis reflects our opinions and is not financial advice.
Share your thoughts in the comments, and don’t forget to share this analysis with your friends! ❤️
