Wedgepatterns

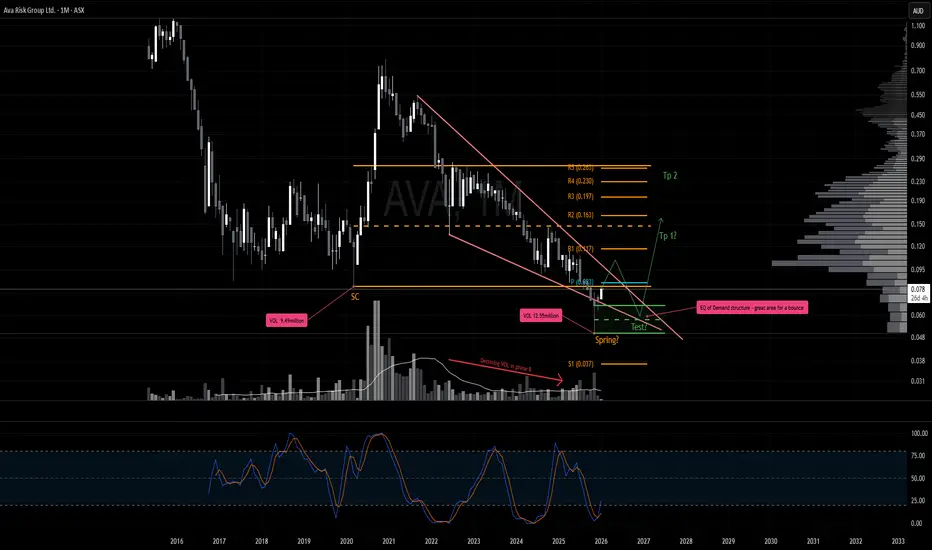
Reversal Incoming AVA is shaping up as one to watch.
The November low may have formed a high‑volume spring with a brief throw‑under of the wedge structure. It’s a constructive signal, but confirmation is still lacking. Price has yet to break back into the range and close convincingly.
For the bullish scenario, the key level is the new yearly pivot at $0.083.
Importance of this zone: it’s the first approach into the yearly pivot, it aligns with range‑low resistance, and it intersects the downward resistance trendline. A clean, impulsive break on increased volume and close above this cluster would signal real strength.
If that breakout occurs, the next expectation is a pullback to retest the spring, especially given the spring printed higher volume than the selling climax, making it a logical demand check.
Scenario 2
Since price is in high-risk zone a strong rejection here could result in a much deeper pullback. First zone of interest would be the yearly 1 pivot
BTC/USDT 4H - Bearish Descending Wedge SetupPrice compressing in a descending wedge: descending resistance (red) repeatedly rejecting at ~$96k-$98k zone, while rising support (green) holds lower lows.
Classic wedges are bullish, but heavy overhead resistance + liquidity pool marked below ~$80k-$82k suggests potential bearish resolution.
Bias: Short on rejection/break of green support line.
Target: Liquidity sweep $80k-82k lows.

EURUSD Rises as the USD Faces HeadwindsHello everyone — let’s discuss FX:EURUSD .
At the start of the new week, EURUSD is trading relatively steady, showing little change from the previous session while maintaining its bullish momentum around the 1.173 area.
The U.S. dollar (USD) has weakened following the U.S. Federal Reserve’s recent monetary policy decision, which is currently providing a favorable backdrop for the pair’s recovery.
From a technical perspective, buyers remain in control. The pair is forming a wedge pattern and is undergoing a healthy correction after the previous strong rally. The first key support lies at 1.172, followed by 1.168. As long as these levels hold, the path of least resistance for EURUSD in the short term remains to the upside. Upside targets are seen at 1.175 and 1.180.
What’s your view on the outlook for this pair? Feel free to share your thoughts.

Technical analysis of bitcoin key levels and wedge chart pattern1. Trend Structure
The descending trendline (Resistance line) at the top of the chart remains valid.
The price has repeatedly faced rejection at this level, indicating that the medium-term downtrend is still intact.
2. Key Price Levels and Indicators
50-week EMA
The price has recently recorded its third downward break below the 50-week EMA.
From a traditional technical perspective, this is viewed as a signal that strengthens the possibility of a medium- to long-term bearish shift.
POC (Point of Control)
The mid-range POC is acting as a strong supply zone,
and recent rebound attempts have also failed to break above this level decisively.
3. Liquidity Zones
Two major liquidity zones are marked in the upper and mid sections of the chart.
Liquidity zone near 112k (upper zone)
A cluster of large liquidity pockets and liquidation points
If a short-term rebound occurs, this is the first upside target likely to be tested
Liquidity zone near 102k (mid zone)
Overlaps with the 4h FVG, making it a level closely watched by both buyers and sellers
4. FVG (Fair Value Gap)
Multiple FVGs are present on the 4-hour timeframe, with some already filled.
Unfilled FVGs have a high probability of being revisited as the market corrects in the future.
5. CME Gap
All weekday CME gaps have already been filled and may act as short-term resistance.
A weekend gap forms when Monday’s CME opening price starts above 95.4K.
6. Current Market Structure Interpretation
The price is currently attempting a rebound from the lower boundary of the downtrend.
However, several resistance layers overlap—POC, FVG zones, and trendline resistance—raising the likelihood of heavy selling pressure on any upward move.
In the short term, volatility consolidation is expected within the 96k–100k range.
7. Potential Formation of a Lower Wedge Pattern
The price has broken below the lower boundary of the wedge pattern, accompanied by rising volume.
A short-term rebound is likely, and if the price re-enters the wedge, further upside momentum may follow.
If the lower trendline is not reclaimed, the structure may shift into a range after a retest.
8. USDT.D Chart Analysis
The price has once again touched the upper boundary of a downtrend line that has persisted for over a year.
Downward pressure on the USDT dominance chart suggests potential upward momentum for Bitcoin.
Technically, this zone offers conditions supportive of a short-term rebound.
9. Summary
The medium-term trend remains bearish, with the ongoing breakdown below the 50-week EMA reinforcing a sustained bearish outlook.
A short-term bottoming attempt is visible, but dense supply overhead limits the strength of any rebound.
FVGs, POC, and liquidity zones overlap near the current price region, increasing the probability of heightened volatility.
If you found this content helpful, feel free to support with a boost (🚀) and a comment (💬).
Your encouragement helps drive better analysis and more valuable content.
Follow the page to receive notifications (🔔) for future posts.

TJX | Possible Break Out Incoming | LONGThe TJX Cos., Inc. engages in the retail of apparel and home fashion products. It operates through the following business segments: Marmaxx, HomeGoods, TJX Canada, and TJX International. The Marmaxx segment sells family apparel including apparel, home fashions, and other merchandise. The HomeGoods segment offers an assortment of home fashions, including furniture, rugs, lighting, soft home, decorative accessories, tabletop and cookware as well as expanded pet, kids, and gourmet food departments. The TJX Canada segment operates the Winners, Marshalls, and HomeSense chains in Canada. The TJX International segment includes operations of T.K. Maxx and Homesense chains in Europe and the T.K. Maxx chain in Australia. The company was founded by Bernard Cammarata in 1962 and is headquartered in Framingham, MA.

GBPAUD BEARISH WEDGE PATTERN|SHORT|
✅GBPAUD price is consolidating in a bearish wedge after a sharp drop, suggesting continuation toward the 1.9950 target zone once support breaks. Time Frame 5H.
SHORT🔥
✅Like and subscribe to never miss a new idea!✅

$BYND - The Next GMELet's look at the thesis behind this idea :-
1) Massive Short interest.
2) Falling Wedge Pattern.
3) Diamond Hands are back again and This time they are supporting BYND.
4) Untapped Liquidity Resting above and possibility of liquidating Shorts would also be appealing to Market makers to supply Liquidity to HIGHER Bidders for building new Short positions.
From my speculation, this is highly risky play. But how to play it?
No need to go full APE.
Risk Assessment can be used. Assess your risk. Use a Stop loss. Accept your Risk. Always use a Stop loss with risk in mind of what you can afford to lose.
This is not a Financial Advice. Your gains and losses are your responsibility. I wish you good luck.
This idea is for educational purposes only. DYOR.
If you like this idea then Follow me please.

Bitcoin Update – November 1, 2025 - Revised 2026 target $46KBitcoin and Crypto Market Update – November 1, 2025
Bitcoin has completed its cup-and-handle pattern , hitting the technical target near $118,000 before rolling over into a fresh rising-wedge formation . The new structure is supported by declining volume , hinting at fading momentum and a potential pullback toward $46,000 .
Today’s move mirrors broader macro caution—the Fed’s pause on rate cuts and Trump–Xi trade tensions have triggered a wave of risk-off sentiment. Bitcoin is down 3.8% to $110,063 , Ethereum −3.6% ($3,853), and XRP −4.1% ($2.51).
Despite the dip, ETF inflows remain strong (BTC +$202 M, ETH +$246 M), showing institutions still buying the weakness. November historically delivers +42.5% average gains, but traders should stay alert as the rising wedge matures.
Technical summary:
* ✅ Cup & Handle target ≈ $118 K (completed)
* ⚠️ Rising Wedge forming → Target ≈ $46 K
* 📉 Volume decline = weakening trend strength
* 🟢 Institutional inflows = long-term support, volume declining over 5-10 year cycle
📊 Posted by Market Monkey — decoding the market’s next move.

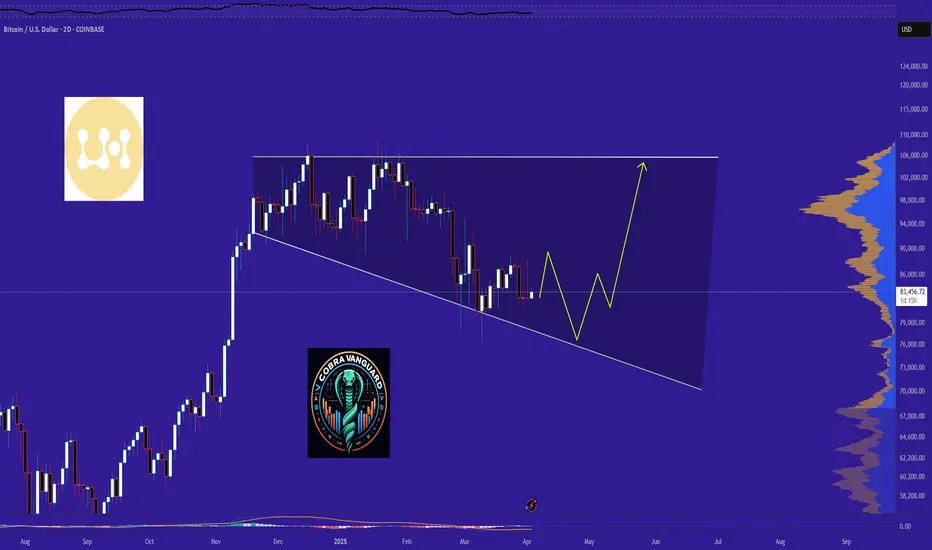
BTC Ready for PUMP or what ?The BTC will increase 20k and reach to the top of the wedge in the coming DAYS.
Give me some energy !!
✨We spend hours finding potential opportunities and writing useful ideas, we would be happy if you support us.
Best regards CobraVanguard.💚
_ _ _ _ __ _ _ _ _ _ _ _ _ _ _ _ _ _ _ _ _ _ _ _ _ _ _ _ _ _ _ _
✅Thank you, and for more ideas, hit ❤️Like❤️ and 🌟Follow🌟!
⚠️Things can change...
The markets are always changing and even with all these signals, the market changes tend to be strong and fast!!
TCS 60 MINS TIME FRAME MY VIEW The Structure looks good to us, waiting for this instrument to correct and then give us these opportunities as shown on this instrument (Price Chart).
Note: Its my view only and its for educational purpose only. Only who has got knowledge about this strategy, will understand what to be done on this setup. its purely based on my technical analysis only (strategies). we don't focus on the short term moves, we look for only for Bullish or Bearish Impulsive moves on the setups after a good price action is formed as per the strategy. we never get into corrective moves. because it will test our patience and also it will be a bullish or a bearish trap. and try trade the big moves.
We do not get into bullish or bearish traps. We anticipate and get into only big bullish or bearish moves (Impulsive Moves). Just ride the Bullish or Bearish Impulsive Move. Learn & Know the Complete Market Cycle.
Buy Low and Sell High Concept. Buy at Cheaper Price and Sell at Expensive Price.
Please keep your comments useful & respectful.
Keep it simple, keep it Unique.
Thanks for your support
Tradelikemee Academy
Saanjayy K G

BB | BlackBerry Is About To Pop | LONGBlackBerry Ltd. engages in the provision of intelligent security software and services. It operates through the following segments: Cybersecurity, Internet of Things (IoT), and Licensing and Other. The Cybersecurity segment includes the brand Cylance, BlackBerry Spark, AtHoc, and SecuSUITE. The IoT segment focuses on software licenses, support, maintenance, and professional services. The Licensing and Other segment involves the intellectual property licensing arrangements and settlement awards. The company was founded by Michael Lazaridis, James Laurence Balsillie, and Douglas E. Fregin on March 7, 1984 and is headquartered in Waterloo, Canada.

What’s a Wedge Pattern?What's up traders! 👋
Wedge patterns are a powerful tool in technical analysis that can give you a heads-up about potential price moves. Whether you’re spotting a falling wedge or a rising wedge, these formations can reveal key signals about market direction.
What’s a Wedge Pattern?
A wedge pattern forms when price moves between two converging trendlines, creating a shape resembling a triangle. These patterns usually appear when the market is slowing down or consolidating before making a bigger move. Wedges can slope upwards or downwards, and the key difference lies in whether the trendlines are converging in an uptrend (rising wedge) or a downtrend (falling wedge).
Falling Wedge Pattern: Bullish Reversal 📈
The falling wedge pattern is a bullish reversal signal. This formation occurs when price moves between two downward-sloping trendlines, creating a series of lower highs and lower lows. The downward momentum weakens as the trendlines converge, indicating that sellers are losing strength, which sets up the potential for a bullish breakout.
How to Trade the Falling Wedge
Entry: Wait for the price to break above the upper trendline. This is your signal to enter long.
Target: Measure the height of the wedge at its widest point and project it upwards from the breakout point.
Stop Loss: Place it just below the most recent swing low to protect your position if the breakout doesn’t happen.
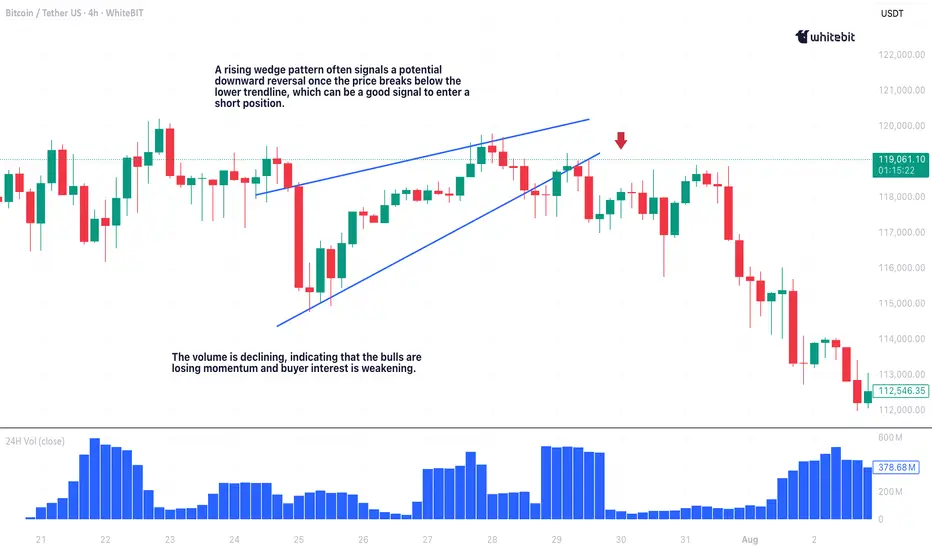
The chart illustrates a falling wedge pattern on the Bitcoin / Tether US pair with a 1-hour timeframe. Price action is contained within two converging downward-sloping trendlines, suggesting weakening bearish momentum. The breakout above the upper trendline signals a bullish reversal, and the subsequent uptick in price confirms the shift in momentum.
In rare cases, a breakout failure can lead to a bearish falling wedge pattern, but this scenario is less common. Keep an eye on the price action for signs of continued upward momentum.
Rising Wedge Pattern: Bearish Reversal 📉
The rising wedge pattern is a bearish reversal signal. This formation happens when price moves between two upward-sloping trendlines, creating higher highs and higher lows. The rising wedge indicates weakening buying pressure and a potential reversal to the downside.
How to Trade the Rising Wedge
Entry: Enter a short position once the price breaks below the lower trendline.
Target: Measure the height of the wedge and project it downward from the breakout point.
Stop Loss: Set it just above the most recent swing high to protect your trade.
Wedge Chart Pattern Trading: Key Tips ⚡
Context is everything when trading wedge patterns. If a bullish wedge pattern appears in an uptrend, it’s more likely to break to the upside. If a bearish wedge shows up in a downtrend, expect a breakdown.
Here are a few quick tips to improve your wedge trading pattern game:
Trendlines are key: Ensure your trendlines are drawn accurately. Properly drawn trendlines lead to better trades.
Breakout confirmation: Confirm breakouts with increased volume and, ideally, by checking for confluence with other indicators like RSI or MACD. A breakout without volume is often a false signal.
Risk management: Always use a stop loss to protect your capital.
Use other indicators: Wedge patterns work well with additional tools such as RSI, moving averages, or MACD. The more confluence, the better!
Final Thoughts 🏁
Wedge patterns, whether it’s the falling wedge pattern signaling a bullish reversal or the rising wedge pattern trading indicating bearish pressure, are some of the most reliable chart formations out there. But remember: no setup is perfect, so always use a stop loss and never rely on a single indicator.
With practice, you’ll get better at spotting these setups and timing your entries and exits like a pro. Happy trading, and may the charts be in your favor! 💰📊
Santos 1H Rising WedgeOn the 1H chart, $SANTOS is trading inside a rising wedge ⚠️
If breakdown plays out, price may revisit the $1.75–$1.76 area.
#Crypto #SANTOS #Signals #SANTOSUSDT

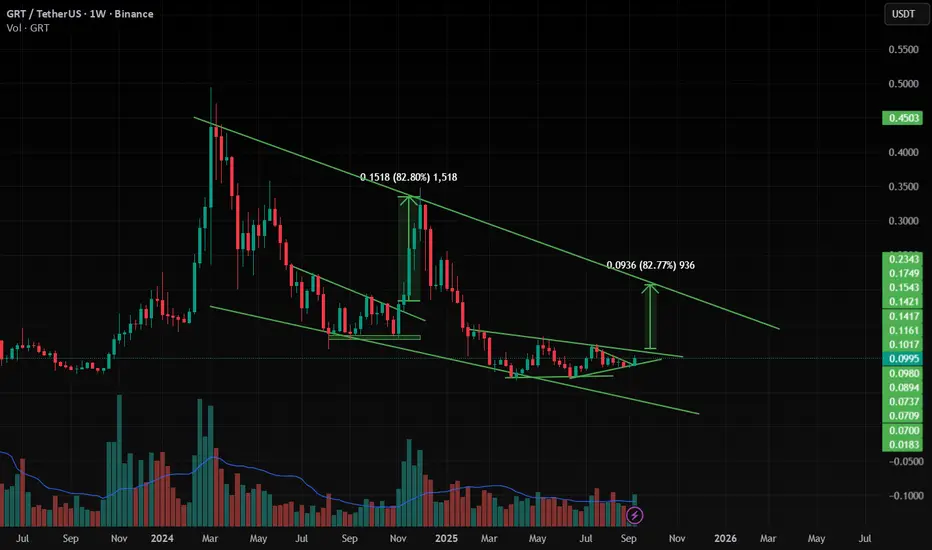
GRT is ready to move 80% Up GRT is moving inside the Triangle or Flag or wedge , and when it is breaking from pattern at support giving good move .
and at the same time Bitcoin dominance is decreasing and altcoins dominance is started increasing , so look on all the altcoins.
and follow proper risk management , it has very good chances to move UP side but first we have to protect the down side , where risk management comes into game .
BTCUSD: Decline Movement ContinuesHello everyone, here is my breakdown of the current Bitcoin setup.
Market Analysis
From a broader perspective, the price action for Bitcoin has been bearish since it was rejected from the major Resistance Zone 2 near 118900. This initiated a downtrend that has since been developing within the confines of a large downward wedge pattern, creating a sequence of lower highs and lower lows.
The most recent significant event was the breakdown below the key horizontal Resistance Zone 1 around the 112100 mark. After finding temporary support, the price is now in a corrective rally, heading back up towards the main resistance line of the wedge in a classic retest move.
My Scenario & Strategy
My scenario is based on the expectation that the dominant downtrend will continue. I'm anticipating that the price will complete this corrective bounce and touch the wedge's resistance line. Upon reaching this area, I expect sellers to show strength, reject the price, and cause a reversal that initiates the next impulsive move downwards within the overall structure.
Therefore, the strategy is to watch for this rejection from the wedge's resistance. The primary target for this move is 106500 points, which aligns perfectly with the lower support line of the wedge pattern.
That's the setup I'm tracking. Thank you for your attention, and always manage your risk.

XAU/USD Technical Outlook – Short-Term Dip, Bigger Upside AheadHello guys.
It is what I see:
We can see that Gold is currently trading around $3,404, consolidating after a strong bullish move inside a rising wedge formation. The wedge has now broken out to the upside, and price action is showing a potential head and shoulders pattern near the top.
Head and Shoulders:
The left shoulder, head, and right shoulder are clearly visible, and the neckline is sitting around the $3,399–$3,400 zone. If price dips and retests this neckline, we could see a short-term bearish move toward the target of the head and shoulders around $3,399. This is a healthy pullback after the recent rally.
Bigger Picture (Wedge):
Even though we might see a short-term correction, the larger wedge breakout suggests continuation to the upside. The measured target of the wedge points toward $3,430, which lines up as the next resistance level.

XAUUSD Technical OutlookWhat I see!
XAUUSD Technical Daily Outlook
Gold (XAUUSD) is forming a falling wedge after the sharp drop from the 3,430s high - - a structure that often signals a potential bullish reversal.
Price is consolidating inside the wedge, rejecting from the Daily FVG while holding the H4 demand zone at 3,320. A break above the wedge trend-line could spark an impulsive move toward the 3,375 BSL, with further upside into 3,439 if liquidity is cleared.
The wedge has already completed five legs, adding confluence for a possible breakout soon. Conversely, failure to hold 3,320 may invite deeper retracement before bulls re-enter.
This chart is presented for educational discussion of market structure and technical patterns only. It is not a trade signal or financial advice.
Learn before earning!

Bitcoin Holds Above $113K but Faces Persistent Selling PressureBitcoin Holds Above $113K but Faces Persistent Selling Pressure
Bitcoin remains range-bound despite a positive start to the day, trading near $113,011, up 1.8% in the past 24 hours. Earlier this month, the leading cryptocurrency reached a record high above $124,000 on optimism about interest-rate cuts. Since then, it has pulled back but is attempting to rebound from recent lows around $110,000, as President Donald Trump increases pressure on the Federal Reserve to lower rates.
Lower interest rates typically boost demand for risk assets like cryptocurrencies and weaken the U.S. dollar, both factors supporting Bitcoin’s valuation.
Hyblock’s liquidation heatmap shows BTC absorbing bids in the $111,000–$110,000 range during the weekend sell-off, with another liquidity cluster near $104,000.
While a deeper drop toward $104K looks unlikely for now, institutional selling continues to outweigh retail demand, limiting upside potential. Traders seeking a consolidation phase should watch the anchored aggregated daily CVD for signs of easing sell pressure and shifting sentiment.

Gold Holds Near Highs, Wedge Pattern Signals Possible ShiftGold Holds Near Highs, Wedge Pattern Signals Possible Shift
XAUUSD remains in a bullish trend since August 22, now trading around $2,370, just below a two-week high. The price is forming a Wedge pattern, often signaling a potential reversal.
Analysts suggest monitoring key levels:
- Rebound from the upper edge or
- Break below the lower edge could trigger a Sell opportunity.
Markets currently price in an 80% probability of a Fed rate cut in September, supporting gold’s safe-haven appeal. Political uncertainty adds to the bullish tone after President Trump moved to oust Fed Governor Lisa Cook, raising concerns over central bank independence.
If political pressure on the Fed or trade tensions with India and China escalate, demand for gold could strengthen further.

XAUUSD rebounded from 3,310.00 support levelXAUUSD rebounded from 3,310.00 support level
Gold kept climbing on August 20, ending above $3,345 an ounce. That was thanks to the recent Fed meeting minutes and the weaker US dollar. It boosted global demand for gold, especially with expectations of a possible rate cut in September. The minutes from the last Fed meeting showed some bank officials were hesitant to cut rates, even though inflation was rising and there were concerns about the job market. But two governors didn't agree, which was the first time that had happened in over 30 years. Investors are now looking forward to what Fed Chair Jerome Powell has to say in Jackson Hole. They think there's an 85% chance of a rate cut in September, which is boosting confidence in gold's future.
During Asian and early European trading hours the price has been declining towards upper border of the falling wedge. Still, the continuation of the rise towards 3,380.00 is expected.

XAUUSD slided towards new support levelXAUUSD slided towards new support level
On August 20, gold prices plummeted to around 3,310.00, approaching a three-week low, as the easing of geopolitical tensions and the strengthening of the U.S. dollar exerted pressure on the metal ahead of the Federal Reserve's Jackson Hole symposium. Trump ruled out ground troops in Ukraine but suggested air support, while Zelenskiy hailed talks as a step toward peace with Putin. The focus is on the speech by Fed Chair Powell and the release of the FOMC minutes later today, which may provide insights into the central bank's policy decisions. The market anticipates two 25-basis-point rate cuts this year, potentially starting in September.
During Asian and early European trading hours today the price has been growing after a rebound from 3,310.00. Analysts expect the price to continue trading sideways within a range of 3,310.00 - 3,380.00 and move towards higher border of the range.

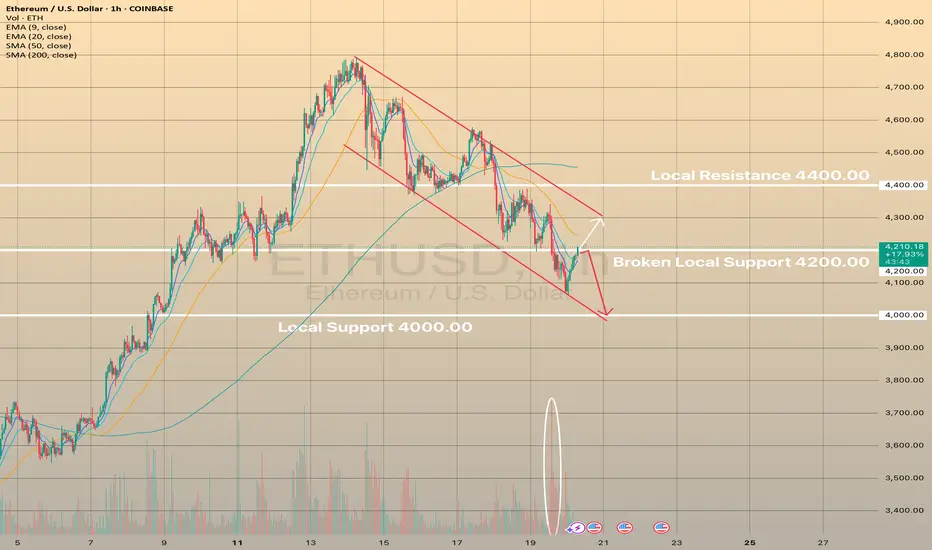
ETHUSD dropped below the support level of 4,200.00ETHUSD dropped below the support level of 4,200.00
On August 19 the asset dropped below 4,200.00 support level on an extremely high volume losing 5.55% as traders braced for Federal Reserve Chair Jerome Powell’s address at Jackson Hole. The drop follows a period of heavy profit-taking that gathered momentum after Ethereum’s sharp rally earlier this month. Liquidations also intensified during the downturn in the last 24 hours. Data from showed that more than 128,000 traders were wiped out in the past 24 hours, with total losses amounting to $450.7m.
The asset has been growing during Asian and early European trading hours today. If the asset fails to break through the 4,200.00 and hold above, the price may decline to the major support level of 4,000.00. Otherwise, the upside range is limited by the upper border of the descending channel.