What’s a Wedge Pattern?What's up traders! 👋
Wedge patterns are a powerful tool in technical analysis that can give you a heads-up about potential price moves. Whether you’re spotting a falling wedge or a rising wedge, these formations can reveal key signals about market direction.
What’s a Wedge Pattern?
A wedge pattern forms when price moves between two converging trendlines, creating a shape resembling a triangle. These patterns usually appear when the market is slowing down or consolidating before making a bigger move. Wedges can slope upwards or downwards, and the key difference lies in whether the trendlines are converging in an uptrend (rising wedge) or a downtrend (falling wedge).
Falling Wedge Pattern: Bullish Reversal 📈
The falling wedge pattern is a bullish reversal signal. This formation occurs when price moves between two downward-sloping trendlines, creating a series of lower highs and lower lows. The downward momentum weakens as the trendlines converge, indicating that sellers are losing strength, which sets up the potential for a bullish breakout.
How to Trade the Falling Wedge
Entry: Wait for the price to break above the upper trendline. This is your signal to enter long.
Target: Measure the height of the wedge at its widest point and project it upwards from the breakout point.
Stop Loss: Place it just below the most recent swing low to protect your position if the breakout doesn’t happen.
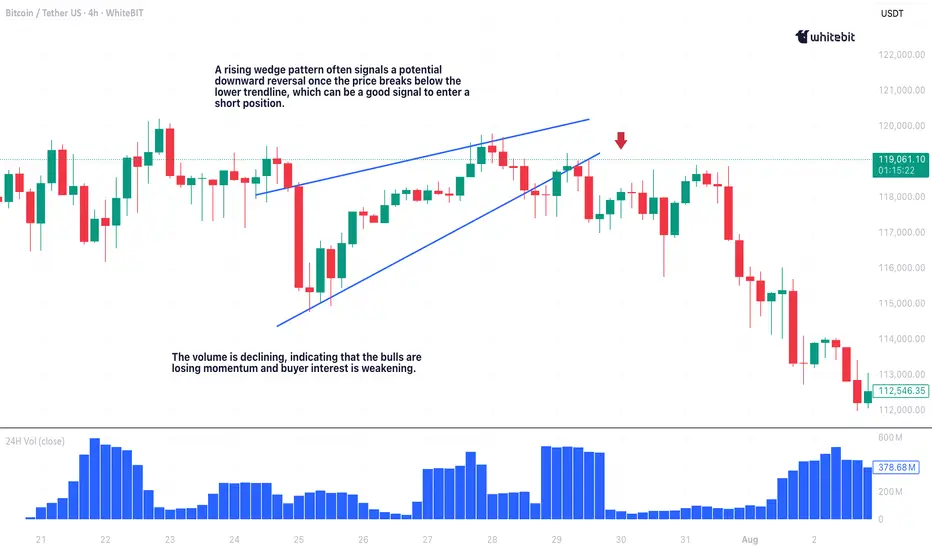
The chart illustrates a falling wedge pattern on the Bitcoin / Tether US pair with a 1-hour timeframe. Price action is contained within two converging downward-sloping trendlines, suggesting weakening bearish momentum. The breakout above the upper trendline signals a bullish reversal, and the subsequent uptick in price confirms the shift in momentum.
In rare cases, a breakout failure can lead to a bearish falling wedge pattern, but this scenario is less common. Keep an eye on the price action for signs of continued upward momentum.
Rising Wedge Pattern: Bearish Reversal 📉
The rising wedge pattern is a bearish reversal signal. This formation happens when price moves between two upward-sloping trendlines, creating higher highs and higher lows. The rising wedge indicates weakening buying pressure and a potential reversal to the downside.
How to Trade the Rising Wedge
Entry: Enter a short position once the price breaks below the lower trendline.
Target: Measure the height of the wedge and project it downward from the breakout point.
Stop Loss: Set it just above the most recent swing high to protect your trade.
Wedge Chart Pattern Trading: Key Tips ⚡
Context is everything when trading wedge patterns. If a bullish wedge pattern appears in an uptrend, it’s more likely to break to the upside. If a bearish wedge shows up in a downtrend, expect a breakdown.
Here are a few quick tips to improve your wedge trading pattern game:
Trendlines are key: Ensure your trendlines are drawn accurately. Properly drawn trendlines lead to better trades.
Breakout confirmation: Confirm breakouts with increased volume and, ideally, by checking for confluence with other indicators like RSI or MACD. A breakout without volume is often a false signal.
Risk management: Always use a stop loss to protect your capital.
Use other indicators: Wedge patterns work well with additional tools such as RSI, moving averages, or MACD. The more confluence, the better!
Final Thoughts 🏁
Wedge patterns, whether it’s the falling wedge pattern signaling a bullish reversal or the rising wedge pattern trading indicating bearish pressure, are some of the most reliable chart formations out there. But remember: no setup is perfect, so always use a stop loss and never rely on a single indicator.
With practice, you’ll get better at spotting these setups and timing your entries and exits like a pro. Happy trading, and may the charts be in your favor! 💰📊
Wedgepatterns
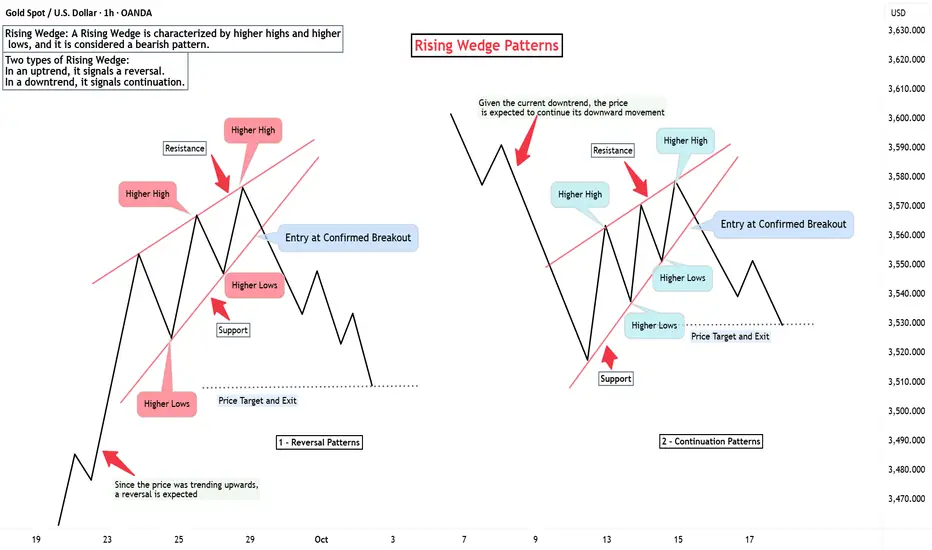
Exploring the Two Variations of the Rising Wedge PatternHello everyone!
When I first started learning technical analysis, one of the patterns I found incredibly interesting and important was the Rising Wedge pattern. This pattern is formed when the price creates higher highs and higher lows, but the price range gradually narrows. However, there’s something that few people know – the Rising Wedge pattern can appear in two different forms, and each form has significant implications for predicting market trends.
Form 1: Rising Wedge in an Uptrend (Reversal)
The first and most common form of the Rising Wedge is when it appears in an uptrend. This pattern signals that the uptrend is losing momentum. When I identify this pattern, I know the market is weakening and is likely to reverse into a downtrend.
Characteristics: The price creates higher highs and higher lows, but the range of price movement narrows, and trading volume typically decreases.
Confirmation: A breakout below the support at the bottom of the Rising Wedge confirms a trend reversal.
When this pattern forms, I prepare to enter a short trade when the price breaks the support at the bottom of the pattern. This is when the market could start to reverse and move downward.
Form 2: Rising Wedge in a Downtrend (Continuation)
The second form of the Rising Wedge appears in a downtrend. Although it may look similar to the first form, its purpose is different. This pattern does not signal a reversal, but instead indicates that the downtrend will continue after the price breaks below the bottom of the pattern.
Characteristics: Similar to the pattern in the uptrend, the price also creates higher highs and higher lows, but the price narrowing occurs within a downtrend.
Confirmation: Once the price breaks below the bottom of the pattern, it is expected to continue the strong downward movement.
In this case, I do not rush to enter a buy trade because this pattern signals that the downtrend is still strong. After the price breaks below the bottom of the pattern, I will consider entering another short trade.
In Summary
The Rising Wedge pattern is an incredibly useful tool for technical analysis to identify changes in price trends. Whether in an uptrend or downtrend, this pattern can provide great trading opportunities if you know how to identify and act on it promptly.
In an uptrend: The Rising Wedge signals weakness and a potential reversal.
In a downtrend: The Rising Wedge signals the continuation of the downward trend.
Understanding these two forms helps me make more accurate trading decisions and manage risk more effectively in any market condition.
Wedge Pattern: A Key to Trend Reversals and Continuations📈 Wedge Pattern: A Key to Trend Reversals and Continuations
A wedge pattern is a technical chart formation that signals a potential reversal or continuation in the market. It’s formed when price moves between two converging trendlines — either sloping upward or downward — creating a narrowing range over time.
There are two main types of wedge patterns:
🔻 Falling Wedge (Bullish)
Formed during a downtrend or as a correction in an uptrend.
Characterized by lower highs and lower lows, with the slope of the support line steeper than the resistance line.
Typically signals a bullish reversal as momentum builds for a breakout to the upside.
✅ Confirmation: Break above the resistance line with volume surge.
🔺 Rising Wedge (Bearish)
Appears during an uptrend or as a correction in a downtrend.
Shows higher highs and higher lows, but the support line is steeper than the resistance line.
Often leads to a bearish reversal, especially when volume declines into the pattern.
⚠️ Confirmation: Break below the support line with increasing volume.
🧠 Key Characteristics
Volume tends to decrease as the pattern forms, indicating a pause in momentum.
The breakout direction (up or down) determines whether it’s a continuation or reversal signal.
Wedges can appear on any time frame and are useful for both day traders and long-term investors.
📊 Trading Tip
Always wait for confirmation of the breakout before entering a trade. False breakouts can be common, especially in low-volume environments

Wedge Pattern — A Key to Trend Movements📐 Wedge Pattern — A Key to Trend Movements 📈
🔍 Introduction
The Wedge is a chart pattern that represents a phase of directional consolidation following a trending move. It can act as a continuation 🔄 or a reversal 🔃 signal, depending on the context. The structure consists of two converging trendlines, both sloping in the same direction.
🧩 Pattern Description
Unlike the Flag pattern 🚩, the Wedge has no flagpole and doesn’t depend on the direction of the previous move. The direction of the wedge body determines its type:
A falling wedge ⬇️ is bullish 🟢 (buy signal)
A rising wedge ⬆️ is bearish 🔴 (sell signal)
The breakout is the key point to watch. The two trendlines slope in the same direction but at different angles, causing them to converge. This reflects a loss of momentum ⚠️ and typically indicates that buyers or sellers are preparing to take control.
This pattern can act as:
A continuation signal 🧭 — appearing at the end of a correction
A reversal signal 🔄 — forming at the end of a strong trend
📉 Volume is usually low during the wedge and rises on breakout. A low-volume breakout increases the risk of a false breakout ❗. Often, price retests the breakout level 🔁, giving traders a second chance to enter.
🎯 Entry & Stop-Loss Strategy
📥 Entry: On breakout confirmation
🛑 Stop-loss: Below the pattern’s low (bullish) or above its high (bearish), or under/above the most recent local swing point
🎯 Target: Project the height of the widest part of the wedge from the breakout point. Alternatively, use key price levels 📊 or a trailing stop 🔂 to lock in profits.
💡 My Pro Tips for Trading the Wedge
✅ Pattern Criteria
Two converging trendlines ➡️➕➡️
Clearly defined structure ✏️
Prior trending move before the wedge 🚀
Low volume within the wedge 📉, high volume on breakout 📈
Retest of breakout level = confirmation 🔁
🔥 Factors That Strengthen the Signal
Breakout on strong volume 📊💥
Appears after an extended trend 🧭📉📈
More touches = stronger pattern ✍️
Breakout occurs close to the apex 🎯
⚠️ Factors That Weaken the Signal
Low volume on breakout 😐
Poorly defined trendlines 🫥
Few touches on lines
Early breakout (too far from apex) ⏱️
No prior trend / appears in a range-bound market 📏
✅ Examples of My Successful Wedge Trades
📸
❌Examples of Failed Wedge Overview
💥
💬 Do you use the wedge pattern in your trading?
It’s a powerful pattern, especially when confirmed by volume and market structure. Share your favorite wedge setups or ask questions below 👇👇
Understanding Wedge Patterns - A Real Bitcoin Case Study🎓📊 Understanding Wedge Patterns - A Real Bitcoin Case Study 🧠📈
Hi everyone, FXPROFESSOR here 👨🏫
From this moment forward, I will no longer be posting targets or trade setups here on TradingView. Instead, I’ll be focusing 100% on education only for here in Tradinfview.
Why? Because over time I’ve learned that even when traders receive the right charts, most still struggle to trade them effectively. So, from now on, FX Professor Crypto content here will be strictly educational — designed to teach you how to read and react to the markets like a professional. Unfortunately I cannot be posting on Tradingview frequent updates like I do all day. Education is always better for you guys. And i am very happy to share here with you what matters the most.
🧩 In today’s post, we dive into one of the most misunderstood formations: the wedge pattern.
Most resources show wedges breaking cleanly up or down — but real price action is messier.
🎥 I recorded a video a few days ago showing exactly how BTC respected a wedge formation.
⚠️ Note: Unfortunately, TradingView doesn’t play the audio of that clip — apologies that you can’t hear the live commentary — but the visuals are clear enough to follow the logic. (there is no advertising of any kind on the video so i hope i don't get banned again - i did make a mistake the last time and will avoid it-the community here is awesome and needs to stay clean and within the rules of TV).
Here’s what happened:
🔸 A clean wedge formed over several days
🔸 We anticipated a fake move to the downside, grabbing liquidity
🔸 BTC rebounded off support around a level marked in advance
🔸 Then price re-entered the wedge, flipping support into resistance
The lesson?
📉 Often price will exit the wedge in the wrong direction first — trapping retail traders — before making the real move. This is a classic liquidity trap strategy, exercised by the 'market'.
💡 Remember:
Wedges often compress price until it "runs out of space"
The initial breakout is often a trap
The true move tends to come after liquidity is taken
The timing of the 'exit' has a lot to do with the direction. In the future we will cover more examples so pay attention.
I stayed long throughout this move because the overall market context remained bullish — and patience paid off.
Let this be a reminder: it’s not about guessing the direction — it’s about understanding the mechanics.
More educational breakdowns to come — keep learning, keep growing.
One Love,
The FX PROFESSOR 💙
Disclosure: I am happy to be part of the Trade Nation's Influencer program and receive a monthly fee for using their TradingView charts in my analysis. Awesome broker, where the trader really comes first! 🌟🤝📈

Trading Divergences With Wedges in ForexTrading Divergences With Wedges in Forex
Divergence trading in forex is a powerful technique for analysing market movements, as is observing rising and falling wedges. This article explores the synergy between divergence trading and wedges in forex, offering insights into how traders can leverage these signals. From the basics to advanced strategies, learn how you could utilise this approach effectively, potentially enhancing your trading skills in the dynamic forex market.
Understanding Divergences
In forex trading, the concept of divergence plays a pivotal role in identifying potential market shifts. A divergence in forex, meaning a situation where price action and a technical indicator like the Relative Strength Index (RSI) or Moving Average Convergence Divergence (MACD) move in opposite directions, often signals a weakening trend. This discrepancy is a valuable tool in divergence chart trading, as it may indicate a possible reversal or continuation of the current trend.
There are two primary types of divergence in forex—regular and hidden. Regular divergence occurs when the price makes higher highs or lower lows while the indicator does the opposite, often signalling a reversal. Hidden divergence, on the other hand, happens when the price makes lower highs or higher lows while the indicator shows higher highs or lower lows, typically suggesting a continuation of the current trend.
Trading Rising and Falling Wedges
Rising and falling wedges are significant patterns in forex trading, often signalling potential trend reversals. A rising wedge, formed by converging upward trendlines, often indicates a bearish reversal if it appears in an uptrend. Conversely, a falling wedge, characterised by converging downward trendlines, typically reflects a bullish reversal if it occurs in a downtrend.
Traders often look for a breakout from these patterns as a signal to enter trades. For rising wedges, a downward breakout can be seen as a sell signal, while an upward breakout from a falling wedge is often interpreted as a buy signal. When combined with divergences, this chart pattern can add confirmation and precede strong movements.
Best Practices for Trading Divergences
Trading divergence patterns in forex requires a keen eye for detail and a disciplined, holistic approach. Here are key practices for effective trading:
- Comprehensive Analysis: Before trading on divergence and wedges, be sure to analyse overall market conditions.
- Selecting the Right Indicator: Choose a forex divergence indicator that suits your trading style. Common choices include RSI, MACD, and Stochastic.
- Confirmation Is Key: It’s best to watch for additional confirmation from price action or other technical tools before entering a trade.
- Risk Management: Traders always set stop-loss orders to manage risk effectively. Divergence trading isn't foolproof; protecting your capital is crucial.
- Patience in Entry and Exit: Be patient as the divergence develops and confirm with your chosen indicators before entering or exiting a trade.
Strategy 1: RSI and Wedge Divergence
Traders focus on regular divergence patterns when the RSI is above 70 (overbought) or below 30 (oversold), combined with a rising or falling wedge pattern. The strategy hinges on identifying highs or lows within these RSI extremes. It's not crucial if the RSI remains consistently overbought or oversold, or if it fluctuates in and out of these zones.
Entry
- Traders may observe a regular divergence where both the price highs/lows and RSI readings are above 70 or below 30.
- After the formation of a lower high (in an overbought zone) or a higher low (in an oversold zone) in the RSI, traders typically watch as the RSI crosses back below 70 or above 30. This is accompanied by a breakout from a rising or falling wedge, acting as a potential signal to enter.
Stop Loss
- Stop losses might be set just beyond the high or low of the wedge.
Take Profit
- Profit targets may be established at suitable support/resistance levels.
- Another potential approach is to exit when the RSI crosses back into the opposite overbought/oversold territory.
Strategy 2: MACD and Wedge Divergence
Regarded as one of the best divergence trading strategies, MACD divergence focuses on the discrepancy between price action and the MACD histogram. The strategy is particularly potent when combined with a rising or falling wedge pattern in price.
Entry
- Traders typically observe for the MACD histogram to diverge from the price. This divergence manifests as the price reaching new highs or lows while the MACD histogram fails to do the same.
- The strategy involves waiting for the MACD signal line to cross over the MACD line in the direction of the anticipated reversal. This crossover should coincide with a breakout from the rising or falling wedge.
- After these conditions are met, traders may consider entering a trade in anticipation of a trend reversal.
Stop Loss
- Stop losses may be set beyond the high or low of the wedge, which may help traders manage risk by identifying a clear exit point if the anticipated reversal does not materialise.
Take Profit
- Profit targets might be established at nearby support or resistance levels, allowing traders to capitalise on the expected move while managing potential downside.
Strategy 3: Stochastic and Wedge Divergence
Stochastic divergence is a key technique for divergence day trading in forex, especially useful for identifying potential trend reversals. This strategy typically employs the Stochastic Oscillator with settings of 14, 3, 3.
Entry
- Traders may look for divergence scenarios where the Stochastic readings are above 80 or below 20, mirroring the RSI approach.
- This divergence is observed in conjunction with price action, forming a rising or falling wedge.
- Entry may be considered following a breakout from the wedge, which signals a potential shift in market direction.
Stop Loss
- Setting stop losses just beyond the high or low of the wedge might be an effective approach.
Take Profit
- Profit targets may be set at key support/resistance levels.
The Bottom Line
Divergence trading, coupled with the analysis of rising and falling wedges, offers a comprehensive approach to navigating the forex market. By integrating the discussed strategies with sound risk management and market analysis, traders may potentially enhance their ability to make informed decisions in the dynamic world of forex.
This article represents the opinion of the Companies operating under the FXOpen brand only. It is not to be construed as an offer, solicitation, or recommendation with respect to products and services provided by the Companies operating under the FXOpen brand, nor is it to be considered financial advice.

Wedge Pattern – Simple Explanation
📚 Wedge Pattern – Simple Explanation
A wedge pattern is a shape on the chart that looks like a triangle or cone. It tells us that the price is getting ready to break out — either up or down.
---
🔻 Falling Wedge (Bullish)
Looks like price is going down, but slowly.
Lines move closer together.
Usually means the price will go up soon.
It's a bullish signal (good for buying).
---
🔺 Rising Wedge (Bearish)
Price goes up, but losing strength.
Lines get closer together.
Usually means the price will go down soon.
It's a bearish signal (good for selling).
---
💡 Easy Tips:
Wait for breakout (big move out of the wedge).
Use a stop-loss below/above the pattern.
Target = height of the wedge.
---
📌 In Short:
Wedge = Squeeze pattern.
Falling wedge = Buy chance.
Rising wedge = Sell chance.
---
Let me know if you have sny doubt in comments

Ultimate Guide to Mastering Chart PatternsChart patterns are essential tools for traders looking to identify high-probability setups based on price action. Among the most reliable continuation and reversal patterns are triangles, wedges, and flags. These formations help traders anticipate market direction and make informed decisions based on breakout potential, trend strength, and volume confirmation.
In this guide, we’ll explore the key characteristics, trading strategies, and confirmation techniques for each of these patterns to improve trade execution and risk management.
Triangle Patterns
Types of Triangle Patterns
Triangles are consolidation patterns that indicate a period of indecision before price continues in the direction of the breakout. There are three main types of triangle patterns:
Ascending Triangle – A bullish continuation pattern where the price forms higher lows while resistance remains flat.
Descending Triangle – A bearish continuation pattern where the price forms lower highs while support remains flat.
Symmetrical Triangle – A neutral pattern where price forms lower highs and higher lows, squeezing into an apex before breaking out.
How to Trade Triangles
Identify the Triangle Formation: Look for at least two touchpoints on each trendline (support and resistance) to confirm the pattern.
Wait for Breakout Confirmation: The price should break above resistance (bullish) or below support (bearish) with strong volume.
Set Entry & Stop-Loss Levels: Enter the trade after a candle closes beyond the breakout point. Set a stop-loss below the most recent swing low (for bullish trades) or above the swing high (for bearish trades).
Measure Target Price: The expected move is typically equal to the height of the triangle measured from the widest part of the pattern.
Wedge Patterns
Types of Wedge Patterns
Wedges are similar to triangles but are characterized by sloping trendlines that converge in the same direction. They indicate a potential trend reversal or continuation depending on the breakout direction.
Rising Wedge – A bearish reversal pattern that forms during uptrends. The price makes higher highs and higher lows, but the slope narrows, signaling weakening momentum before a breakdown.
Falling Wedge – A bullish reversal pattern that forms during downtrends. The price makes lower highs and lower lows within a narrowing channel before a breakout to the upside.
How to Trade Wedges
Identify the Wedge Pattern: Look for a contracting price range within two sloping trendlines.
Watch for a Breakout: The price should break either above (for falling wedges) or below (for rising wedges) with increasing volume.
Confirm the Breakout: Use additional indicators such as RSI divergence or moving average crossovers to validate the move.
Set Entry, Stop-Loss, and Target: Enter after the breakout candle closes beyond the trendline, with a stop-loss outside the opposite side of the wedge. Target the height of the wedge projected from the breakout point.
Flag Patterns
Characteristics of Flag Patterns
Flag patterns are continuation patterns that occur after a strong impulsive move (flagpole), followed by a period of consolidation (flag) before price resumes the trend. Flags can be classified as:
Bullish Flag – Forms after a strong upward move, followed by a downward-sloping consolidation.
Bearish Flag – Forms after a strong downward move, followed by an upward-sloping consolidation.
How to Trade Flag Patterns
Identify the Flagpole: Look for a sharp price move in one direction, which forms the base of the flag.
Confirm the Flag Formation: Price consolidates within parallel trendlines that slightly slope against the prior trend.
Wait for the Breakout: Enter when price breaks out of the flag pattern in the direction of the previous trend with strong volume.
Measure Target Price: The price target is typically equal to the length of the flagpole projected from the breakout point.
Set Stop-Loss: Place the stop-loss below the lower boundary of the flag (for bullish flags) or above the upper boundary (for bearish flags).
Common Mistakes & How to Avoid Them
Trading Before Confirmation: Many traders enter too early without waiting for a breakout confirmation, leading to false signals.
Ignoring Volume: Breakouts should be accompanied by a volume surge for validation; weak volume can indicate a fake breakout.
Setting Tight Stop-Losses: Giving the trade enough room to breathe by placing stops outside key support/resistance levels prevents getting stopped out prematurely.
Forgetting to Manage Risk: Always follow proper risk-reward ratios (at least 1:2) to ensure profitable long-term trading.
Final Thoughts
Triangle, wedge, and flag patterns are powerful tools for traders who understand their structure and breakout behavior. By combining these patterns with volume analysis, trend confirmation indicators, and proper risk management, traders can increase their chances of success. Whether you're trading stocks, forex, or crypto, mastering these patterns will enhance your ability to navigate the markets efficiently.
__________________________________________
Thanks for your support!
If you found this guide helpful or learned something new, drop a like 👍 and leave a comment, I’d love to hear your thoughts! 🚀
Make sure to follow me for more price action insights, free indicators, and trading strategies. Let’s grow and trade smarter together! 📈

Uptrend & Downtrend Bullish Falling Wedge Pattern TutorialA bullish falling wedge is a charting pattern that signals a potential reversal from a downtrend to an uptrend. Here's a breakdown of its key characteristics:
Shape: The pattern forms a wedge that slopes downward, with the upper trendline connecting the highs and the lower trendline connecting the lows. The key is that the highs and lows get closer together as the pattern develops.
Trend: It typically forms during a downtrend, indicating that selling pressure is decreasing.
Breakout: The pattern is bullish when the price breaks above the upper trendline. This breakout suggests that the downward trend is losing momentum, and an upward trend may follow.
Volume: During the falling wedge formation, volume tends to decrease, which supports the idea that selling pressure is diminishing.
Retest: After the breakout, it's common for the price to retest the upper trendline, and if it holds, it provides further confirmation of the bullish reversal.
Example
Imagine a stock that has been falling for several months. The price forms lower highs and lower lows, creating a narrowing wedge. Suddenly, the price breaks above the upper trendline with increased volume, signaling a potential reversal and the start of an upward trend.

Harmonics don't work...Here's how I find my set ups I thought I'd share with you guys the process I use to find my shark setups, this is a strategy I've back-tested and tested several times. I must say textbook harmonic talk poop, the values I use work but the set-up I see written for the shark uses different values. I noted this and thought about it for a minute - then I said so can I break the rules or amend it, because what I see is making sense but following the book is frustrating me lol...
I mean it got through to me through multiple accounts including personal and funded accounts - (side note I'm not rich) hopefully this helps to to understand how I spot moves.
As long as you journal then you have a chapter to start from and that 1!!!!!

Learn to identify some useful Chart patterns, Merry Christmas🎄 Unlocking the Secrets of Chart Patterns: Navigating Market Trends 📈
Season's Greetings to all our readers! As we celebrate the spirit of the holidays, let's delve into the fascinating world of financial markets. In our journey to understand and navigate the complexities of trading and investing, we've touched upon essential chart patterns that can serve as invaluable guides for market enthusiasts.
In the midst of the festive cheer, let's revisit some of these powerful indicators: the Double Bottom, Flag and Pole, Bullish Pennant, Rising Wedge, Falling Wedge, Triple Top, and Inverted Head and Shoulders. Understanding these patterns can be akin to unwrapping gifts of insight into potential market movements.
So, grab a cup of cocoa, settle into your favorite chair, and join us as we explore the significance of these chart patterns and share practical tips on incorporating stop-loss strategies to enhance your trading toolkit.
Wishing you a Merry Christmas filled with joy, warmth, and prosperous insights in the financial markets! 🎅🎁🚀
Double Bottom:
Description: Imagine a smiley face turned upside down. A double bottom is a chart pattern that looks like two rounded troughs (bottoms) next to each other.
Interpretation: Indicates a possible reversal of a downtrend. The price has tried to go down twice but failed, suggesting a potential upward movement.
Stop-Loss Tip: One can place a stop-loss slightly below the lowest point of the double bottom. If the price falls below this level, it may invalidate the pattern.
Flag and Pole:
Description: Think of a flag on a flagpole. The "pole" is a strong, quick price movement, and the "flag" is a rectangular-shaped consolidation pattern.
Interpretation: The flag and pole pattern often signals a continuation of the previous trend. The flag represents a brief pause before the price resumes its original direction.
Stop-Loss Tip: One should set a stop-loss just below the lower end of the flag. If the price drops below this level, it might suggest a reversal of the trend.
Bullish Pennant:
Description: Similar to the flag and pole but with a small symmetrical triangle (pennant) instead of a rectangle.
Interpretation: Indicates a temporary consolidation after a strong upward movement. It suggests that the bullish trend might continue after the brief pause.
Stop-Loss Tip: Place a stop-loss under the lower trendline of the pennant. A break below this line could signal a potential trend reversal.
Rising Wedge:
Description: Picture a triangle with its top side steeper than the bottom side. The price makes higher highs and higher lows but in a narrowing range, with indicator making Lower Highs (Bearish Divergences).
Interpretation: This pattern can indicate a potential reversal to the downside. It suggests that the buying interest is weakening, and the price may soon decline.
Stop-Loss Tip: Place a stop-loss just above the last price swing high of the wedge. If the price drops below this line, it may suggest a potential reversal.
Falling Wedge:
Description: Similar to the rising wedge but inverted. The top side is less steep than the bottom side.
Interpretation: Represents a potential reversal to the upside. It suggests that selling pressure is weakening, and the price may be ready to move higher.
Stop-Loss Tip: Place a stop-loss just below the last price swing low of the wedge. If the price drops below this line, it may suggest a potential reversal.
Triple Top:
Description: Visualize a horizontal line touching the tops of three consecutive peaks.
Interpretation : Indicates a possible reversal of an uptrend. The price has failed to break above a certain level three times, suggesting a potential downturn.
Stop-Loss Tip: One should set a stop-loss slightly above the highest point of the triple top. If the price rises above this level, it may negate the pattern.
Inverted Head and Shoulders:
Description: Picture three troughs, where the middle one (head) is lower than the two on either side (shoulders).
Interpretation: This pattern suggests a potential reversal from a downtrend to an uptrend. It signifies a shift in momentum from bearish to bullish.
Stop-Loss Tip: One should place a stop-loss just below the neckline (the line connecting the highs of the pattern). If the price falls below this line, it might indicate a failed reversal.
I am not Sebi registered analyst. My studies are for educational purpose only.
Please Consult your financial advisor before trading or investing. I am not responsible for any kinds of your profits and your losses.
Most investors treat trading as a hobby because they have a full-time job doing something else.
However, If you treat trading like a business, it will pay you like a business.
If you treat like a hobby, hobbies don't pay, they cost you...!
Hope this post is helpful to community
Thanks
RK💕
Disclaimer and Risk Warning.
The analysis and discussion provided on in.tradingview.com is intended for educational purposes only and should not be relied upon for trading decisions. RK_Charts is not an investment adviser and the information provided here should not be taken as professional investment advice. Before buying or selling any investments, securities, or precious metals, it is recommended that you conduct your own due diligence. RK_Charts does not share in your profits and will not take responsibility for any losses you may incur. So Please Consult your financial advisor before trading or investing.

Rising and Falling Wedges ExplainedWelcome to the world of trading patterns. If you appreciate our charts, give us a quick 💜💜
Today, we'll explore two important ones: the Rising Wedge and the Falling Wedge . These patterns can signal shifts in market trends. Let's dive in and see how they work.
Rising Wedge:
In an uptrend, the Rising Wedge hints at a bearish turn. It takes shape as prices find a middle ground between two upward-sloping lines, one as support and the other as resistance, both inching closer. As the price inches towards the wedge's tip, its upward push tends to fade, suggesting a potential shift to a downward trend.
Your sell signal triggers with a bearish break beneath the wedge's support.
Set a stop loss just above the wedge's highs.
Aim for the next significant support level.
Falling Wedge:
Unlike the Rising Wedge, the falling wedge spells optimism in a downtrend. It emerges as prices consolidate between two downward-sloping lines, one providing support and the other resistance, both drawing nearer. As prices approach the wedge's apex, the downward momentum loses steam, hinting at a potential shift towards an upward trend.
Your buy signal activates with a bullish breakout beyond the wedge's resistance.
Place a stop loss just below the wedge's lows.
Target the next notable resistance.
Feel free to let us know your thoughts and if you have any questions. Your feedback is valuable and helps us improve. Happy trading!

Wealth Unleashed: Wedge Pattern Power - Hidden Gem Revealed!Introduction:
Are you looking to skyrocket your trading profits? Look no further! Today, we will uncover the hidden gem of trading patterns: the Wedge Pattern. This powerful tool has the potential to transform your trading strategy and help you achieve financial success. Let's dive into the world of wedge patterns and explore how you can capitalize on their power.
What are Wedge Patterns?
Wedge patterns are popular among traders due to their high probability of forecasting trend reversals. These patterns appear when the price of an asset consolidates between converging support and resistance lines. There are two primary types of wedge patterns: the rising wedge and the falling wedge.
Rising Wedge:
In an upward trend, the rising wedge is considered a bearish pattern. It forms when the price consolidates between an upward-sloping support line and an upward-sloping resistance line that are converging. As the price approaches the apex of the wedge, the upward momentum weakens, signaling a potential trend reversal to the downside.
Falling Wedge:
Contrary to the rising wedge, the falling wedge is a bullish pattern. It appears in a downward trend when the price consolidates between a downward-sloping support line and a downward-sloping resistance line that are converging. As the price nears the apex of the wedge, the downward momentum loses strength, indicating a possible trend reversal to the upside.
Trading Strategies:
To capitalize on the power of wedge patterns, follow these steps:
✅Identify the pattern: Observe the chart for converging support and resistance lines to spot a rising or falling wedge pattern.
✅Confirmation: Wait for a breakout from the wedge pattern, either above the resistance line (for falling wedges) or below the support line (for rising wedges).
✅Entry point: Open a long position after a breakout above the resistance line in a falling wedge, or a short position after a breakout below the support line in a rising wedge.
✅Stop-loss and take-profit: Set your stop-loss order below the breakout level (for falling wedges) or above the breakout level (for rising wedges). Establish your take-profit target at a level that aligns with your risk-reward ratio and trading plan.
Conclusion:
The wedge pattern is a hidden gem that can potentially boost your trading profits when used correctly. By mastering the art of identifying and trading wedge patterns, you can strengthen your technical analysis skills and increase your chances of success in the market. Remember, no single tool guarantees success, so always use additional technical indicators and maintain a disciplined approach to risk management. Happy trading!

📈 4 Common Bullish Patterns🟢 RISING THREE
"Rising three methods" is a bullish continuation candlestick pattern that occurs in an uptrend and whose conclusion sees a resumption of that trend.
This can be contrasted with a falling three method. The first bar of the pattern is a bullish candlestick with a large real body within a well-defined uptrend.
🟢 FALLING WEDGE
The falling wedge pattern occurs when the asset’s price is moving in an overall bullish trend before the price action corrects lower.
Within this pull back, two converging trend lines are drawn. The consolidation part ends when the price action bursts through the upper trend line, or wedge’s resistance.
🟢 BULL PENNANT
A pennant is a type of continuation pattern formed when there is a large movement in a security, known as the flagpole, followed by a consolidation period with converging trend line.
Pennants, which are similar to flags in terms of structure, have converging trend lines during their consolidation period and last from one to three weeks.
🟢 ASCENDING TRIANGLE
An ascending triangle is a chart pattern used in technical analysis. It is created by price moves that allow for a horizontal line
to be drawn along the swing highs and a rising trendline to be drawn along the swing lows. The two lines form a triangle.
Traders often watch for breakouts from triangle patterns. The breakout can occur to the upside or downside
👤 @AlgoBuddy
📅 Daily Ideas about market update, psychology & indicators
❤️ If you appreciate our work , Please like, comment and follow ❤️

Forget about chart patterns! Hello, my dear friends and happy New Year!
I wish you to be healthy and reach all your goals in trading and not only! Never give up on this difficult way which we are going to overcome together!
Today we have a very important topic. How to use Elliott waves instead of classical chart patterns. This is the natural exposure why the chart patterns are garbage. I remember my third year at university when we have the trading lessons. Our teacher gave us a lot of useless knowledges about support, resistance and chart patterns. I have not understood why it should working and it was not soo intereting subject for me. That’s why I returned back to trading much later using self-education. Now I have the clear understanding why Elliott waves is the best tool and why it’s working. Most of traders even don’t understand that chart patterns is just the special case of Elliott waves. That’s why today I decided to explain you how you can change the first one to the second one. Let’s go!
Double Top(Bottom)
On the chart above I drew the different types of double tops. Generally we have 3 types of this pattern
Double top with the second top higher than the first one. In this case we can interpret it in two ways. It could be the classical waves 3, 4, 5 and the corrective wave A at the ending stage. In this case we can anticipate waves B and C. Also it could be the irregular correcton ABC inside wave 4 (rarely in wave 2). In this case we should wait for the wave 5 after that. Traders usually execute short position on the neckline breakdown and suffer when the wave 5 smashed their stop-loss. They are wondering why double top does not working.
Double top with the equal highs has the same possible outcomes. The only one difference that correction called flat instead of irregular.
Double top with the second top lower than the first one. Here is the most common variant is the end of the ABC correction. In this case we have the low potential for shorting the market becuase the new impulsive wave to the upside can hit all stop losses.
Head & Shoulders
This is the easiest pattern for analysis. The right sholder usually is the wave 4, the head, obviously is the wave 5 and the right shoulder is the wave B. On the neckline breakdown we have the shorting potential only in the rest part of the wave C. You could correctly count waves and short that the bearish reversal bar of the wave 5 or, as a last resort, at wave B potential top. Shorting at the neckline has sence only if you are sure that the wave B was the the wave 1 of the impulsive wave to the downside if higher degree and now the market is in wave 3. We have to learn how to count waves in a correct way. I would recommend you to read the Trading Chaos book by Bill Williams because it has the best explanation how do waves work.
Triangles and Wedges
This part is common for all types of triangles (ascending, descending, symmetrical) and wedges (falling and rising). This patterns have the similar structure. If we faced with one of these patterns we have 4 possible scenarios.
Triangle in the downtrend after the wave 3. In this case triangle is the wave 4, which is represented as the triangle correction. This correction type consists of 5 waves A, B, C, D and E. When the wave E is finished market will continue it’s move in the direction of a trend, printing the wave 5.
The same, but in the uptrend.
When the market showed us the 5 waves cycle to the upside and the correction is in progress. Triangle can appears in the wave B. In this case the price will continue the corrective move in the wave C after it’s finished.
The same with the downtrend.
Guys, of course there are much more types of chart patterns. For example, tripple tops and bottoms and so on. The purpose of this article is giving you another view of the market structure and to motivate you studying the Elliott waves theory. Believe me, it has much more potential than it seems on the first glimplse.
Best regards, Ivan
________________________________________________________________________________________________
If you like my educational ideas, please smash the boost button to stimulate me make more quality articles!

Learn How to Trade Wedge Pattern Formation | Full Guide 📚
Learn my wedge pattern trading strategy.
In this video you will learn:
How to spot the pattern
Meaning of the pattern
Trading entries
Stop loss
Take profit
Real market example
❤️Please, support this video with like and comment!❤️

Learn How to Trade Wedge Patter | Full Strategy Explained 📚
Hey traders,
In this video, you will learn how to trade wedge pattern.
We will discuss the theoretical basics of this pattern.
Then, on a real market example, I will show you how to spot and trade it.
❤️Please, support this video with like and comment!❤️

Broadening Wedges - Advanced AnalysisIn our previous post in this series about chart patterns we described the characteristics, rules, and causes of triangle patterns (if you haven't seen it, see the related idea below).
In this post, we perform an advanced analysis of broadening wedges patterns. We provide a description of each pattern and its implications. We also review the literature in order to find their deterministic cause.
1. Broadening Wedges
Broadening wedges are characterized by price variations laying within one support and resistance, both having the same direction and broadening over time. As such the apex of the support/resistance in a broadening wedge is located to the left.
Broadening wedges must not be confused with other broadening formations. While they all have a broadening characteristic they can have different identification rules
Broadening wedges are classified depending on the direction of the support/resistance.
1.1 Ascending
Ascending broadening wedges mostly occur during uptrends with rising local maxima (higher highs) forming an upward sloping resistance and raising local minimas (higher lows) forming an upward slopping support. The slope of both the support & the resistance should be significantly different from 0.
Bulkowski suggests the price needs to test the support and resistance three times each. Additionally, the resistance should be steeper than the support.
Volume tends to increase during the formation of such pattern.
Ascending broadening wedges have a bearish bias with breakouts mostly occurring downward. Downward breakouts are often followed by a decrease in price.
Example of an ascending broadening wedge followed by a downward breakout on SOLUSDT 4h.
1.2 Descending
Descending broadening wedges mostly occur during downtrends with declining local maxima (lower highs) forming a downward sloping resistance and declining local minimas (lower lows) forming a downward slopping support. The slope of both the support & the resistance should be significantly different from 0.
Similarly to ascending broadening wedges, Bulkowski suggests the price needs to test the support and resistance three times each. Additionally, the support should be steeper than the resistance.
Volume tends to increase during the formation of such pattern.
Descending broadening wedges have a bullish bias with breakouts mostly occurring upward. Upward breakouts are often followed by an increase in price.
Example of an ascending broadening wedge followed by a downward breakout on AVAX 1h.
2. Partial Rises/Declines
Partial rises/declines are phenomena described by Bulkowski in broadening formations and are described as being common. Partial rises/declines often indicate the direction of a breakout.
Partial rises commonly occur in broadening ascending wedges, price bounces off the support, moves towards the resistance without reaching it, and go back to the support. We can expect a potential downward breakout after that. Note that a partial rise always starts from the test of the support.
Partial declines commonly occur in broadening descending wedges. The price bounces off the resistance, moves towards the support without reaching it, and then goes back to the resistance where we can expect a potential breakout upwards. Note that a partial decline always starts from the test of the resistance.
Partial rises and declines can offer a better price to buy/sell instead of waiting for a breakout.
3. Measure Rule
The measure rule for broadening wedges allows us to determine the position of a take-profit/stop-loss.
For a broadening ascending wedge the measure rule would place our take profit at the lowest low inside the formation. Selling directly after a partial rise would allow for higher profits.
For a broadening descending wedge the measure rule would place our take profit at the highest high inside the formation. Selling directly after a partial decline would allow for higher profits.
Certain analysts close trades caused by partial rises/declines when the price reaches the support/resistance of the wedge, opening a new position in the case of a breakout while using the metric rule for setting their take profit.
4. Causes Of Broadening Wedges
Bulkowski offers a description of the causes of broadening wedges in the market in terms of the market participant's behavior.
The cause of an ascending broadening wedge is a surge from an initial buying impulse, driving the price higher. Momentum traders follow the initial impulse further pushing prices up.
Contrarian traders judge the price to be trading above its intrinsic value, selling and thus creating a decline in prices. However, before the decline reaches the previously established low, certain market participants buy again. These participants can be composed of initial buyers, accumulating positions, or late traders seeing the potential to buy at a better price. This allows the creation of a new impulse, with only a divergence left.
This scenario eventually repeats itself with increased volume, causing impulses and retracements of higher magnitude reinforcing a positive feedback loop until the price is judged overbought even by initial buyers.
A broadening falling wedge follows the same scenario structure but with sellers instead of buyers.
5. Other Observations
The amplitude of the cyclical variations within a broadening wedge increases over time, thus potentially highlighting volatility clusters in higher time-frames.
Another interesting observation that can be made is that prices within a broadening wedge are subject to heteroscedasticity (variability is not constant, it increases inside a broadening wedge), while prices inside a channel are homoscedastic (variability remains constant). This concept is inherent to regression analysis.
6. Conclusion
In this post we described broadening wedge patterns in depth. We have highlighted partial rises/declines as well as how the measure rule applies to such patterns. We then focused on showing how market participants act during the formation of broadening wedges.
Note that unlike triangles patterns we did not find a significant amount of studies mentioning such patterns, nor any agent models developed to describe their occurrence.
7. References
(1) Bulkowski, T. N. (2021). Encyclopedia of chart patterns. John Wiley & Sons.

How to trade with Falling wedge pattern-Live exampleFalling wedge pattern's considered as continuation pattern (Bullish continuation pattern) We can catch this pattern
after some bullish reversal or in a continuous bullish run.Best place to enter bullish was after the break of the upper side trend line
(After converging).The primary target would be the topmost rejection level of the wedge and we can fix our extended target with the help
of Fibonacci.

Rising Wedge - "Learn More Earn More" with usWhat makes the chart interesting today is that:
. BTCUSD challenging the Wedge's UpTrend.
. A break bellow Wedge's UpTrend could push the pair to its $10,400 ~ $10,500 previous support areas.
. A rejection at the Wedge's UpTrend, however, could lead to another retest of the Wedge's top.
Will the BTC see an downside breakout against the USD?
No one knows it! We have to wait and see!
Learn More,
Earn More,
With ForecastCity!

Rising Wedge - "Learn More Earn More" with usWhat makes the chart interesting today is that:
BTCUSD challenging the Wedge's UpTrend.
A break bellow Wedge's UpTrend could push the pair to its $10,400 ~ $10,500 previous support areas.
A rejection at the Wedge's UpTrend, however, could lead to another retest of the Wedge's top.
Will the BTC see an downside breakout against the USD?
No one knows it! We have to wait and see!
Learn More,
Earn More,
With ForecastCity!


What is an ascending broadening wedge? (Educational, Example) An ascending broadening wedge is a bearish chart pattern (said to be a reversal pattern). It is formed by two diverging bullish lines.
An ascending broadening wedge is confirmed/valid if it has good oscillation between the two upward lines. The upper line is the resistance line; the lower line is the support line.
Each of these lines must have been touched at least twice to validate the pattern.
NB: a line is said to be "valid" if the price line touches the support or resistance at least 3 times.
This implies that the ascending broadening wedge pattern is considered valid if the price touches the support line at least 3 times and the resistance line twice (or the support line at least twice and the resistance line 3 times).
An ascending broadening wedge does not mark the exhaustion of the buying current, but the sellers’ ambition to take control. The divergence of the two lines in the same direction (increase in price magnitude) informs us that the price continues to increase with movements that are increasingly high in magnitude. The buyers manage to make the price rebound on the support line but lose control after the formation of a new highest point. The lowest point reached during the first correction on the ascending broadening wedge’s support line forms the support. A second wave of increase then occurs with more magnitude, signalling the loss of buyers' control after a new highest point. A third wave is formed afterwards but buyers lose control again after the formation of new highest points.
During the formation of an ascending broadening wedge, volumes do not behave in any particular way but they increase strongly when the support line breaks.
