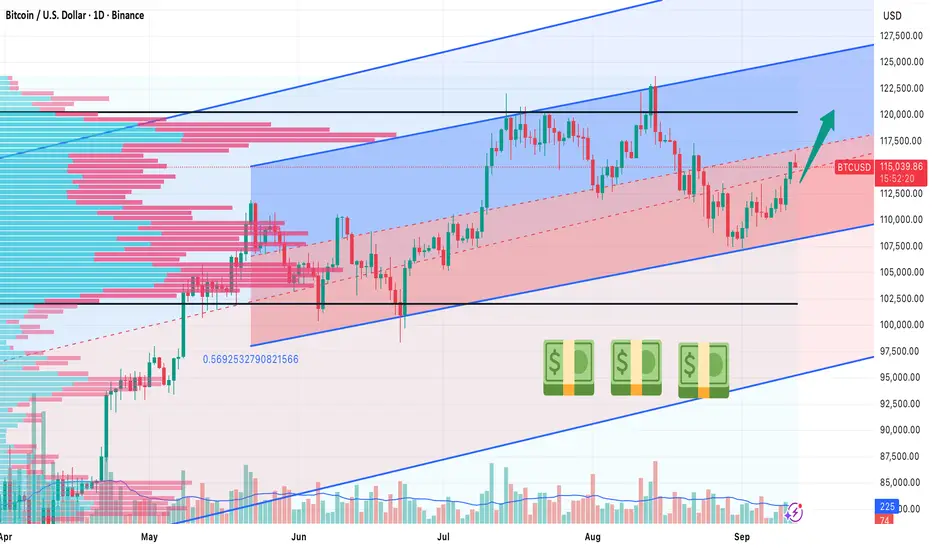
BTC/USD Near the Median of Weekly and Daily Regression TrendsHow to Approach the Setup
Long‑term bias: bullish (weekly regression channel slopes upward, daily channel is flat‑to‑slightly bullish).
Typical trader mindset: wait for an upward breakout with strong volume or place a buy‑limit order around the round‑number level of 115,000 USD and aim for an initial target near 120,000 USD (+4%).
Price action and technical context
BTC is currently trading close to the median line of two overlapping regression‑trend channels:
Weekly Timeframe: Channel slope Upward - Interpretation : Long‑term bullish pressure
Daily Timeframe: Channel slope Flat‑to‑slightly up - Interpretation : Short‑term equilibrium, slight upside bias.
The price sits in a narrow corridor bounded by the upper and lower regression lines. Because the weekly channel is tilted upward, the overall market structure still favors higher highs. The daily channel’s flatness suggests that any move will need a catalyst—typically a surge in buying volume or a breakout above the weekly upper trend line.
Key technical reference points
Upper daily regression line: ~125,000 USD – the first resistance level that, if breached with volume, could trigger a sustained rally.
Median (current price area): ~117,000 USD – a psychologically clean round number that also aligns with the median of both channels.
Lower daily regression line: ~108,000 USD – a safety net; a break below would invalidate the bullish bias.
Trade‑the‑setup options
1. Wait for a breakout – Enter the trade when the price closes above the weekly upper regression line and the accompanying volume is at least 1.5 times the 20‑day average. This condition confirms that the bullish bias is actually materialising and helps avoid false “whipsaw” moves. In practice, traders use a market order or place an aggressive limit order just above the breakout level (around 118,600 USD).
2. Buy‑limit at 115,000 – Set a limit order at the round‑number median of 115,000 USD. The round number acts as a natural “magnet,” and because the price is already near the median, this approach works well in a range‑bound market. The typical execution is a limit order at 115,000 USD with an initial profit target of 120,000 USD, representing roughly a +4 % gain.
Both methods assume the trader will monitor volume and short‑term momentum (RSI, MACD) to confirm that the move is not a temporary spike.
Momentum and volume cues
RSI(14): Values climbing above 55 support the bullish bias; a dip below 45 warns of potential reversal.
MACD: A bullish crossover (MACD line crossing above the signal line) on the daily chart adds confidence to a breakout or limit‑order fill.
Volume: A surge to at least 150 % of the 20‑day average on the day of the breakout dramatically raises the probability of a sustained move.
Risk considerations
Stop placement: If the price falls below the lower weekly regression line (≈111,000 USD) or breaches the median downward with a sharp volume spike, exit the position.
Position sizing: Because BTC’s volatility can be extreme, allocate a modest percentage of the portfolio (e.g., 2‑3 % of equity) to this speculative play.
Alternative defined‑risk structures: Traders uncomfortable with outright exposure can use a debit call spread (e.g., buy the 115,000 USD call, sell the 120,000 USD call) to cap downside while preserving upside to the first target.
Bottom line
When BTC/USD hovers near the median of a bullish weekly regression channel and a flat‑to‑slightly bullish daily channel, the market is in a neutral‑to‑bullish equilibrium. The prudent approach is either:
Patience: Wait for a volume‑driven breakout above the weekly upper trend line, or
Precision: Place a buy‑limit order at the clean 115,000 USD level and target the first upside milestone at 120,000 USD (+4%).
Both strategies rely on confirming momentum and volume before committing capital, while keeping a tight stop below the lower weekly regression line to protect against a sudden reversal.
Weeklytrend
USDCHF SELLSPrice broke below the weekly resistance to continue its bearish trend. I would like to see price retrace a bit further before continuing to sell towards the weekly support at 0.84000.

$ECL longCould be that I'm a little bit late to the party - should have entered already at 156.50 USD - but I guess this order could be also okay. Good trades, folks!

ADA trend lines and fib levels#ADA/USDT
$ADA weekly trend line and fibonacci levels.
price is above 1.272 fib level of last weekly swing high, last support will be 1.414 fib level at $0.158.
and you can see the support levels in between.
this will be the last support zone that price should hold it so we are mostly near the bottom.
there is a green descending resistance that break out from this will be the start on new rally but pullback to this line will be around $0.1587 so don't rush to buy yet.

2 GAP + QM patternwe have 2 open GAP on BTC1! CME chart. I think bitcoin formed QM pattern in Daily TF. QM is a powerful pattern.
Bitcoin was broken weekly trend line (in logarithmic chart mode) and i expect bitcoin goes up to near 60K for 3 purpose :
1-close open gap, 2- QM pattern complete, 3-pullback to broken weekly trend line.
if correctly complete QM pattern bitcoin price goes to Daily zone.

EURJPY analysis by forexbeeEURJPY Analysis: Looking to buy from the below demand zone
Trend: Overall Trend is Bullish. Price has been oversold as well with consecutive lower lows on lower timeframe.
Trade Idea: EURJPY has been retracing towards the demand zone. The main confluence here is that a strong key level is coming on the way which has the ability to reverse the price. Fresh Demand zone has added more power to the key support level. there are high chances of reversal in price.

USOIL Weekly/Daily analysis 🦐USOIL on the weekly chart couldn't break the descending trendline and the daily resistance around 41.30.
On the daily chart, the price is moving inside an uptranding channel.
If the price during next week will break below the 39 area, we can expect a new test of the 37 level.
–––––
Follow the Shrimp 🦐
Keep in mind.
• 🟣 Purple structure -> Monthly structure.
• 🔴 Red structure -> Weekly structure.
• 🔵 Blue structure -> Daily structure.
• 🟡 Yellow structure -> 4h structure.
• ⚫️ Black structure -> >4h structure.
Here is the Plancton0618 technical analysis , please comment below if you have any question.
The ENTRY in the market will be taken only if the condition of the Plancton0618 strategy will trigger.

GBPDKK on the break of a weekly trendline 🦐GBPDKK on the daily chart is testing the weekly descending trendline.
The price can approach soon a daily resistance around 8.300.
IF the market will break and close above the structure we will set a nice long order according to Plancton's strategy.
–––––
Follow the Shrimp 🦐
Keep in mind.
• 🟣 Purple structure -> Monthly structure.
• 🔴 Red structure -> Weekly structure.
• 🔵 Blue structure -> Daily structure.
• 🟡 Yellow structure -> 4h structure.
• ⚫️ Black structure -> >4h structure.
Here is the Plancton0618 technical analysis , please comment below if you have any question.
The ENTRY in the market will be taken only if the condition of the Plancton0618 strategy will trigger.

USD/CHF Weekly time frame wide rangeRecently tested the weekly resistance point and failed to close above. It looks like its continuing with its range trend; if so this is an early catch and seems like a good idea to short. Would be adding my stop above the resistant line and securing some pips along the way

AUDUSD DAILYOverall it is in a uptrend on the weekly, however on the daily its downtrend line is still holding & I think will make one lower low back down to the weekly uptrend line before breaking to the upside. Looking for short term shorts this week, as I believe the dollar will be making a retracement to continue its downtrend (DXY).

Bearish Sentiment Confluence
1.Trenline break on daily
2.Weekly timeframe changed sentiment (short) weekly downtrend
3.Break of opposing level on 4hr
4.Profit margin (1:4)
5.If price action shows signs of reversal than we exit trade otherwise we hold until all major support lines/zones are broken

AUDUSD Short on small time frame.AUDUSD looks like it can go to test .74000. It just formed a bearish bat pattern on the 15 min time frame. Allowing a short opportunity. The pair is current resting on a weekly trendline, so looking for a shorting opportunity is ideal.

NZD/USD Great place to enter a short position. LOW RISK ! Sorry if the chart is a little bit vague, please do not hesitate to ask any question you may have.
I believe during this week, we would heat target 2.
Please set your TP and SL for target one for now and I will update once we got closer.
Cheers,
Masih
