WhiteBIT Token WBT price entered to buy zone for long-termIf you woke up today, looked at the charts of cryptocurrencies, and were flooded with thoughts: "Oh, I did not buy at the bottom and missed the growth", then we have good news for you.
Not everything has "shot up" yet, for example, the token of the WhiteBit crypto exchange - WBT
Today 3/5 of the planned coin unlock took place. Probably, someone decided to fix x2 profit after unlocking around $4, because the price on the presale was $1.90, and the price of WBT spilled a little.
But, at the same time, the WBTUSDT price entered the purchase zone of $3-4 , where we think it is an ideal place to buy for medium and long-term investment (of course, if you believe in the project).
To get acquainted with the project, you can read the tokenomics we described here:
By the way, the same idea shows how a few months ago, those who bought in the $3-4 zone, in a few weeks were able to fixed x3-4 profit.
Now we do not expect such rapid growth, because there are still 2 more coins unlocking ahead, which can put a little pressure on the price with increased supply.
But it is worth remembering that after March 13, there will be no more injections of new coins into the market. The law of "supply and demand" has not yet been canceled)
Well, we shared our thoughts, and now everyone thinks and makes decisions on their own ;)
Have a nice and profitable weekend to all of you)
_____________________
Did you like our analysis? Leave a comment, like, and follow to get more
Whitebit

WBT (WhiteBIT Token) - A Short-Term PerspectiveWBT (WhiteBIT Token) - A Short-Term Perspective
As we can see from the chart, the price has already built up a very solid 4-hour structure at the bottom.
Whenever the price tests 4.030 - 4.05 we can see a bounce
between 3.5% and 5%.
Given that the price is near the bottom, it should rise again.
The minimum price movement of the move is between +3.5% to +5%
In the bigger picture, the price should increase even more as shown below.
Thanks and good luck!
Bigger Picture:

ETH: Price Can Develop a Range Trading OpportunityETH: Price Can Develop a Range Trading Opportunity
On the daily chart, Ethereum is showing the opportunity for a
range trading price development.
Price is actually testing a very strong resistance area that proved
to be very strong in the past.
The CPI numbers from the U.S and also the market speculation
related to those number help Ethereum to reach the price zone
where it is now.
I am expecting a bearish correction this time again. However
the actual situation is not that easy and we have to be careful
despite the fact that the crypto industry is very weak.
PS: If the price will break above the current structure then we can be exposed
to the bullish move.
Thank you and Good Luck!

WBT - Wait For The Bulls! ↗️Hello TradingView Family / Fellow Traders. This is Richard, as known as theSignalyst.
on DAILY: Left Chart
WBT is sitting inside a strong demand zone so we will be looking for buy setups on lower timeframes.
on H4: Right Chart
WBT is forming a double bottom but it is not ready to go yet.
🏹Trigger => for the bulls to take over, we need a momentum candle close below the gray neckline. Then a movement till around the 5.0 resistance would be expected.
Meanwhile, until the buy is activated, WBT can still trade lower till the 3.0 - 4.0 zone.
Always follow your trading plan regarding entry, risk management, and trade management.
Good luck!
All Str

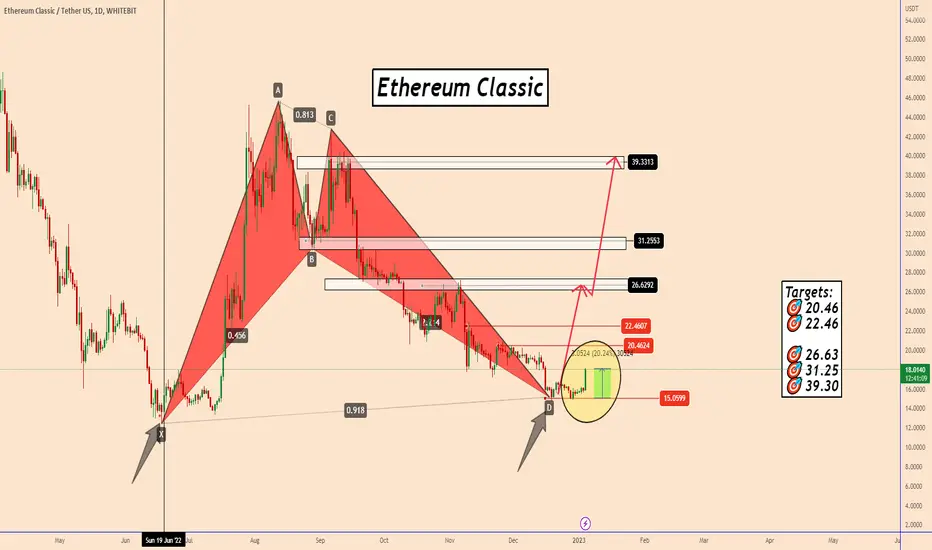
ETC(Ethereum Classic): +20% In One Week...What's Next?ETC(Ethereum Classic): +20% In One Week...What's Next?
This is an analysis that I shared one week ago.
The first bullish move was perfect + 20% profits so far.
So if you are happy you can close these profits also here:)
However, the price completed this beautiful harmonic bullish pattern
and it can be a good signal that the bullish wave should be ready soon.
PS: If all will be well regarding the fundamental outlook of the crypto market the price should rise again from this point.
Targets:
🎯 20.46
🎯 22.46
🎯 26.63
🎯 31.25
🎯 39.30
Thank you and Good Luck!
Previous Analysis:
WBT - Inside A Demand Zone! ↗️Hello TradingView Family / Fellow Traders. This is Richard, as known as theSignalyst.
on DAILY: Left Chart
WBT is sitting inside a strong demand zone so we will be looking for buy setups on lower timeframes.
on H4: Right Chart
WBT is forming a double bottom but it is not ready to go yet.
🏹 Trigger => for the bulls to take over, we need a momentum candle close below the gray neckline.
Meanwhile, until the buy is activated, WBT can still trade lower till the 3.0 - 4.0 zone.
Always follow your trading plan regarding entry, risk management, and trade management.
Good luck!
All Strategies Are Good; If Managed Properly!
~Rich

WBT (WhiteBIT Token): Bullish Accumulation Looks Very HighWBT (WhiteBIT Token): Bullish Accumulation Looks Very High
After the FTX dumped all of the crypto market we can see the market optimism
for the crypto market is very small.
However, these times are also the perfect times for the long-term investment
that sometimes can turn out also as a short-term investment.
WBT is testing a very low area only because of FTX.
On the other hand, we are looking at a very new TOKEN that considering the history
of the other brokers tends to increase too much in price as their volume grows also with the
broker expansion.
Considering that the price is in the same zone as it was before the big FTX mess I guess that
everyone is looking at this potential bullish move now.
Price is in this area doing up and down for a long period of time.
The accumulation looks very high taking into consideration also the actual price zone.
Also on the 4-hour time frame price looks like it is close to the completion of e "Wedge Pattern"
This pattern could push the price higher again.
I think this should be a perfect time, to start, with the first LONG position.
PS: This is my personal decision and is not trading advice at all as it is in line with my long term trading plan
Thank you and Good Luck!

ETH Is Moving Within a Tight Trading Range! In-Depth AnalysisETHEREUM Is Moving Within a Tight Trading Range! In-Depth Analysis
As I explained yesterday during the Trading View live stream, the price stopped at the BlockFI support zone.
It is very clear that this support near 1154 is very strong and pushed the price back up to the 1216 resistance zone.
This resistance zone is again very important because 1216 can push the price back to 1154 by expanding the correction in this way.
Only a break above 1216 will push the price up again.
Until that moment we are blocked within a tight trading range of 1154 - 1216
Thank you and Good Luck!

ETHEREUM: The price is inside a critical zoneETHEREUM: The price is inside a critical zone
During last week's close, the price suffered a very bad crash.
The current place where the price is currently stopped is not good
at all as it is showing many trading opportunities.
The price still looks very bearish considering that it is still developing within the structure
areas.
All the possible scenarios are shown on the chart.
Thanks and good luck!

WBT (WhiteBIT Token): The Big Bullish Move Should Come SoonWBT (WhiteBIT Token): The Big Bullish Move Should Come Soon
Since when we saw the big crash in the crypto market because of FTX
many cryptocurrencies are waiting for the next move.
As we can see WBT (WhiteBIT Token) is finally showing a very strong
support zone located near $4.1 - $4.8
Price stopped within this area for nearly 1 month.
Chances are very high that as the market sentiment improves
the price should increase significantly considering that the actual price is very
cheap and the token is very new and it is already listed on three different crypto exchanges.
PS: I will begin to add on the long positions now considering that the market is already reaction.
Please plan your trade and trade your plan...this is my trading plan:)
( it is not financial advice at all)
Targets:
🎯 11.00
🎯 14.00
🎯 18.50 extended target
Thank you and Good Luck!

XRP Price Analysis: 0.3700 Appearing To Be a Strong AreaXRP Price Analysis: 0.3700 Appearing To Be a Strong Area
In the previous analysis, the price reached 3 of our targets.
Currently, the price is close to the support zone that offers again
another LONG opportunity for us.
I think the price may rise again because traders found a
reason during this week to trade and they can try a second time again.
The market moved down because of the FOMC, but it could go higher
again as the FOMC will not keep the market forever under pressure.
The only problem is that FTX and hope it will be an old topic soon.
If all is to be well in the crypto industry, the market should recover soon.
Thanks and good luck!

WBT price accumulation and after can be again growthToday we will talk about the prospects of WBT token
We described in detail about the project, its tokenomics, and growth prospects 3 months ago, those who are interested, we invite you to review
At night unlocked 10,8mln coins. And maybe a large portion of coins bought on the presale at a price below $2 was sold. Naturally, when they began to fix x2 profit and sales began, the price shed.
On the other hand, the WBTUSDT price reached the liquidity zone, where 3 months ago it was "densely" bought before the start of sharp x3-x4 growth.
The next unlock of the same portion of coins is in a month on 13.01.2023.
Given the fact that today on 13.12 the US consumer price index will be updated, and tomorrow on 14.12 the Fed will announce a new US Federal Funds rate (forecast +0.5%), the market will be volatile.
You can safely place orders to buy with a grid in the range of $3.60-4.10 and take a medium or long-term position.
Prospects for growth WBT price in our opinion are not bad - it is $11 and 14 dollars in the context of several months.
_____________________
Did you like our analysis? Leave a comment, like, and follow to get more

ETHEREUM: Price May Drop Further To 1170ETHEREUM: Price May Drop Further To 1170
Bitcoin and Ethereum are both experiencing a flash selloff today.
Considering that the price broke down a structure, it means that
the bears are back in the market and Optimism is
not high at all when it comes to cryptocurrencies.
So we can see the price fall further to 1200 and 1170
during these days.
Targets:
🎯 1204
🎯 1168
Thank you and Good Luck!

Bitcoin| Is Bitcoin About To Rise Again?Bitcoin| Is Bitcoin About To Rise Again?
Today bitcoin is rising and it seems that market optimism is very high.
Incremental volume and optimism can be addressed to this new week.
So traders start trading again and
the market is still waiting for a dovish FOMC this time again.
Overall, this is creating a strange volume that is pushing the price higher.
However, as I see it, the first and strongest area of resistance is just around the corner.
Reversal zone 17600 - 18500.
Inside the resistance zone, we can see the price fall again.
Thanks and good luck!

LUNA 2.0: The Support Zone Near 1.500 is Showing StrengthLUNA 2.0: The Support Zone Near 1.500 is Showing Strength
LUNA: A Beautiful Accumulation In a MEME Coin
Luna is testing the lower part of the structure and it is looking
in a very good position.
The structure corresponds also to a very old accumulation zone that can
push the price up again.
Despite the latest specualtions price stopped the crash near 1.4100 and it managed
to rise again.
Targets:
🎯 2.1879
🎯 2.5729
Thank you and Good Luck!

WBT - Potential Bullish Reversal!Hello TradingView Family / Fellow Traders. This is Richard, as known as theSignalyst.
on DAILY: Left Chart
WBT is approaching a strong demand zone so we will be looking for buy setups.
on H1: Right Chart
WBT is forming a double bottom but it is not ready to go yet.
Trigger => for the bulls to take over, we need a momentum candle close below the gray neckline.
Meanwhile, until the buy is activated, WBT can still trade lower till the daily demand zone where we will be looking for new buy setups.
Always follow your trading plan regarding entry, risk management, and trade management.
Good luck!
All Strategies Are Good; If Managed Properly!
~Rich

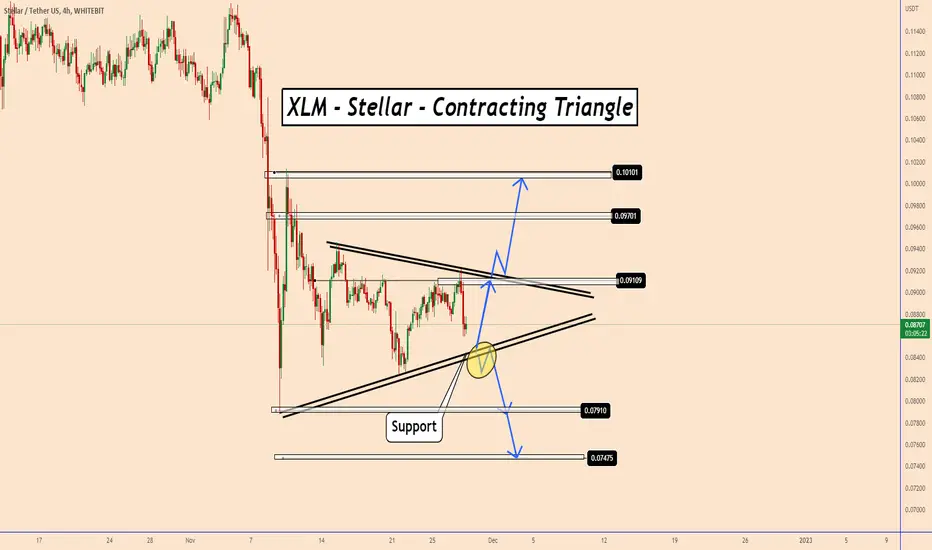
XLM | Stellar | Contracting TriangleXLM | Stellar | Contracting Triangle
Price is creating a contracting triangle and it has to decide where to move
next.
Actually it is testing the lower zone of the pattern and it can rise again
from that point.
If the price will manage to break down the triangle pattern it should move
down further
Targets on the chart!
Thank you and Good Luck!
ZEC (Zcash): Price Continues To Lose VolumeZEC (Zcash): Price Continues To Lose Volume
For a long period of time, the price is developing a well defined
"Descending Channel" Pattern.
The price tried several times to recover but it looks like a desperate move.
Price is still rising and the maximum it can do is to reach the resistance line
and to move down again.
Thank you and Good Luck!

ETHEREUM | 1070 Price Area Again Proved To Be Very StrongETHEREUM | 1070 Price Area Again Proved To Be Very Strong
After the price was tested for the second time, the price zone is located near 1070 we saw a very rapid volume increase.
The price increased by about +8.5% during the last 24 hours.
This indicates that large BUY Orders are positioned near 1070
Our pattern is still valid as long as it is a daily pattern and can continue to develop.
We'll just have to wait and see if the FTX rumors will settle down soon.
After that, the market should recover again.
Thanks and good luck!

ADA / A Bearish Pattern That Could Push it Further To 0.2650ADA / A Bearish Pattern That Could Push it Further To 0.2650
After yesterday's move by BTC that broke through 16k, we can see today
that the entire crypto market is not in a good mood today.
Many strong barriers have already been broken and we can see
many good projects lose more value.
ADA is one of them. The price broke down into a 4-hour triangle
pattern and it may decrease further to 0.2650.
Targets:
🎯 0.2896
🎯 0.2650
Thank you and Good Luck!

CHZ - Chiliz: Possible Price Increase Near 0.180000CHZ - Chiliz: Possible Price Increase Near 0.180000
The price is creating a megaphone pattern on the daily time frame.
Immediate support will be found near 0.180000 and this is a zone
that I am paying a lot of attention to.
From that area, we can see the price reach up to the top of the
megaphone pattern and after that, we should see if the price will rise further.
Thanks and good luck!

LUNA: A Beautiful Accumulation In a MEME CoinLUNA: A Beautiful Accumulation In a MEME Coin
Luna is testing the lower part of the structure and it is looking
in a very good position.
The structure corresponds also to a very old accumulation zone that can
push the price up again.
Don't miss it...
Targets:
🎯 2.1879
🎯 2.5729
Thank you and Good Luck!

WBT: Support near $5.2 is Keeping The Price Very StrongWBT: Support near $5.2 is Keeping The Price Very Strong
After the price reached the top of the 5the wave in a perfect way
we can see that the price has already been corrected.
This correction it is not in line overall with the expectations as FTX
created very big problems related to market confidence in the crypto industry overall.
However, the situation looks a bit more stable now after this deep correction that is still
in line with the normal wave developments or how a new trend tends to develop.
So considering that the price already stopped near $5.2 for several days and the situation
is getting a bit more silent about FTX we may see the price increase further very soon.
Don't forget that the WBT (WhiteBIT) token is already being traded in 4 different exchanges and this
could be again a great trading opportunity.
We made good profits on the first bullish wave.
Targets:
🎯 11.00
🎯 14.00
🎯 18.50 extended target
Thank you and Good Luck!
