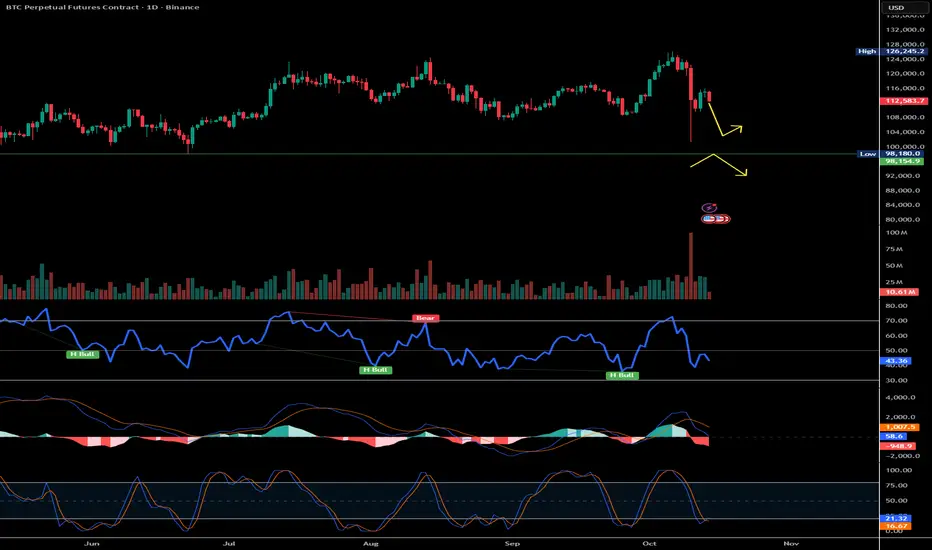
$BTC Correction : Watch for Double Bottom or Deeper Drop to 88kBitcoin faced a clear rejection around the 116,500 zone, marking a fresh lower high and confirming that a corrective phase is in play. At this stage, price action suggests a potential formation of a double bottom or a wick recovery setup — with nearly 70% of the wick zone likely to be filled as liquidity gets tapped.
In the bullish case, a rebound from the current structure could fuel an upside move once the lower support holds. However, if BTC loses the 98,000 support, it opens the door for a deeper correction toward the 88,000–90,000 range.
For now, short trades remain more favorable until we get a confirmed double-bottom or clear reversal signal. Once the market structure shifts and liquidity from the lower zones gets cleared, long setups can be reconsidered.
Let’s see how Bitcoin reacts around these levels — the next few candles will define whether the correction deepens or reverses.
#Bitcoin #BTCAnalysis
Wick
BTC Well on it's way to 126kTechnical analysis most times does not need many words.
Here we have a very bullish bitcoin BINANCE:BTCUSD
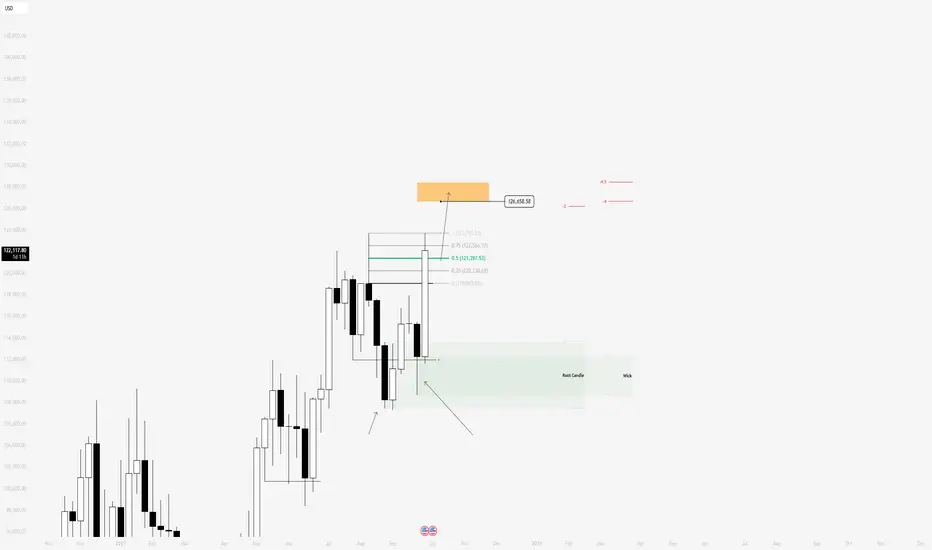
Using the wicks on the weekly chart, I can measure them and project values towards all time highs based on Market Maker Model Dynamics
The first projection, is the root candle of the current distribution
The second projection is the lower wick of the last re-accumulation before we had an expansion in the just concluded week.
Both projections, converge around 126k so I have my sights set on 126k
I anticipate the lower wick of the upcoming week to form around 121k (50% premium wick level)
See image below
BINANCE:BTCUSD
That's it.
The Wick Phenomenon: How and Why Big Wicks Get FilledIn trading, wicks on candlestick charts represent the highest and lowest prices during a given time period. Long wicks can often be seen as a sign of market indecision, but they also tend to get filled by subsequent price action.
This phenomenon occurs frequently and can provide valuable insights for traders looking to capitalize on price movements.
In this article, we’ll explore how and why big wicks get filled through practical examples.
Understanding Wicks and Their Significance
Wicks, also known as shadows, appear on candlestick charts when the price moves significantly above or below the opening and closing prices within a specific time frame.
A long upper wick indicates that prices were pushed up but then fell back down before the close, showing selling pressure.
Conversely, a long lower wick suggests that prices were driven down but then recovered before the close, indicating buying pressure.
Usually, at least 50% of the wick will be filled, and sometimes the entire wick will get filled before the reversal happens.
Why Do Wicks Get Filled?
1️⃣Market Psychology: Traders often see long wicks as areas of interest. For instance, if the price reaches a high but then falls, traders might anticipate a retest of that high.
2️⃣Liquidity Zones: Long wicks indicate areas where a lot of trading activity took place. These areas are often revisited as the market seeks liquidity.
3️⃣Mean Reversion: Prices tend to revert to their mean over time. A wick can be seen as a deviation from the mean, and the subsequent filling of the wick is part of the reversion process.
How To Trade It?
It all depends on your trading plan.
Here are some options:
Aggressive traders can buy/sell immediately after the wick has been formed.
Semi-conservative traders can look for a reversal pattern on a lower timeframe to confirm it.
Extra conservative traders can wait for the candle with the wick to be broken from the other side before entering.
Additionally, considering more confluences like key levels, market structure, and the overall trend will give you a better edge.
Why Now?
You might be wondering why I am posting this article now.
As you may have noticed, we had a dip yesterday, giving us a practical example on many altcoins and stocks. For this example, I have chosen DOGE, 4H chart.
I hope you like the content and found it useful.
Are you taking wicks into consideration in your trading plan?
If yes, how?
If not, why?
What would you like me to discuss next?
Always remember:
📚 All Strategies Are Good; If Managed Properly!
~Richard Nasr

MTL Loves a good wick Part IIQuick update to prior idea: Zoomed out - every green (buy) triangle on this 'machine learning' indicator, save for the very first one, results in a wick to the orange trend lines.
Fascinating.. lets see if this happens.
Prior idea:
Link to indicator.

MTL loves a good wickGreen buy signal on the machine learning indie on 3 Day chart. Back test accuracy is 95%.
This usually follows with a wick to the upside, to one of the orange trendlines. Setting multiple take profits.
As always, this is for entertainment purposes only.

XAUUSD Gold sell limit scalp test tradeAnd sure enough Price action did exactly what we were looking for price action to do.
Typically I would move stops to break even and take partial profits here, however due to the fact I am taking a reduced lot size (0.01 lots as I am currently testing the trading style out) I will move stops to breakever at our BE line (1909)
But I hope this was an educational post and demonstrates exactly how and what I look for in the market when taking trades, and as I sample more and more of these types of trades/entries I can look for ways to improve it.

EURAUD I Short from resistance Welcome back! Let me know your thoughts in the comments!
** EURAUD Analysis - Listen to video!
We recommend that you keep this pair on your watchlist and enter when the entry criteria of your strategy is met.
Please support this idea with a LIKE and COMMENT if you find it useful and Click "Follow" on our profile if you'd like these trade ideas delivered straight to your email in the future.
Thanks for your continued support!

GBPAUD I Headed down in the short term Welcome back! Let me know your thoughts in the comments!
** GBPAUD Analysis - Listen to video!
We recommend that you keep this pair on your watchlist and enter when the entry criteria of your strategy is met.
Please support this idea with a LIKE and COMMENT if you find it useful and Click "Follow" on our profile if you'd like these trade ideas delivered straight to your email in the future.
Thanks for your continued support!

ETHUSDT.P Trading IdeaHi everyone!
ETH is still in a range I showed in my previous trading idea.
Currently I would expect a small down-trend after reaction from a 0.5 of a wick, because we can see the H1 sweep of a previous HH, plus enough of liquidity built at the bottom side.

EURNZD I Rejecting Resistance/ShortWelcome back! Let me know your thoughts in the comments!
**EURNZD Analysis - Listen to video!
We recommend that you keep this pair on your watchlist and enter when the entry criteria of your strategy is met.
Please support this idea with a LIKE and COMMENT if you find it useful and Click "Follow" on our profile if you'd like these trade ideas delivered straight to your email in the future.
Thanks for your continued support!Welcome back! Let me know your thoughts in the comments!

GBPUSD I Potential buy from demand zone Welcome back! Let me know your thoughts in the comments!
**GBPUSD Analysis - Listen to video!
We recommend that you keep this pair on your watchlist and enter when the entry criteria of your strategy is met.
Please support this idea with a LIKE and COMMENT if you find it useful and Click "Follow" on our profile if you'd like these trade ideas delivered straight to your email in the future.
Thanks for your continued support!

USDJPY I Short from psychological resistance zone Welcome back! Let me know your thoughts in the comments!
**USDJPY Analysis - Listen to video!
We recommend that you keep this pair on your watchlist and enter when the entry criteria of your strategy is met.
Please support this idea with a LIKE and COMMENT if you find it useful and Click "Follow" on our profile if you'd like these trade ideas delivered straight to your email in the future.
Thanks for your continued support!

EURCAD Short from resistance Welcome back! Let me know your thoughts in the comments!
**EURCAD - Listen to video!
We recommend that you keep this pair on your watchlist and enter when the entry criteria of your strategy is met.
Please support this idea with a LIKE and COMMENT if you find it useful and Click "Follow" on our profile if you'd like these trade ideas delivered straight to your email in the future.
Thanks for your continued support!
Brian & Kenya Horton, BK Forex Academy

GBPJPY I Headed up from support!Welcome back! Let me know your thoughts in the comments!
**GBPJPY - Listen to video!
We recommend that you keep this pair on your watchlist and enter when the entry criteria of your strategy is met.
Please support this idea with a LIKE and COMMENT if you find it useful and Click "Follow" on our profile if you'd like these trade ideas delivered straight to your email in the future.
Thanks for your continued support!
Brian & Kenya Horton, BK Forex Academy

EURJPY I GAME time! Long from SupportWelcome back! Let me know your thoughts in the comments!
**EURJPY - Listen to video!
We recommend that you keep this pair on your watchlist and enter when the entry criteria of your strategy is met.
Please support this idea with a LIKE and COMMENT if you find it useful and Click "Follow" on our profile if you'd like these trade ideas delivered straight to your email in the future.
Thanks for your continued support!
Brian & Kenya Horton, BK Forex Academy

SPY: Crouching Market Hidden Selloff Try and locate these wicks on other brokers and data sources in TradingView. Where are they hiding?

USDJPY It will retrace to Support ZoneWelcome back! Let me know your thoughts in the comments!
**USDJPY - Listen to video!
We recommend that you keep this pair on your watchlist and enter when the entry criteria of your strategy is met.
Please support this idea with a LIKE and COMMENT if you find it useful and Click "Follow" on our profile if you'd like these trade ideas delivered straight to your email in the future.
Thanks for your continued support!
Brian & Kenya Horton, BK Forex Academy

GBPJPY LIVE Scalp & Intraday SHORT AnalysisWelcome back! Let me know your thoughts in the comments!
**GBPJPY - Listen to video!
We recommend that you keep this pair on your watchlist and enter when the entry criteria of your strategy is met.
Please support this idea with a LIKE and COMMENT if you find it useful and Click "Follow" on our profile if you'd like these trade ideas delivered straight to your email in the future.
Thanks for your continued support!
Brian & Kenya Horton, BK Forex Academy

bull trap to 22.3k, 200 WMA, weekly close in 4 hoursYesterday I gained 300$ from shorting BNB, today I lost 535$, I don't know anymore. I short at absolute of absolute bottoms, then long absolute of absolute tops, this comes from having an idea that X rejects at price Y, and from reaching price Y, I invalidate my trade then follow with opposite, while my previous wasn't invalidated
We either reject from here and first weekly close below 200 WMA, or we go up and close above it, scam pump, before retesting 20k.
RSI says we need correction. I don't know, I don't know, I don't know anymore. Im confused.
I am LONG till 22k, then opening a short. Who joins me!

[BTC-USD] - Biggest Wick After Rate Hike soon !!Technical analysis shows extraordinary and sensational results. You can't miss the upcoming rise !

Scam Wick - XMR-USDTwtf is this lol wtf is this lol wtf is this lol wtf is this lol wtf is this lol wtf is this lol
X

The Wick CatcherHere's an example bot designed to catch wicks on higher time frames. This is designed for cyrpto exclusively.

