[WSB] The Technicals Behind TSLA (Trading Plan)It's time for another analysis for our alltime favorite Tesla (TSLA). I don't have an intro ready so ...
this stock is basically a Meme. The monthly chart looks hilarious and many of my favorite analysts failed to
call a good opportunity for a short position. It's like a big warning sign at the end of the road - DON'T SHORT TESLA!
What we can see on the chart is a pretty healthy (which is kinda weird). And whoever spotted one of the many
different triangles (symmertical, ascending, declining, you name it) during this bullrun, definitely made profit.
TSLA recently broke out of a symmetrical triangle with a very strong impulse. The price tends to move upwards
in a channel after a breakout of this pattern. The support of this channel has been tested yesterday.
The price bounced back today and we can now aim for the top of the channel as our main target.
Here are some numbers that might be important for this trade
Use $550 - $570 as an entry
Close your position $670 - $690 before 16th December
Set your Stop Loss below $520
Everything else is explained on the chart.
This is not a financial advice.
cheers
Wsb

[WSB] The Technicals Behind PLTR (SPOILER: MOON! 🚀 )This is the most clickbait-title i've ever used but guess what, there's a reason for it!
Palantir Technologies (PLTR) is the november stock that made everyone rich (except me).
But i got something for you: there is a decent chance for another pump towards our previous high.
So we might be able to lock in another 20%-30% profit (if just buy the stonk :-)).
PLEASE BE CAREFUL: We can see a divergence with the price action and the MACD/RSI,
which means that the price has been moving up, but many people obviously took some profit
(or simply switched over to GME). A STOP LOSS IS MANDATORY IF YOU TRADE THIS STOCK!
Everything is explained on the chart. Here are some levels that might be important for you
Enter below $27.50
Place your Stop Loss $23.60
Target $33.00 and secure your first profits
This is not a financial advice.
cheers fellow autists

Vix Term StructureThis shows all the different Volatility products. As you can see, when the 9d Vix goes above the longer term Vix's. Bad things happen. Why? Because if the 9 day vix is higher than the others, it means that people are more uncertain about what will happen in the next 9 days than the next few months. Just something to think about:)

FSLY SHORT opportunityThinking we still have some space to drop, some major levels I think we will see are $85 and $79


TSLA 2015 Back to the FuturesThere is a bullish divergence on daily RSI. Stock has had time to digest watershed earnings. TSLA likely to keep on mooning. Stonks!

Tesla to 1050Played off the close yesterday holding the .382 showing $TSLA aiming higher. looking to see a close over $1000 today to ride to -.236 for 1055. Also just bought a Model S today so it only seems right.

SPY Thursday we saw a high volume test of 300, which held. Friday we broke 300 with lower volume, printing a lower low, and then rebounding to a lower high. Expecting a lower low to print early this week. Good luck to all, may the tendies be with you.

TQQQ - Short TechTech sector has done very well this past week - time for it to correct along with rest of market. puts puts puts

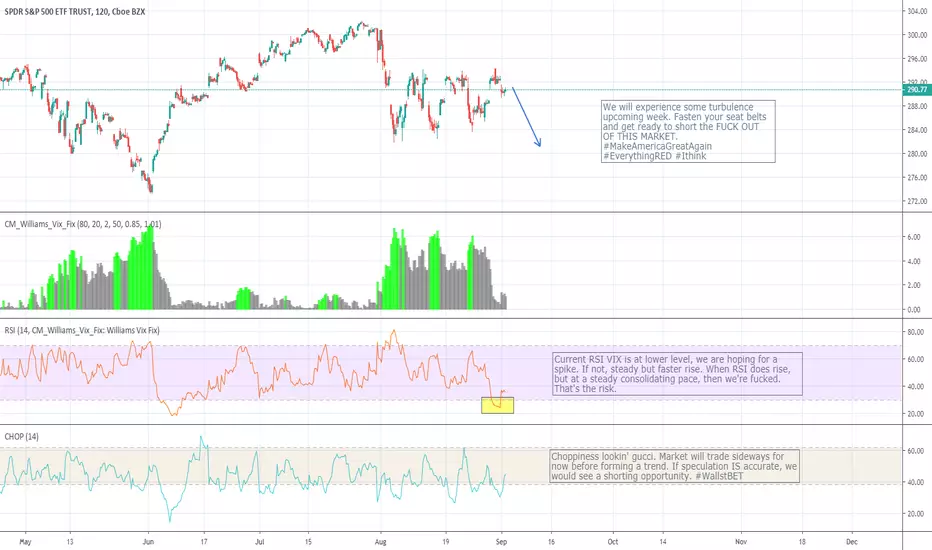
SPY - PPPSPY has broken down from the ascending channel defining the rally from 3/23/2020 to 6/8/2020. It's possible we retest the bottom of the channel as resistance, however, with the large amount of bearish momentum we may just continue straight down to 293. By the end of the month we should be able to tell if this is the end of the bear market rally or if it is a correction leg down before a push up to test the all time high. I am holding $300 puts in the near term, if we retest the bottom of the channel I will be loading up on $295 puts. Puts puts puts (PPP) XD

STONKS - WEED - Looks bullish, but it might switch up :| likeWTFGLHF, stay inside and trade at your own risk!


Speculative Previous December Pattern.Disclaimer: Please consult with your financial adviser before investing. Any statements made are not an investment advice and should not be taken as such. It is purely a speculative opinion. Invest at your own risk.