USOIL STRONG DEMAND AREA|LONG|
✅WTI OIL price reacts at demand level, showing signs of absorption with liquidity grabs. ICT model points to bullish orderflow aiming for the nearby target zone. Time Frame: 4H.
LONG🚀
✅Like and subscribe to never miss a new idea!✅
WTI-OIL

USOIL (WTI Crude Oil) Intraday & Swing Outlook🛢️ USOIL (WTI Crude Oil) Forecast – Intraday & Swing Outlook 🚀📉
Asset Class: USOIL (SPOTCRUDE / WTI CASH)
Last Closing Price: $62.796
Date/Time: 20th Sept 2025 – 12:50 AM UTC+4
🔍 Market Context
Crude oil remains in a volatile zone as macro factors like OPEC+ policy, global demand recovery, and geopolitical risks continue to steer momentum. Traders must prepare for short squeezes, traps, and breakout plays this week.
📊 Technical Overview
Chart Theories Applied:
📈 Elliott Waves – corrective Phase B nearing end.
🔄 Wyckoff – signs of re-accumulation spotted.
🔺 Head & Shoulders (Inverse) – potential bullish reversal.
🔮 Gann Angles & Time Cycle – short-term resistance clustering near $64.50.
🛠️ Indicators
🔵 RSI (H1) → Neutral zone (48–52).
📏 VWAP Anchored → $62.20 (support pivot).
📉 EMA 20 / EMA 50 → Bullish cross on H4 confirmed.
🎯 Bollinger Bands → Expansion phase → Expect high volatility.
🕒 Timeframe Strategies
📌 Intraday (5M / 15M / 1H / 4H)
Buy Entry (Scalp): $62.20 – $62.50 🟢
TP1: $63.20 🎯
TP2: $63.85 🎯
SL: $61.80 ❌
Sell Entry (Scalp): $63.80 – $64.20 🔴
TP1: $63.00 🎯
TP2: $62.40 🎯
SL: $64.70 ❌
📌 Swing (Daily / Weekly)
Buy Zone: $61.50 – $62.00 🟢
Targets: $65.20 / $67.40 / $70.00 🎯
Stop Loss: $60.50 ❌
Sell Zone (Rejection): $67.40 – $68.00 🔴
Targets: $64.50 / $62.20 🎯
Stop Loss: $68.80 ❌
⚠️ Risk Management
Volatility expected due to Fed rate guidance & OPEC+ commentary.
Stick to 2–3% capital risk per trade.
Watch for bull/bear traps near breakout zones.
📌 Summary
Intraday: Range $62.20 – $64.20 ⚖️
Swing: Upside bias if $61.50 holds strong 💹
Key Resistance: $64.50 / $67.40
Key Support: $61.50 / $60.50
🔥 Bias: Short-term sideways → Medium-term bullish above $61.50.
For individuals seeking to enhance their trading abilities based on the analyses provided, I recommend exploring the mentoring program offered by Shunya Trade. (Website: shunya dot trade)
I would appreciate your feedback on this analysis, as it will serve as a valuable resource for future endeavors.
Sincerely,
Shunya.Trade
Website: shunya dot trade

WTI: weekly seller targets reached, monthly targets still lowerHi traders and investors!
This analysis is based on the Initiative Analysis concept (IA).
The sellers have reached the targets mentioned in the previous review (65.628 and 64.378).
What to expect next.
Daily timeframe
On the daily timeframe (D1) for WTI, we see a manipulation of the 65.771 level, which may indicate that the market is moving toward the monthly targets I mentioned earlier — 61.818 and 58.504.
Hourly timeframe
On the hourly timeframe (H1), this manipulation appeared as a false breakout of the upper boundary of a sideways range. The range boundaries are clearly defined: the upper boundary at 65.771 and the lower boundary at 63.580.
Wishing you profitable trades!

WTI Surges Above 65$ ResistanceCrude oil is currently supported by a combination of energy sanctions, geopolitical tensions, and rate cut expectations — with price action eyeing the $70 barrier as long as it holds above $65.20.
WTI maintained its rebound above the 61.80–62.00 support zone — aligning with the neckline of the previous inverted head and shoulders formation — and has broken above the 65 resistance level, signaling a potential continuation of bullish momentum. Daily RSI has also moved above the neutral 50 level, further confirming upside momentum.
• A clean hold above 65.20 may extend the rally toward 68.00, 69.40, and 70.40 — the next major resistance levels.
• On the downside, 62.00 and 61.80 remain key support levels. A break below them could expose oil to deeper losses toward 59.40 and 57.90.

WTI Crude Awaits Breakout Amid Sanction RisksWTI Crude Oil – Overview
Oil Holds Steady on Fed Cut Bets and Sanction Risks
Oil prices are flat in early trade as markets weigh the likelihood of a U.S. Fed rate cut in September against potential disruptions to Russian crude flows. Brent trades at $67.18 (-0.1%), while WTI is steady at $63.64, following a 2.5% gain last week.
Fading optimism over a Russia–Ukraine summit and renewed U.S. tariff threats against India add to volatility. Markets are closely watching the Aug. 27 deadline, when secondary U.S. tariffs against India for Russian oil purchases are expected to take effect.
🔹 Technical Outlook
WTI is trading in bullish momentum as long as it holds above 63.47.
Price is likely to consolidate between 63.47 – 64.72 until a breakout.
✅ Above 64.72: Bullish continuation toward 65.83 → 67.20.
⚠️ Below 63.47: Bias turns bearish, targeting 61.83.
🔹 Key Levels
Support: 63.47 – 61.83
Resistance: 64.72 – 65.83 – 67.20
✅ Summary:
WTI crude remains range-bound but biased to the upside, supported by Fed cut expectations and geopolitical risks. A decisive break from the 63.47–64.72 range will set the next trend direction.

CRUDE OIL SHORT FROM RESISTANCE|
✅CRUDE OIL is going up now
But a strong resistance level is ahead at 64.50$
Thus I am expecting a pullback
And a move down towards the target of 63.33$
SHORT🔥
✅Like and subscribe to never miss a new idea!✅

Hellena | Oil (4H): SHORT to support area of 60 (Wave "3").Wave “C” continues to develop in a five-wave movement. Right now, I think wave “1” has just ended and we will see a small correction to the 66,280 area (wave ‘2’), after which I expect wave “3” to develop, which should go further than the 60 support level, but this is a fairly strong psychological level at which it would be good to take profits.
Manage your capital correctly and competently! Only enter trades based on reliable patterns!

Crude Oil Weekly Outlook: Tariffs, Ceasefire, OPEC & CPI RisksKey Events This Week
• WTI drops to 62.60 ahead of major geopolitical and economic catalysts: Ukraine ceasefire, U.S.–China tariffs, OPEC report, and U.S. CPI
• Global tariff developments continue to shape sentiment and crude demand valuations, especially in relation to OPEC’s evolving supply strategy
WTI’s latest drop is currently holding at the 0.618 Fibonacci retracement of the May–June uptrend, and precisely at the neckline of the inverted head and shoulders pattern around the 62.60 level. The Fibonacci retracement was applied from the $55 low to the $77.80 close, filtering out breakout noise from the Iran–Israel escalation outside the borders of the 3-year down trending channel.
• If 62.60 breaks, downside risks may accelerate toward the mid-zone of the channel, with key levels in sight at 61.40, 59.40, and 55.20, respectively.
• If 62.60 holds, and WTI reclaims ground above 65, we could see a recovery toward the upper edge with next resistance levels at 68.00, 70.00, 71.40, and 72.70.
Written by Razan Hilal, CMT

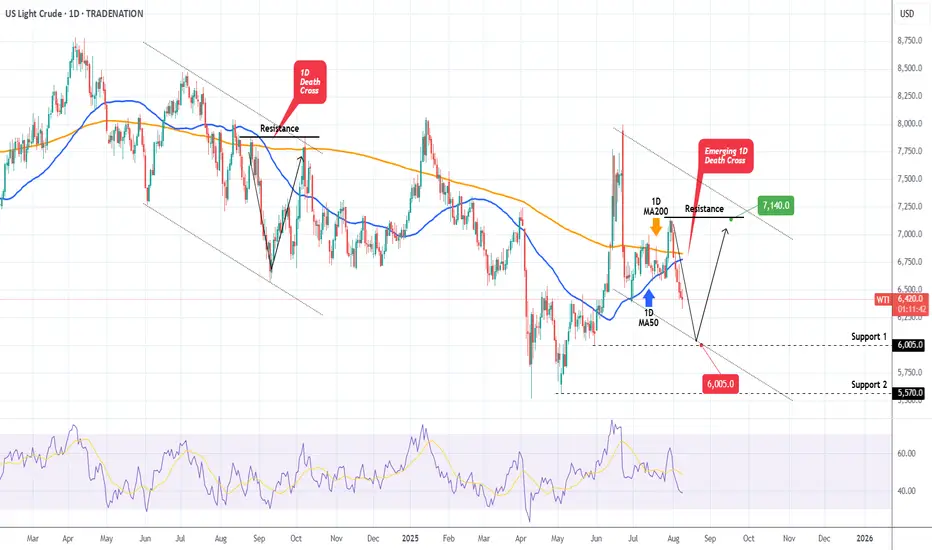
WTI OIL on its first 1D Death Cross since Sep 2024!WTI Oil (USOIL) is on the decline and is about to form a 1D Death Cross for the first time since September 06 2024! That is technically a bearish signal but last time once completed, the market formed a bottom 2 days later.
As a result, we expect a max drop to Support 1 ($60.05) but then more likely a rebound back to the Resistance ($71.40), especially given the fact that the 1D RSI will almost get oversold (>30.00).
-------------------------------------------------------------------------------
** Please LIKE 👍, FOLLOW ✅, SHARE 🙌 and COMMENT ✍ if you enjoy this idea! Also share your ideas and charts in the comments section below! This is best way to keep it relevant, support us, keep the content here free and allow the idea to reach as many people as possible. **
-------------------------------------------------------------------------------
Disclosure: I am part of Trade Nation's Influencer program and receive a monthly fee for using their TradingView charts in my analysis.
💸💸💸💸💸💸
👇 👇 👇 👇 👇 👇
WTI quick update. Will we see that 65-dollar break?After OPEC+ meeting, where a promise was made to increase production in September, WTI continues to slide. Let's dig in.
MARKETSCOM:OIL
TVC:USOIL
Let us know what you think in the comments below.
Thank you.
75.2% of retail investor accounts lose money when trading CFDs with this provider. You should consider whether you understand how CFDs work and whether you can afford to take the high risk of losing your money. Past performance is not necessarily indicative of future results. The value of investments may fall as well as rise and the investor may not get back the amount initially invested. This content is not intended for nor applicable to residents of the UK. Cryptocurrency CFDs and spread bets are restricted in the UK for all retail clients.

WTI: downside potentialHi traders and investors!
This analysis is based on the Initiative Analysis concept (IA).
Weekly timeframe
A buyer initiative is tentatively developing, yet the strongest buyer candle (highest volume) produced no follow-through. It was followed by two buyer candles on weak volume. Last week volume expanded again and clustered around 69.975, showing that sellers are still defending this level. Weekly seller targets: 65.628 and 64.378.
Daily timeframe
Sellers remain in control. The chart clearly shows volume manipulation around 69.975. Daily seller targets: 65.628 and 64.736.
Wishing you profitable trades!

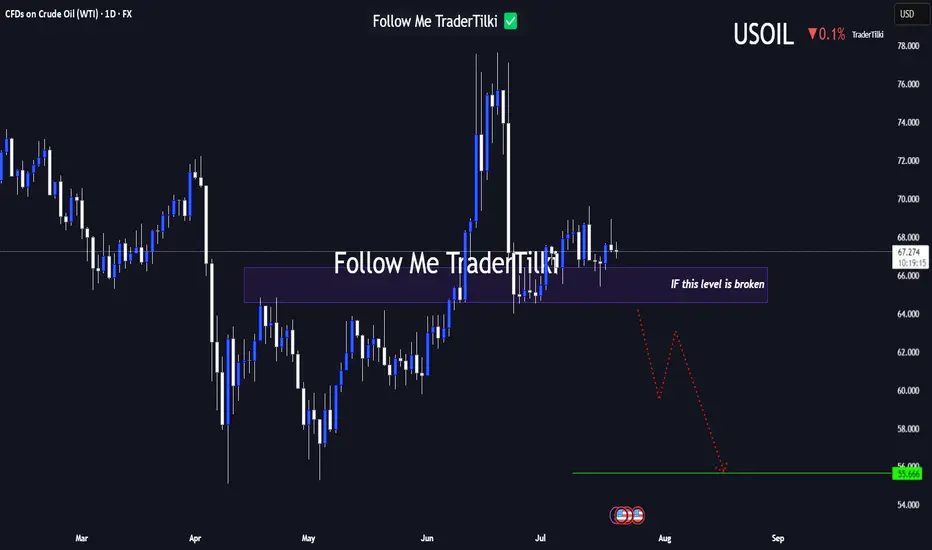
USOIL Under Technical Pressure: 1D Timeframe Breakdown Hey Guys,
The 66.584 level currently stands as the strongest support zone for USOIL. If this level breaks with a candle close, the next major target could drop to 55.666.
This setup is based on the 1-day timeframe. I highly recommend keeping a close watch on that key level.
Every like from you is my biggest motivation to keep sharing these insights. Thanks so much to everyone who’s showing support!
Could we see the WTI oil bears getting pleased any time soon?The technical picture of MARKETSCOM:OIL is showing a possible bearish flag formation, which may lead WTI oil to some lower areas. Is that the case? Let's dig in.
NYMEX:CL1!
Let us know what you think in the comments below.
Thank you.
75.2% of retail investor accounts lose money when trading CFDs with this provider. You should consider whether you understand how CFDs work and whether you can afford to take the high risk of losing your money. Past performance is not necessarily indicative of future results. The value of investments may fall as well as rise and the investor may not get back the amount initially invested. This content is not intended for nor applicable to residents of the UK. Cryptocurrency CFDs and spread bets are restricted in the UK for all retail clients.

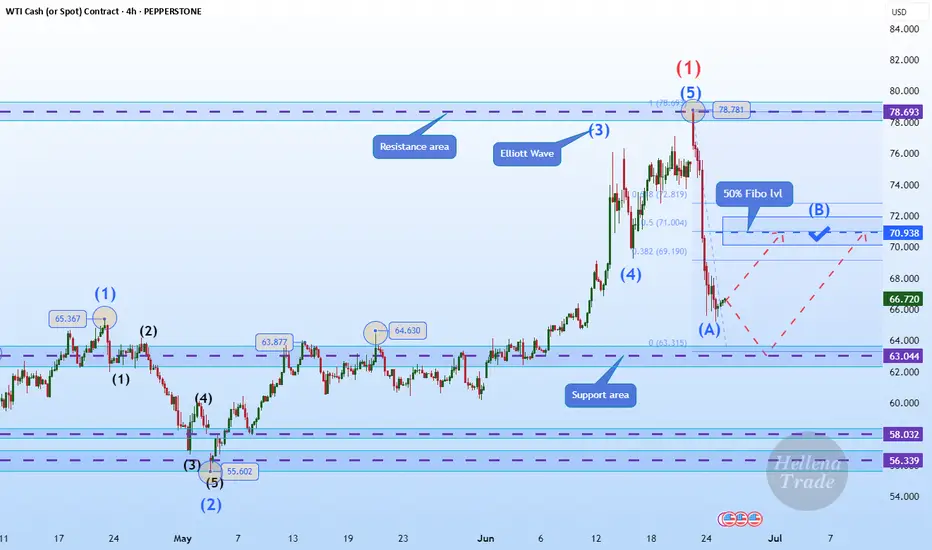
Hellena | Oil (4H): LONG to 50% lvl Fibo area of 70.00.Colleagues, after a long break, I think it is worth returning to oil forecasts. The situation is stabilizing a bit and now I think that the price is in a strong correction (ABC) at the moment I see wave “B”, which may reach the area of 50% Fibonacci 70 level.
It is possible that wave “A” will continue to develop towards the 62-63 area, but I still hope for an upward movement.
Manage your capital correctly and competently! Only enter trades based on reliable patterns!
WTI OIL This is the only Support right now.WTI Crude Oil (USOIL) is so far holding its 1D MA50 (blue trend-line), the natural medium-term Support, following a quick price deflation after the Israel - Iran de-escalation.
In our opinion, the trend-line that currently matters most though, is the Higher Lows coming straight from the May 05 Low. If broken, we expect a quick test of the 0.786 Fibonacci retracement level, as it resembles the December 2023 - May 2024 Higher Lows trend-line.
Even the 1W RSI is similar among the two fractals, and it has to be said that both are part of the 2-year Channel Down pattern.
So if the Higher Lows trend-line breaks, we can target $61.00.
-------------------------------------------------------------------------------
** Please LIKE 👍, FOLLOW ✅, SHARE 🙌 and COMMENT ✍ if you enjoy this idea! Also share your ideas and charts in the comments section below! This is best way to keep it relevant, support us, keep the content here free and allow the idea to reach as many people as possible. **
-------------------------------------------------------------------------------
Disclosure: I am part of Trade Nation's Influencer program and receive a monthly fee for using their TradingView charts in my analysis.
💸💸💸💸💸💸
👇 👇 👇 👇 👇 👇

WTI OIL Progressively bearish on the long-term. Eyes $52.50.A week has passed since our sell signal on WTI Oil (USOIL) and the emerging geopolitical stability has already helped the price move much faster towards our $58.20 Target (see chart in related ideas below).
If we look at it from an even longer term perspective, the 1W time-frame in particular, we can see draw some very useful conclusions about the bearish case. First of all that this week's High got rejected exactly on the 1W MA200 (orange trend-line), which is the trend-line that made the last 3 major rejections on the market (January 13 2025, October 07 2024).
As you can see, that was a textbook Double Top formation. The last Double Top rejection took place on June 06 2022, the previous multi-year Top for the market. The result was a continued sell-off that didn't stop before testing the 1W MA200, which is now the Resistance.
As a result, even though our $58.20 Target stands, on the longer term we can even see a -37.36% decline towards the end of the year. Contact with the bottom of the Channel Down can be made at $52.50.
Alternatively, you can look at the 1W RSI, which has a clear Sell and clear Buy Zone. This week it was rejected on the Sell Zone, so you may look to book your profit as soon as it enters the Buy Zone.
-------------------------------------------------------------------------------
** Please LIKE 👍, FOLLOW ✅, SHARE 🙌 and COMMENT ✍ if you enjoy this idea! Also share your ideas and charts in the comments section below! This is best way to keep it relevant, support us, keep the content here free and allow the idea to reach as many people as possible. **
-------------------------------------------------------------------------------
Disclosure: I am part of Trade Nation's Influencer program and receive a monthly fee for using their TradingView charts in my analysis.
💸💸💸💸💸💸
👇 👇 👇 👇 👇 👇

Middle East Tension & Markets: My Honest Stance🌍🕊️✌️ Middle East Tension & Markets: My Honest Stance 💣 🔥 🗡️
Hi everyone,
It’s Friday, June 20th — and we face a fragile moment: the uncertainty of possible US military action against Iran. 📉📰✈️
On my charts:
Bitcoin (BTC) reached key resistance and now ranges sideways as we await clarity.
Gold (XAUUSD) remains the classic safe haven — it holds an ascending structure, but profit-taking could trigger dips if markets crash.
Silver (XAGUSD) is similar, yet needs broader industrial strength to outperform gold.
Crude Oil (WTI) could spike dramatically if bombs fall — but I choose not to profit from pain.
USDJPY & USD pairs reflect global trust in the dollar and US stability — I’ll cover this more next week.
My personal stance is simple:
💙 I never short disasters. I never profit from human suffering. I am LONG on humanity and peace. 🕊️✌️🌈
👉 I expect potential market gaps between now and Monday:
✅ Bad news (war) → gold, silver, oil likely pump
✅ Good news (diplomacy) → risk assets rebound, oil stabilizes
I am positioned carefully with small risk and clear stops. My goal: protect my capital, trade my plan, but never bet on pain. If I lose because peace prevails — I win as a human.
Stay safe, trade wisely, and never forget: sometimes the best trade is no trade at all.
One Love,
The FXPROFESSOR 💙
Disclosure: I am happy to be part of the Trade Nation's Influencer program and receive a monthly fee for using their TradingView charts in my analysis. Awesome broker, where the trader really comes first! 🌟🤝📈

WTI CRUDE OIL: There is no better time to sell that this.WTI Crude Oil has turned overbought on its 1D technical outlook (RSI = 71.048, MACD = 2.830, ADX = 41.529) and this is technically the most efficient level to sell on the long term. Not only is that the top of the dotted Channel Down but last week the price got very close to the 1W MA200, which has produced the last 3 major rejections since the week of August 12th 2024. Technically the market still has some room to move upwards and test it but since it rose purely on the latest Middle East conflict, it is more likely than not to see an equally quick price deflation and rebalancing. The earlier bearish waves (September 2023 onwards), initially targeted the 0.786 Fibonacci level and then bounced. That translates to TP = 61.00 (at least) towards the end of the year.
See how our prior idea has worked out:
## If you like our free content follow our profile to get more daily ideas. ##
## Comments and likes are greatly appreciated. ##

Israel creates a risk-off environmentThe current geopolitical tensions continue to escalate and this is creating a risk-off environment, forcing investors to worry. Let's dig in.
MARKETSCOM:OIL
TVC:USOIL
Let us know what you think in the comments below.
Thank you.
77.3% of retail investor accounts lose money when trading CFDs with this provider. You should consider whether you understand how CFDs work and whether you can afford to take the high risk of losing your money. Past performance is not necessarily indicative of future results. The value of investments may fall as well as rise and the investor may not get back the amount initially invested. This content is not intended for nor applicable to residents of the UK. Cryptocurrency CFDs and spread bets are restricted in the UK for all retail clients.

Slowing Global Economy and Output Hikes Weigh on Brent OilBrent crude oil is holding steady around the $60 level, even after OPEC announced another 411,000 barrels per day increase in output, following similar hikes in May, June and smaller one in April. This latest adjustment comes at a time when global economic slowdown concerns are rising, making the decision a risky one. Although the main reason points to non-compliance from Kazakhstan and Iraq, some believe the United States may have played a role, possibly through pressure from Trump aimed at controlling inflation during the ongoing tariff hikes.
With several consecutive production increases now in place, a growing surplus is likely to develop over the second half of 2025. This would maintain downward pressure on oil prices if demand fails to keep pace. At the same time, the broader economic outlook is weakening. Recent manufacturing activity data from China, the United States, the European Union, and the United Kingdom all came in below 50, suggesting a faster rate of contraction. The presence of widespread tariffs is expected to continue weighing on business sentiment and consumer demand, potentially leading to rising unemployment and slowing growth.
In this environment, any short-term spikes in Brent and WTI prices are likely to remain opportunities to sell, unless there is a meaningful shift in underlying fundamentals. For a more detailed view of economic trends, please refer to the latest monthly report.
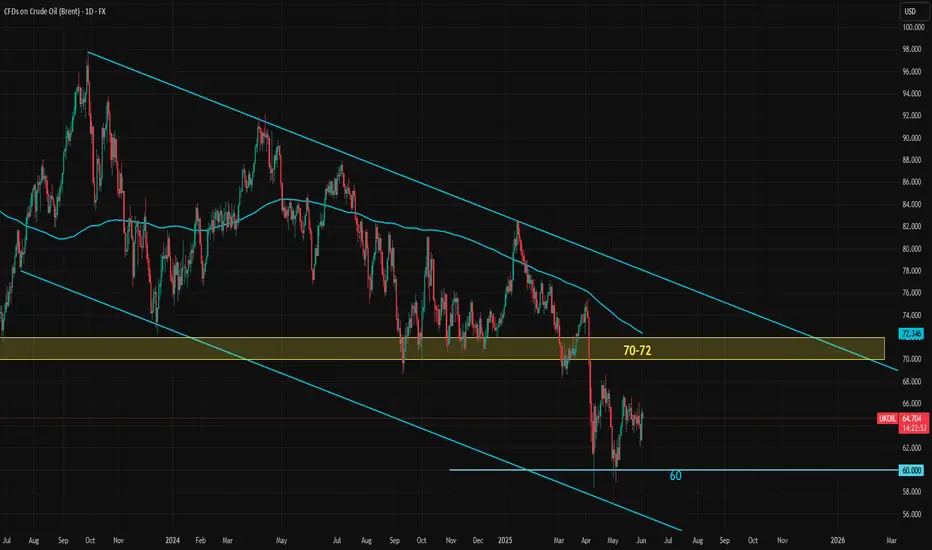
Brent crude has been in a steady downtrend since March of last year. While the price movement doesn't follow a perfect trend channel, the structure has generally held well. At the moment, Brent is hovering near the middle of this declining channel.
The former long-term support zone around $70 to $72. If prices move up toward this zone, it could present a fresh selling opportunity as long as the resistance holds. On the downside, the $60 level and the area just below it have formed a solid medium-term support, which has held up so far.
Still, oil bulls should be cautious around the $60 mark. Even though support looks strong for now, the overall direction of the trend and the broader fundamental backdrop suggest that this level could eventually break. Any long positions taken near current levels should factor in the potential for renewed downside pressure.
What to expect from WTI oil in the near term?We are currently not doing anything with WTI oil, but monitoring it very closely.
Let's dig in!
TVC:USOIL
MARKETSCOM:OIL
Let us know what you think in the comments below.
Thank you.
77.3% of retail investor accounts lose money when trading CFDs with this provider. You should consider whether you understand how CFDs work and whether you can afford to take the high risk of losing your money. Past performance is not necessarily indicative of future results. The value of investments may fall as well as rise and the investor may not get back the amount initially invested. This content is not intended for nor applicable to residents of the UK. Cryptocurrency CFDs and spread bets are restricted in the UK for all retail clients.

WTI OIL 1H Channel Up make or break Targets.WTI Oil (USOIL) has been trading within a Channel Up on the 1H time-frame that is supported by the 1H MA200 (orange trend-line). As long as this holds, we expect another +2.50% Bullish Leg (at least), which gives a Target of $63.55.
If the price breaks below the 1H MA200 though, we will take this small loss on the long and go short instead, targeting Support 1 at $60.60.
-------------------------------------------------------------------------------
** Please LIKE 👍, FOLLOW ✅, SHARE 🙌 and COMMENT ✍ if you enjoy this idea! Also share your ideas and charts in the comments section below! This is best way to keep it relevant, support us, keep the content here free and allow the idea to reach as many people as possible. **
-------------------------------------------------------------------------------
Disclosure: I am part of Trade Nation's Influencer program and receive a monthly fee for using their TradingView charts in my analysis.
💸💸💸💸💸💸
👇 👇 👇 👇 👇 👇

TA on WTI Oil - 2025.05.14Quick technical analysis on WTI oil.
Let us know what you think in the comments below.
Thank you.
77.3% of retail investor accounts lose money when trading CFDs with this provider. You should consider whether you understand how CFDs work and whether you can afford to take the high risk of losing your money. Past performance is not necessarily indicative of future results. The value of investments may fall as well as rise and the investor may not get back the amount initially invested. This content is not intended for nor applicable to residents of the UK. Cryptocurrency CFDs and spread bets are restricted in the UK for all retail clients.
