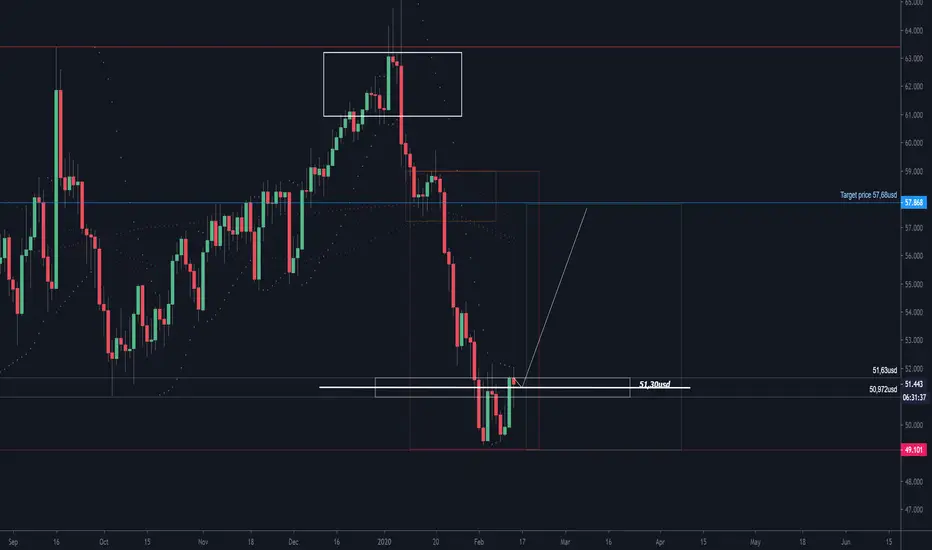
WTICOUSD Correctional Rise TP 51.37usd.WTICOUSD Correctional Rise TP 51.37usd. Oil started to make a correction. I recommend the following technique for trading this. The figure shows the yellow thin rectangle. This is the D1ATR range. Apparently, the oil rose higher, indicating that a further rise is expected. So I look forward to back testing to this level. This level is 45.89usd. From this level I move into a long position. The target price is 51.37usd. A STOP: 43.06usd RR: 2
WTI (Crude Oil)

WTICOUSD target price is 40usd.WTICOUSD target price is 40usd. The exchange rate seems to be building a double downward wave system.

WTICOUSD update.WTICOUSD update. The exchange rate can build a 2: 1 fractal copy. In case this process continues, we are done to finish copying the last fractal. So I'm looking forward to turning north from the 48,122 usd level.

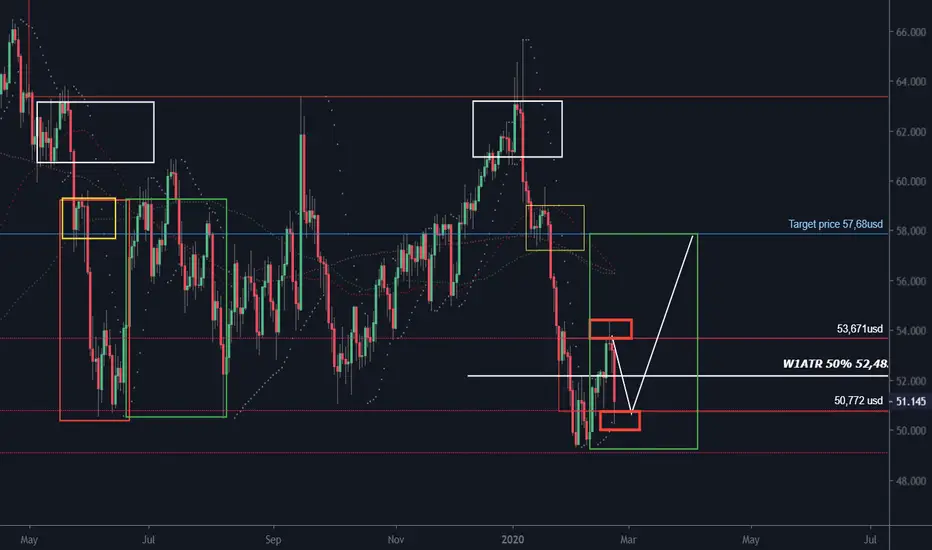
WTICOUSD I hold the long position.WTICOUSD I hold the long position. The exchange apparently tested the bottom of the W1ATR correction range. It is also visible (thick red rectangle) that you have created a "spike" symmetrically over this range. Therefore, my analysis of the ascent is still valid. The target price did not change either.
Oil to trade over $100 Beginning of 2019 we saw a change in character with a sharp bull move to 66.20 level end in May 2019.
Oil as been in a accumulation until February 2020 where we saw a run on equal lows. Sweeping out stops positioned below the 50.20 level then trading higher.
This area dips down into the buy zone of the 61.8 fib retracement level. Institutions are defending the 50.5 level with a higher move above $100 handle, with a projected target of 113.20

WTICOUSD increasing uptrend movement.WTICOUSD increasing uptrend movement. The white rectangle in the figure shows the daily correction range for WTICOUSD. We follow a similar set of rules to the previous XAUUSD analysis. In the event that the exchange rate is successfully north of the white line at 51.30usd, a strong uptrend will follow. 1. In case the exchange rate breaks down this level, we wait for the lower level of the white rectangle (daily correction channel). 2.When this breaks, we begin to reduce risk. If these latter two scenarios are missed, we can prepare for a stronger upward trend.
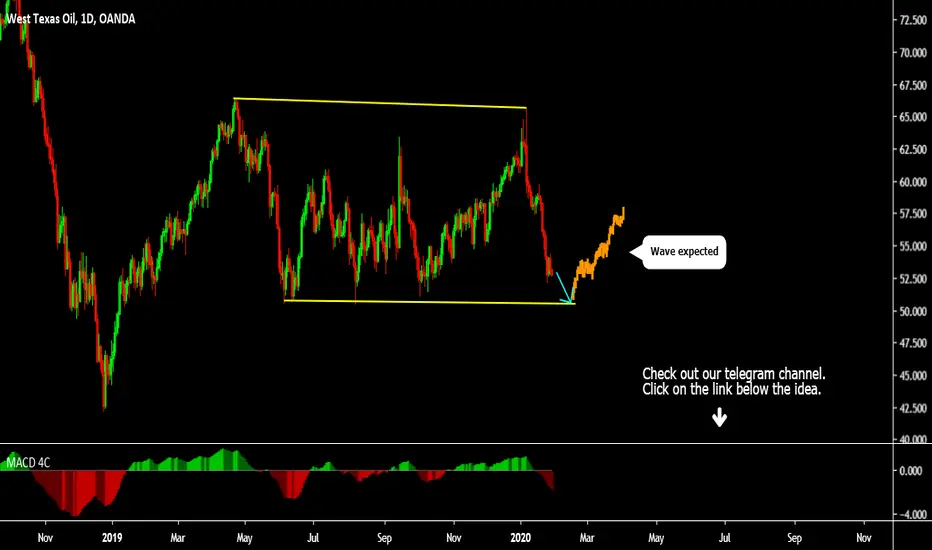
WTICO USD BUY (WEST TEXAS INTERMEDIATE CRUDE OIL - US DOLLAR)Hi there. Price is forming a continuation pattern to the upside. Wait for the price to complete the pattern and watch strong price action for buy.

WTICOUSD update. WTICOUSD update. WTI has reached the level where a H1ATR Stop level with 2RR TP: 57.68 usd target price to launch long position. Following the previous analysis.

WTICOUSD long waiting for entry.WTICOUSD long waiting for entry. A corrective phase has begun. I suppose the exchange rate could hit 49usd again. Creating this level (technically creating a double bottom formation), I look forward to turning north. The exchange rate is currently 1: 1 for fractal copying. The target price for the ascending wave sequence is 57.68usd

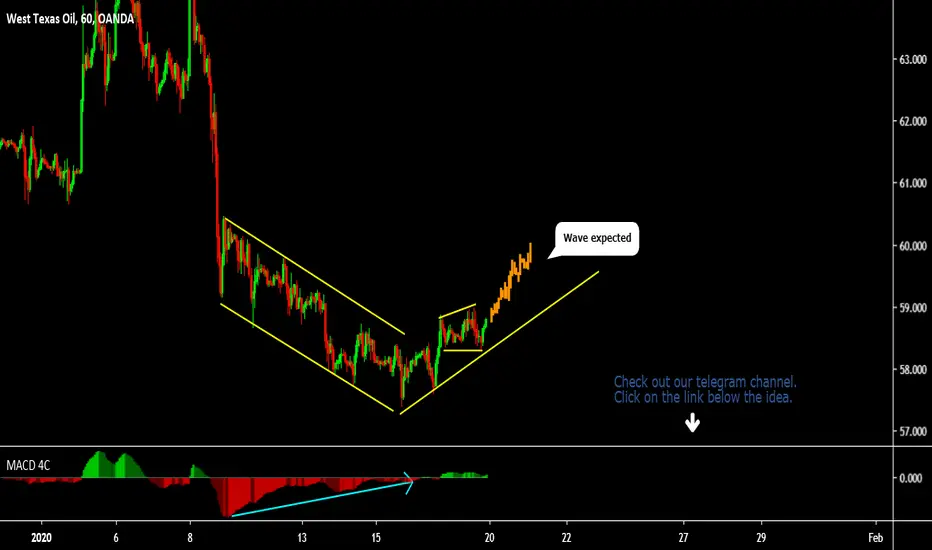
WTICOUSD BUY (WEST TEXAS INTERMEDIATE CRUDE OIL - US DOLLAR)Hi there. Wait for the price to hit the lower trendline and watch strong price action for buy.
West Texas Oil updateANALYSIS ON WTICOUSD
Welcome to my analysis
-
1HR CHart
-
Interesting Point of interest In the West Texas Oil.
- Price below 200 day EMA.
- look for sell signals.
- Watch top for sell.
- Watch line for break out to the downside.
- MACD showing bearish divergence
Stay Tuned

WTICO USD BUY (WEST TEXAS INTERMEDIATE CRUDE OIL - US DOLLAR)Hi there. Price is forming a continuation pattern to the upside. Watch strong price action at the current price for buy.

WTICOUSD long waiting for entry.WTICOUSD long waiting for entry. The analysis shows two fractals. If we look at the first fractal. You can see how the wave sequences are doubled within the fractal. We expect similar laws in the second fractal. But complicate it. The structure of the second fractal wave is basically larger than that of the first fractal. This is because the distance between the ATR closures (white narrow rectangle) is greater than the second fractal. Consequently, the amplitude of the second fractal volatility is also higher. This analysis was done in a 1W time frame. Therefore, I expect further correction up to the level of 56.32usd. I look forward to turning north again near the correction level. The next target price is 69.39 usd.

Oil look's great too....Been watching oil closely this days, so won't be surprised if oil reaches 80 or 42.....

In crude oil, 70 levels can be tried for a short time.Crude oil may rise in trade wars between the US and China with the prospect of an optimistic treaty.
I think both sides will sign the treaties.
Although it has provided opportunities for very lucrative trade since the beginning of December, prices can be expected to climb to higher levels.
However, short positions may increase after 64.5 - 65
Even in Overbought regions, the strong weekly signal and favorable weather in the trade agreements are the main points of my share of this analysis.Or you can use this analysis to look for opportunities to buy in case of hold on the price support.
Related ideas show a successful acceleration in the weekly outlook, and give us a good basis with optimistic bulletin between USA and China.
You can review.
You can modify your stop levels according to your leverage.
I think this analysis is much less risky with the following parameters:
RISK/REWARD RATIO : 1/3
POSITION SIZE : % 1
STOP-LOSS : 57.7
GOAL : 69.183

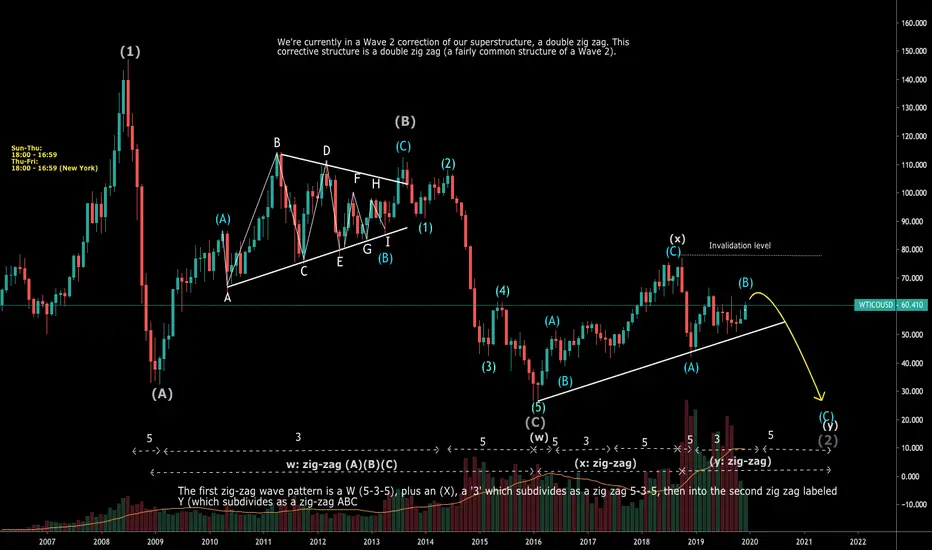
Intermediate Oil Cycle - Bearish Correction until 2022I've recreated an oil wave count chart using some other aides and guides. Hopefully it helps some of you out there. I'll be breaking it down into the daily chart as well. Note that we're not heading into reversal yet, as the candle combo has not yet appeared.
This analysis has helped me define my counts and our overall trend directions.
youtu.be


Can WTI Make the Six-day Winning StreakWTI rose to levels not seen since September 17 yesterday as weekly stockpiles data showed a reduction in reserves. Monthly Crude oil has climbed over 9% in December and is showing upward momentum.
Ultimately, the market looks as if it is trying to close through the resistance barrier that extends to the $62.50 level, so it’s likely that we will continue to see buyers come back in on dips. We don't have interest in shorting that market. But, of course, it could be susceptible to bits of exhaustion.
Overbought conditions of RSI indicator raise worries of a pullback towards psychological $60 level now. In event of a breakout there a fresh decline to 61.8% of the daily Fibonacci retracement at $58.63, can be expected.
Now the pair is struggling around 78,6% Fibo level (there is also the upper line of daily Bollinger Bands) and we're looking for Buy position in that area. Cause sustainable move above it could send the price higher to the September top at $63.33.
What is your positioning on that instrument?

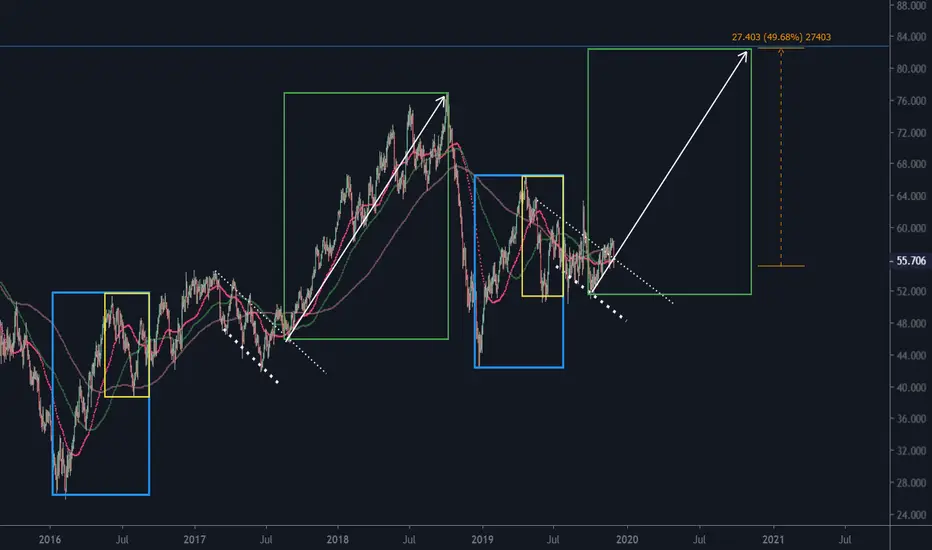
WTICOUSD before a 49% rise.... I suppose a fractal repetition can develop. The figure shows that in both cases the rise begins with an upward eruption from a descending channel. This is the scenario I am expecting right now. Therefore, in the coming time I will be looking for long positions in the oil price.
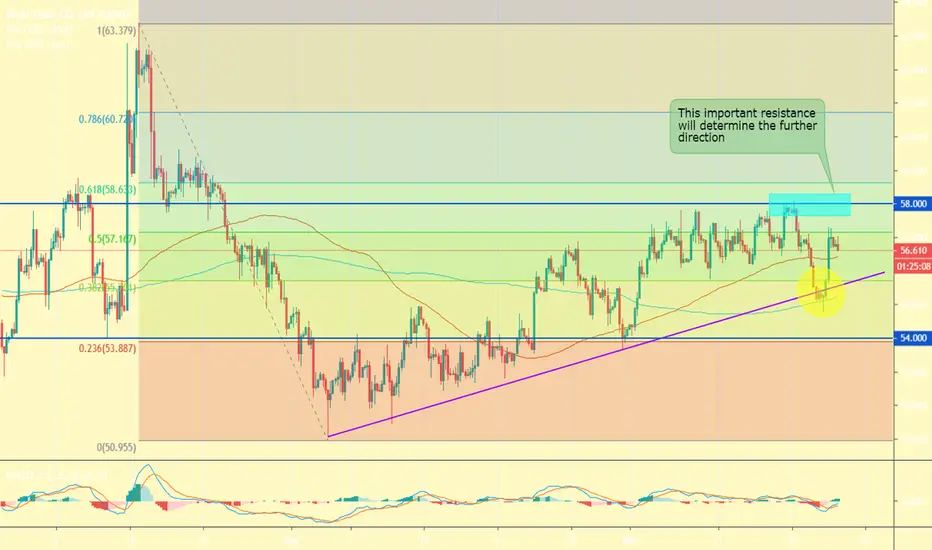
WTI Could Test $58 Key ResistanceOil posted its biggest percentage decline in nearly 2 months after reports indicated Russia is unlikely to lower production at the upcoming OPEC meeting. WTI dropped towards its 7-week support trend line, but after that rebounded from $ 55.00 and 200-day SMA on H4 chart.
Earlier on Wednesday, the EIA reported that overall Crude stocks rose 1.4 Mb, about in line with consensus for a 1.5 Mb. However, the market latched on to the fact inventories at Cushing fell 2.3 Mb barrels, the most significant drop in 3 months.
When you look out over the last couple of months, we essentially have been forming an uptrend and bullish channel, and as a result we could very easily go higher. The nearest resistance is near $57.17 at 50% Fibo level on the recent fall from 63.38 to 51.06 (4-hours). A clear break there will extend the rise for testing key resistance $58. It corespondent to the upper border of the current range. In that area the market could see a bit of market memory where sellers could come back in. Conversely, if the price fails to continue under $56.50, it could resume its decline.
Ultimately, we like the idea of buying short-term pullbacks. But we're looking for any type of major breakout in one direction or the other, since the market have found a bit of an equilibrium in the last month.
West Texas Oil - follow channelANALYSIS ON West Texas Oil
Welcome to my analysis
-
2HR CHart
-
Interesting Point of interest In the West Texas Oil pair.
- Price above 200 day EMA.
- look for buy signals.
- Expecting some minor downward movement.
- Watch 59.00 for take profit.
- MACD showing bullish divergence
Stay Tuned
