Market Analysis: WTI Crude Oil StrugglesMarket Analysis: WTI Crude Oil Struggles
Crude oil is showing bearish signs and might decline below $62.25.
Important Takeaways for WTI Crude Oil Price Analysis Today
- Crude oil price failed to clear the $65.60 region and started a fresh decline.
- There is a short-term bullish trend line forming with support at $62.25 on the hourly chart of XTI/USD.
WTI Crude Oil Price Technical Analysis
On the hourly chart of WTI Crude Oil, the price struggled to clear $65.60 against the US Dollar. The price started a fresh decline below $64.60.
The bears gained strength and pushed the price below $62.00. Finally, the price tested $61.20 and recently started a recovery wave. There was a move above $62.00, the 50-hour simple moving average, and the 23.6% Fib retracement level of the downward move from the $65.63 swing high to the $61.23 low.
The bears are now active near $63.00. If there is a fresh increase, the price could face a barrier near $63.05. The first major resistance is near the 50% Fib retracement at $63.40. The next stop for the bulls could be near $64.60. Any more gains might send the price toward $65.60.
Conversely, the price might start another decline and test a short-term bullish trend line with support at $62.25 and the 50-hour simple moving average.
The next major support on the WTI crude oil chart is $61.20. If there is a downside break, the price might decline toward $60.50. Any more losses may perhaps open the doors for a move toward $60.00.
This article represents the opinion of the Companies operating under the FXOpen brand only. It is not to be construed as an offer, solicitation, or recommendation with respect to products and services provided by the Companies operating under the FXOpen brand, nor is it to be considered financial advice.
Wticrude

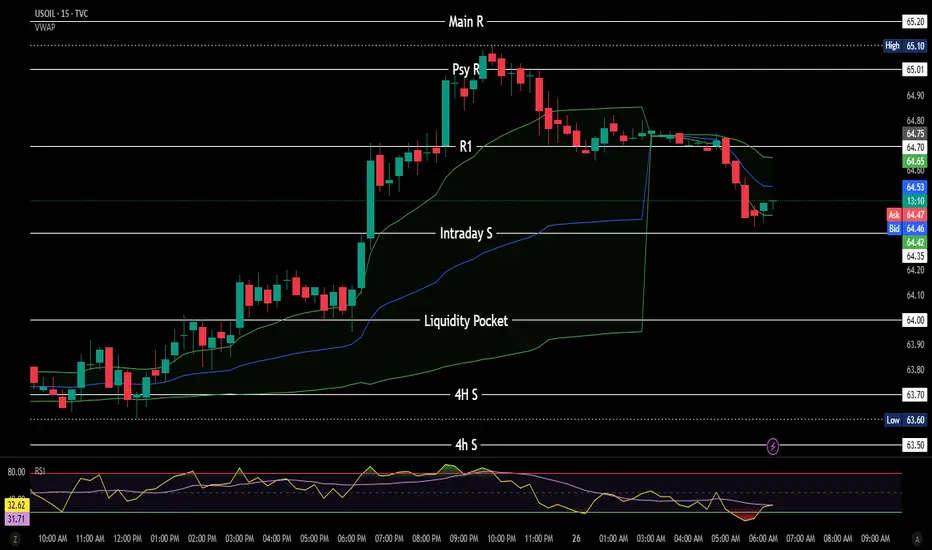
USOIL (WTI Crude) – Buy & Sell Trade Scenarios🔵 Bullish Scenario (Buy Call)
Entry Zone: Break and sustained close above 65.20 – 65.50 (current 4H resistance).
Reasoning:
Price has retested the 64.90 resistance cluster multiple times, suggesting absorption of supply.
Volume shows declining sell pressure near resistance – a sign of potential breakout.
A breakout with strong volume confirms buyers stepping in.
Target 1: 66.75 (measured move into next liquidity pool).
Target 2 (extended): 68.20 – 68.50 (previous structural pivot).
Stop Loss: Below 64.20 (false breakout protection).
R:R Potential: ~1:2.5 to 1:3
🔴 Bearish Scenario (Sell Call)
Entry Zone: Rejection at 65.00 – 65.50 resistance with bearish confirmation candle.
Reasoning:
This zone has acted as a strong supply area since mid-August.
Multiple wicks rejecting the level + increasing sell volume hint at distribution.
If price fails to close above resistance, sellers regain control.
Target 1: 63.00 – 63.20 (mid-support range).
Target 2 (extended): 62.00 – 61.90 (major support zone).
Stop Loss: Above 65.70 (wick protection).
R:R Potential: ~1:2 to 1:3
⚖️ Key Technical Takeaway
64.90 – 65.50 = Pivot zone (battle between bulls and bears).
Breakout + volume = bullish continuation to 66.75+.
Rejection + heavy volume = bearish rotation back to 62.95.

WTI Crude Oil Trading Analysis: 02-September-2025Week Ahead Plan: September 2-6, 2025
Analysis Period : August 26-30, 2025 Review | September 2-6, 2025 Outlook
Market : WTI Crude Oil Futures (CL1!)
Methodology : Dual Renko Chart System ($0.25/15min + $0.50/30min)
Current Price : $64.00 (August 30, 2025)
________________________________________
Strategic Outlook & Market Setup
Primary Scenario (70% Probability): Pullback First, Then Recovery
What to Expect : Market opens lower Tuesday ($63.00-63.50 range) due to bearish signal on short-term chart. This creates a buying opportunity if support holds.
Trading Plan:
Tuesday Opening : Expect gap down - don't panic, this was anticipated
Buy Zone : Look for entries between $62.00-63.50 (strong institutional support)
Confirmation Needed : Wait for short-term trend to flip bullish again before buying
Target : Still aiming for $66.50 but may take extra 3-5 days to get there
Secondary Scenario (25% Probability): Sideways Consolidation
What to Expect : Market trades in $63.50-64.50 range for several days while technical signals realign.
Trading Plan:
Strategy: Be patient - don't force trades in choppy conditions
Wait For: Clear breakout above $64.50 with volume
Risk: Could waste 1-2 weeks in sideways action
Low Probability Scenario (5% Probability): Immediate Continuation Up
What to Expect : Market gaps up above $64.25 and keeps rising.
Trading Plan:
Verify: Make sure both short-term and long-term signals turn bullish
Caution: Be skeptical without strong volume confirmation
Action: Can buy but use smaller position sizes until confirmed
________________________________________
Market Risk Factors & Monitoring
Critical Support Level : $62.00
Why Important: Massive institutional buying occurred here - if it breaks, the bullish case is dead
Action If Broken: Exit all long positions immediately, wait for new setup
Probability of Break: Low (15%) but must be respected
Key Events This Week :
Tuesday: ISM Services data (economic health indicator)
Wednesday: Weekly oil inventory report (could cause volatility)
Friday: Jobs report (affects overall market sentiment)
Warning Signs to Watch:
Technical: Short-term trend staying bearish for more than 3 days
Volume: Declining volume on any bounce attempts
Support: Any trading below $62.50 for extended periods
Time: No progress toward $66.50 target within 10 total trading days
Positive Signs to Look For :
Technical: Short-term trend flipping back to bullish (key confirmation)
Volume: Above-average volume on any recovery moves
Support: Strong buying interest at $62-63 zone
Momentum: Clean breakout above $64.50 with follow-through
________________________________________
Forward-Looking Adjustments
Modified Risk Management :
Position Size: Use 50% of normal position size until both timeframes align bullish
Stop Loss: Tighter stops at $62.75 (just below support zone)
Entry Patience: Don't chase - wait for pullback to support levels
Profit Taking: Be more aggressive taking profits at first target ($66.50)
Revised Entry Strategy:
Before Buying, Confirm ALL Three:
Price: Trading at or near $62-63 support zone
Technical: Short-term trend signal flips back to bullish
Volume: Above-average buying interest visible
Timeline Expectations :
Days 1-3: Expect pullback/consolidation phase
Days 4-5: Look for bullish confirmation signals
Days 6-10: Resume advance toward $66.50 target if signals align
Beyond Day 10: If no progress, reassess entire strategy
Success Metrics:
Minimum Goal: Protect capital during pullback phase
Primary Target: $66.50 within 2 weeks (revised from 1 week)
Risk Limit: Maximum 2% account loss if support fails
Time Limit: Exit strategy if no directional progress within 10 days total
Simplified Decision Framework :
Green Light to Buy: Price near $62-63 + Short-term trend bullish + Good volume Yellow Light (Wait): Mixed signals, choppy price action, low volume
Red Light (Exit): Price below $62, bearish trend continuing, time limit exceeded
________________________________________
Bottom Line : The bigger picture remains bullish, but short-term signals suggest a pullback first. Use any weakness to $62-63 as a buying opportunity, but only with proper confirmation. Be patient - the setup is still valid but timing may be delayed by a few days.
________________________________________
Document Classification : Trading Analysis
Next Update : September 6, 2025 (Weekly Review)
Risk Level : Moderate (controlled institutional setup)
This analysis represents continued validation of a systematic, institutional-grade trading methodology with demonstrated predictive accuracy and risk control capabilities. This is a view that represents possible scenarios but ultimate responsibility is with each individual trader.
Risk Disclaimer: Past performance does not guarantee future results. All trading involves risk of loss.
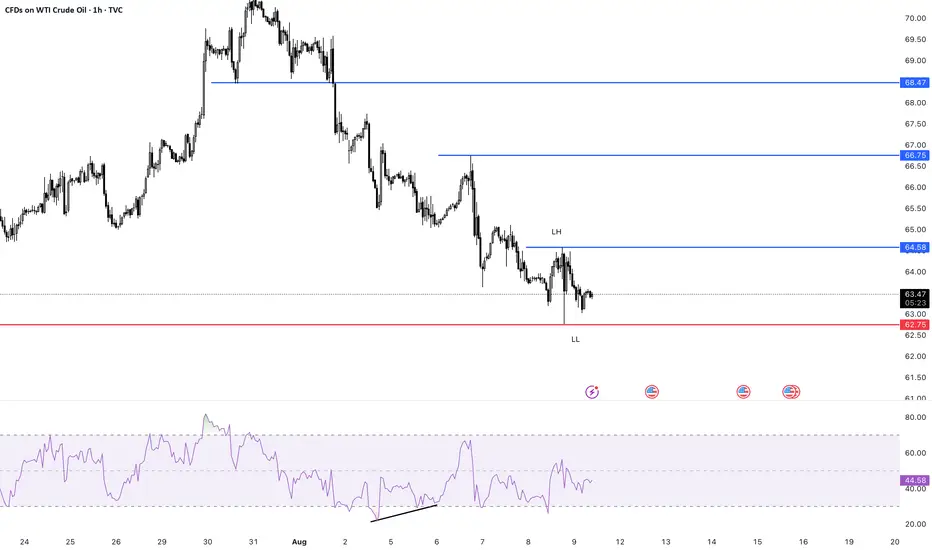
WTI Crude Oil – Range Support in FocusWe're waiting for price to reach the bottom of the range, and with a solid buy signal, we’ll consider going long.
However, since this level has been tested multiple times, it’s highly vulnerable to stop fishing — so caution is key.
As always, we’re ready for all scenarios:
If price breaks below, we’ll wait for a pullback to enter short.
But right now, we’re watching the range support for potential longs

Market Analysis: WTI Crude Oil Faces HurdlesMarket Analysis: WTI Crude Oil Faces Hurdles
Crude oil is showing bearish signs and might decline below $62.80.
Important Takeaways for WTI Crude Oil Price Analysis Today
- Crude oil prices failed to clear the $65.00 region and started a fresh decline.
- There was a break below a major bullish trend line with support at $64.00 on the hourly chart of XTI/USD.
WTI Crude Oil Price Technical Analysis
On the hourly chart of WTI Crude Oil, the price struggled to clear the $65.00 level and started a fresh decline below $64.50.
There was a break below a major bullish trend line at $64.00, opening the doors for more losses. The price dipped below the 50% Fib retracement level of the upward move from the $61.56 swing low to the $64.85 high.
XTI/USD even dipped below $63.50 level and the 50-hour simple moving average. The bulls are now active near $63.00. If there is a fresh increase, it could face a barrier near $63.70.
The first major resistance is near $64.10. Any more gains might send the price toward $64.85 and call for a test of $65.50. Conversely, the price might continue to move down and revisit the $62.80 support and the 61.8% Fib retracement.
The next major support on the WTI crude oil chart is $62.35. If there is a downside break, the price might decline toward $61.55. Any more losses may perhaps open the doors for a move toward $60.50.
This article represents the opinion of the Companies operating under the FXOpen brand only. It is not to be construed as an offer, solicitation, or recommendation with respect to products and services provided by the Companies operating under the FXOpen brand, nor is it to be considered financial advice.

WTI Steadies as Rate-Cut Bets and Supply Risks CollideWTI Steadies as Rate-Cut Bets and Supply Risks Collide
WTI crude hovered around $64 on August 25, steady after last week’s gains as traders balanced U.S. rate-cut expectations with geopolitical risks. The Fed is seen 85% likely to cut rates in September, boosting demand outlooks.
Supply concerns persist after Washington threatened 50% tariffs on Indian imports over Russian oil purchases, while India signaled it will keep buying from Moscow. Stalled Russia-Ukraine talks and renewed attacks on energy infrastructure add to uncertainty.

WTI Bull setupSwing trade
Bull points
- RSI div
- Wait for trend reversal
Put Buy stop on last Lower High or wait for HH and HL or reversal
RRR 1:1
Go for 1:2 manage your risk first...
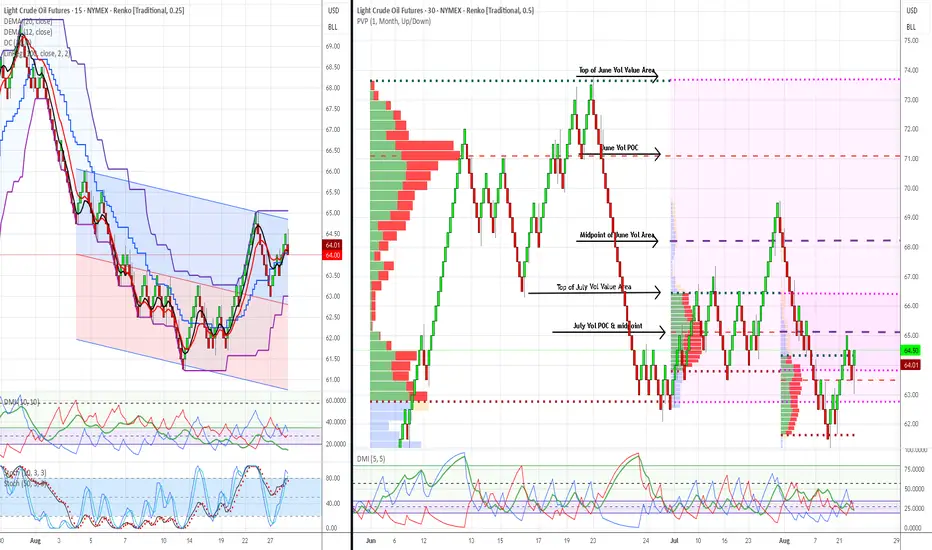
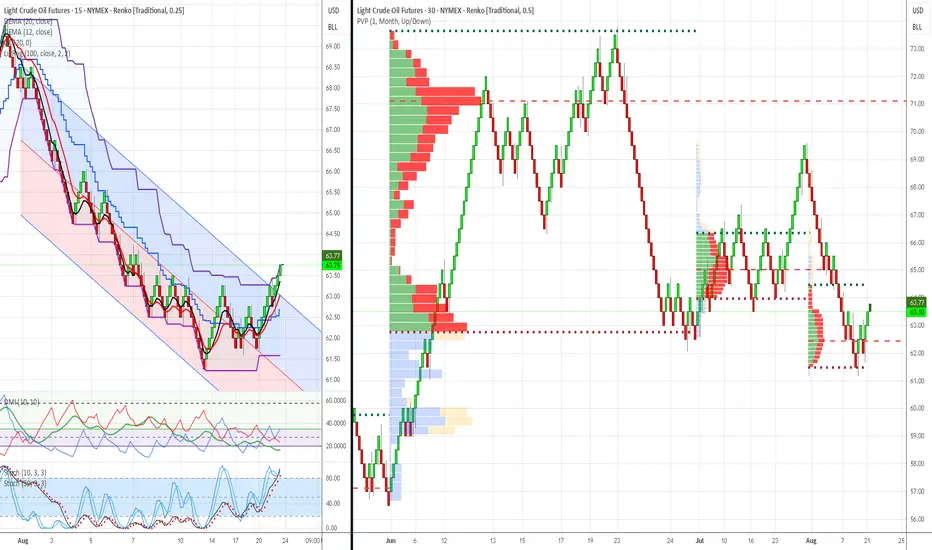
WTI Crude Oil Trading Analysis: June-August 2025 - 25-AugustWTI Crude Oil Trading Analysis: June-August 2025 Review & Week of August 25th Recommendations
Analysis Date : August 23, 2025
Market : WTI Crude Oil Futures (CL1!)
Methodology : Dual Renko Chart System ($0.25/15min + $0.50/30min)
Volume Profile : 3-Month Monthly Analysis (June-August 2025)
Executive Summary
Market Regime: Oil has completed a major corrective phase from $72 highs to $61 lows, establishing a clear bottoming pattern with strong institutional accumulation. Current setup presents high-probability bullish swing opportunity with excellent risk/reward characteristics.
Current Status : Bullish reversal confirmed with multiple technical confluences at critical support zone. Recommended positioning for upside targets with systematic risk management protocols.
3-Month Market Structure Analysis (June-August 2025)
Phase 1: Distribution & Breakdown (June-July)
Price Action: $72 → $61 (-15% decline)
June Peak: Heavy red volume distribution at $71-72 level indicated institutional selling
July Decline: Clean Renko downtrend with sustained selling pressure
Volume Profile: Minimal volume during decline, suggesting limited buying interest until $63-64 zone
Phase 2: Accumulation & Reversal Setup (Late July-August)
Price Action: $61 → $63.50 (+4% recovery)
Institutional Buying: Massive green volume accumulation at $63-65 level
Support Establishment: $62-63 zone showing strong buying interest
Technical Reversal: DEMA crossover confirmed bullish momentum shift
Volume Profile Key Levels (3-Month Analysis)
Major Support Zones :
$62-63: Primary institutional accumulation (heaviest green volume)
$60-61: Secondary support with moderate green volume
$58-59: Ultimate support level (limited historical volume)
Resistance Zones:
$66-67: First institutional resistance (mixed volume)
$69-70: Major distribution zone (heavy red volume from June)
$71-72: Ultimate resistance (peak selling pressure)
Current Technical Analysis (August 23, 2025)
Dual Chart Assessment
$0.50 Chart (Structure Analysis):
Trend: Clear bottoming pattern completed at $61 low
Current Position: Testing above major institutional accumulation zone
Volume Confirmation: Trading within heaviest 3-month green volume cluster
Structure: Higher lows pattern emerging since $61 bottom
$0.25 Chart (Execution Analysis):
DEMA Status: Bullish crossover confirmed (Black above Red at $63.00)
DMI/ADX: +DI gaining momentum, ADX rising through 25 level
Donchian Position: Price above basis, testing toward upper band
Recent Action: 3 consecutive green bricks confirming upward momentum
Technical Confluences Supporting Bull Case
Volume Profile: Massive institutional support at current levels
DEMA Crossover: Clear trend reversal signal confirmed
Momentum: DMI showing bullish shift with strengthening ADX
Structure: Higher low pattern vs. $61 bottom
Risk/Reward: Excellent positioning near major support zone
Market Context & Macro Considerations
Current Oil Market Dynamics
Supply: OPEC+ spare capacity at 5.9 million b/d (bearish)
Demand: China slowdown offset by US resilience (neutral)
Inventories: Below 5-year average (bullish)
Refining: Margins supporting crude demand (bullish)
Federal Reserve Impact
Policy Stance: Potential September rate cut (bullish for commodities)
Dollar Weakness: Could support oil prices
Inflation Expectations: Rising energy costs could influence policy
Seasonal Factors
Driving Season: Peak summer demand ending (bearish)
Hurricane Season: Atlantic activity potential (bullish)
Refinery Maintenance: September turnaround season (mixed)
Conclusion & Strategic Outlook
Near-Term Assessment (1-2 weeks): The current setup represents a high-probability swing trading opportunity with exceptional risk/reward characteristics. The combination of institutional volume support, technical reversal signals, and favorable market structure creates optimal conditions for bullish positioning.
Medium-Term Outlook (1-3 months): Successful navigation through the $66-68 resistance zone could establish a broader recovery toward $70-72 levels. However, macroeconomic headwinds and seasonal factors require careful position management and profit-taking discipline.
Risk Assessment: While the setup is compelling, traders must respect the institutional accumulation levels as ultimate support. Any violation of the $62 zone would invalidate the bullish thesis and require immediate position liquidation.
Strategic Advantage: The dual Renko chart system provides both structural clarity and tactical precision, enabling confident position sizing and systematic risk management. The monthly volume profile offers institutional-level insight typically unavailable to retail traders.
Document Classification: Trading Analysis & Recommendations
Risk Disclaimer: Past performance does not guarantee future results. All trading involves risk of loss.
Crude Oil Warning $66.40 Flip Signals $63.86 TargetWTI rolled over after failing near $68.66096 (top red dashed line). The breakdown through $66.40002 turned that level into resistance 🚧. After a sharp selloff, price is now hovering around the $65.54 area (thin entry line labeled 65.54232), just beneath the minor pivot band at 65.54 / 65.52 / 65.21 (green dashed cluster labeled 65.54232 • 65.52347 • 65.20824). The structure is lower-high → lower-low, which keeps momentum bearish while price holds below $66.40. If sellers keep control, the next magnet is the confluence support around $63.86661 (first lower green dashed line), with extension into $63.51000–$63.46746 if momentum accelerates.
You can also see repeated “S” tags on the push down from the high and into the mid-range, while the “B” tags cluster only at pullback lows—classic distribution behavior. Any spikes toward $66.07 (label 66.07275) and especially $66.40 should attract supply unless bulls reclaim and hold above that zone.
Trade setup 🎯 (from the chart):
• Entry: $65.54232 (≈ $65.54)
• Stop-loss: $66.07275 (≈ $66.07), conservative SL above $66.40002 if you prefer more room
• Targets: $63.86661 first take-profit; stretch targets $63.51000 → $63.46746
This offers a solid bearish R:R while price stays capped beneath $66.40. As it moves your way, book small profits 💰 at each objective, trail stops 🔒 (e.g., to $65.52 once under $65.21), and size the position to your own risk tolerance—WTI can spike on headlines.
Invalidation: A sustained reclaim and hold above $66.40 would neutralize the immediate bearish bias and open room back toward $68.66. Until then, the path of least resistance remains down 📉.

Market Analysis: WTI Crude Oil Struggles In RedMarket Analysis: WTI Crude Oil Struggles In Red
WTI Crude oil is also down and remains at risk of more losses below $62.00.
Important Takeaways for WTI Crude Oil Price Analysis Today
- WTI Crude oil prices extended losses below the $65.00 support zone.
- A major bearish trend line is formed with resistance at $63.05 on the hourly chart of XTI/USD.
WTI Crude Oil Price Technical Analysis
On the hourly chart of WTI Crude Oil, the price struggled to continue higher above $66.00 against the US Dollar. The price formed a short-term top and started a fresh decline below $65.00.
There was a steady decline below the $64.50 pivot level. The bears even pushed the price below $63.50 and the 50-hour simple moving average. Finally, the price tested the $62.15 zone, and the price is now consolidating losses.
On the upside, immediate resistance is near the 23.6% Fib retracement level of the downward move from the $65.98 swing high to the $62.15 low at $63.05. There is also a major bearish trend line at $63.05 and the 50-hour simple moving average.
The main hurdle is $63.50. A clear move above the $63.50 zone could send the price toward the 61.8% Fib retracement level at $64.50.
The next key resistance is near $66.00. If the price climbs further higher, it could face sellers near $68.00. Any more gains might send the price toward the $70.00 level.
Immediate support is near the $62.15 level. The next major level on the WTI crude oil chart is near $61.20. If there is a downside break, the price might decline toward $60.00. Any more losses may perhaps open the doors for a move toward the $55.00 zone.
This article represents the opinion of the Companies operating under the FXOpen brand only. It is not to be construed as an offer, solicitation, or recommendation with respect to products and services provided by the Companies operating under the FXOpen brand, nor is it to be considered financial advice.

USOIL rebounds from 6,300.0. Where next?USOIL rebounds from 6,300.0. Where next?
USOIL bounced back from the 6,300.0 mark on Tuesday, building on slight gains from the prior session, after President Donald Trump prolonged a tariff truce with China for an additional 90 days. The decision, made just before new tariffs were due, provided temporary relief from rising trade tensions that might hinder global growth and energy demand. The modest rise towards SMA50 and 6,500.0 level is expected. Market participants will also be waiting for OPEC’s monthly report, along with US EIA and IEA forecasts, for fresh supply–demand signals.

WTI Crude Oil Analysis – Is a Major Wave 3 About to Begin?🛢 WTI Crude Oil Analysis – Is a Major Wave 3 About to Begin? 🚀
According to Elliott Wave count, it appears that the corrective Wave 2 has either completed or is in its final stages. The (ABC) corrective structure, combined with reactions to key Fibonacci levels, suggests a potential end to the correction and the start of a powerful Wave 3.
Key Fibonacci Support Levels:
📍 $60.39 – 50% retracement
📍 $58.84 – 78.6% retracement
As long as price holds above these levels, the bullish structure remains intact, with the ultimate target for Wave 3 projected well above the previous all-time highs.
💬 What’s your view? Is crude oil ready for a historic move, or is there still room for more correction?
✅ Save this idea & follow for future updates.
-------------------------------------------------------------------------------------------------------------------
🚀 Who am I?
I'm Mahdi, a prop firm trader with 7+ years of experience in technical analysis, mainly focusing on Smart Money Concepts and Elliott Wave theory.
I specialize in delivering high-quality trading signals, market insights, and educational content tailored for serious traders and investors.
📊 My Tools: SMC, Elliott Wave, Fibonacci, Liquidity Grabs, Order Blocks
💼 Prop Challenge Passed: Yes | Funded Account: In Progress
🔗 Follow for consistent updates and trading insights.

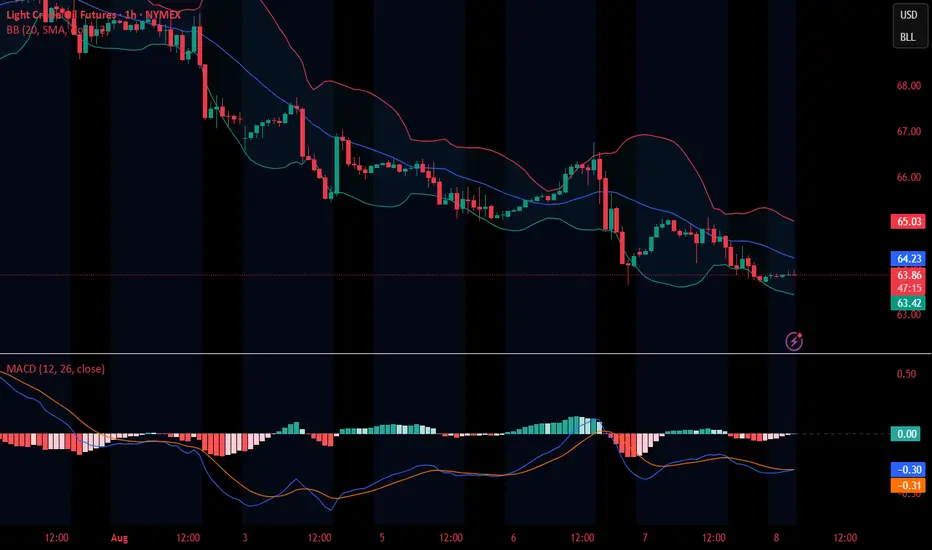
WTI(20250808)Today's AnalysisMarket News:
① Trump nominated Stephen Milan, Chairman of the White House Council of Economic Advisers, to serve on the Federal Reserve Board, with a term ending January 31, 2026.
② Waller is reportedly a leading candidate for the next Fed Chair.
③ U.S. Treasury Secretary Bensont stated that the interview process for the Fed Chair has begun.
④ Bostic stated that the July jobs report did change the Fed's outlook on its employment goals.
Technical Analysis:
Today's Buy/Sell Levels:
63.55
Support and Resistance Levels:
64.86
64.37
64.06
63.05
62.73
62.24
Trading Strategy:
If the price breaks above 63.55, consider entering a buy position, with the first target price being 64.06.
If the price breaks below 63.05, consider entering a sell position, with the first target price being 62.73.
WTI quick update. Will we see that 65-dollar break?After OPEC+ meeting, where a promise was made to increase production in September, WTI continues to slide. Let's dig in.
MARKETSCOM:OIL
TVC:USOIL
Let us know what you think in the comments below.
Thank you.
75.2% of retail investor accounts lose money when trading CFDs with this provider. You should consider whether you understand how CFDs work and whether you can afford to take the high risk of losing your money. Past performance is not necessarily indicative of future results. The value of investments may fall as well as rise and the investor may not get back the amount initially invested. This content is not intended for nor applicable to residents of the UK. Cryptocurrency CFDs and spread bets are restricted in the UK for all retail clients.

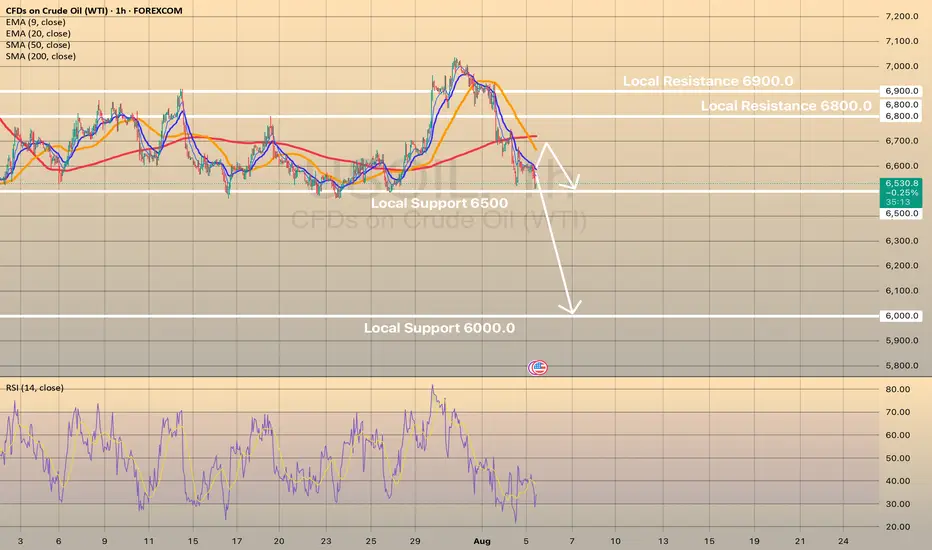
USOIL drops on rising supply and demand concernsUSOIL drops on rising supply and demand concerns
Oil prices fell Tuesday as OPEC+ planned a 547,000 bpd output increase for September, overshadowing potential Russian oil supply constraints from U.S. policies. Brent and WTI crude dropped to their lowest in a week, marking a fourth consecutive decline. OPEC+’s reversal of 2.5 million bpd cuts, combined with weak demand outlooks due to U.S. recession risks and China’s lack of new stimulus, pressured prices. Trump’s threatened 100% tariffs on Russian crude buyers like India, which imports 1.75 million bpd, heightened trade tensions but failed to lift oil prices. Analysts warn U.S. tariffs could further weaken global growth and fuel demand.
USOIL shows some in-moment strength on RSI on 1-h chart, the price may rebound towards sma200 at 6,700.00. However, in long-term perspective, low oil price is expected. Eventually, the price may decline towards level of 6,000.00.
WTI(20250805)Today's AnalysisMarket News:
Goldman Sachs: We expect the Federal Reserve to cut interest rates by 25 basis points three times starting in September; if the unemployment rate rises further, a 50 basis point cut is possible.
Technical Analysis:
Today's Buy/Sell Levels:
65.85
Support/Resistance Levels:
67.97
67.18
66.67
65.04
64.53
63.74
Trading Strategy:
If the market breaks above 65.85, consider buying, with the first target at 66.67. If the market breaks below 65.04, consider selling, with the first target at 64.53.
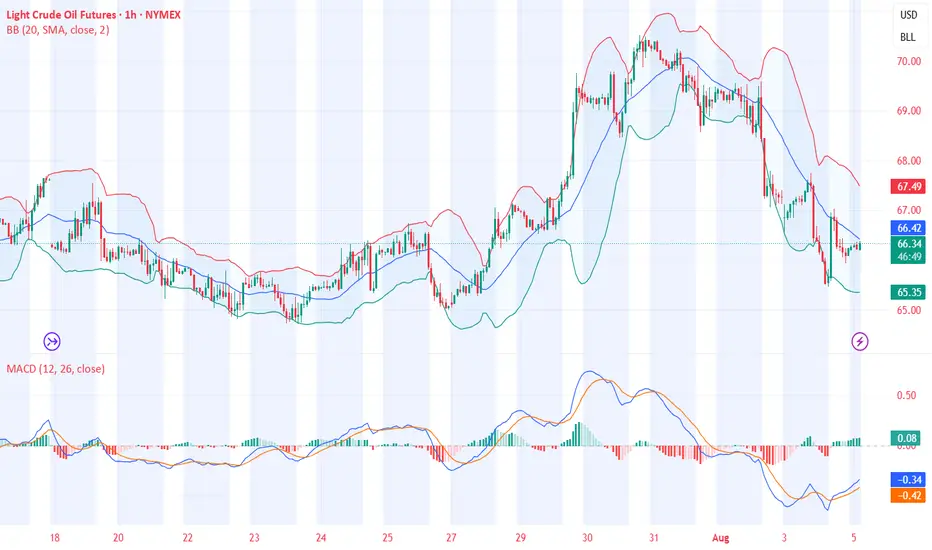
How long can the decline in US crude oil prices last?
💡Message Strategy
On Monday (August 4) during the Asia-Europe session, WTI fell for three consecutive days, with a drop of 1.16% today, trading around 66.55. OPEC+'s decision to increase production, coupled with geopolitical and economic policies, has jointly formed the expectation that oil prices will be "weak and volatile, dominated by downward pressure."
Short-Term: Increased Supply Drives Price Decline
OPEC+'s decision to increase production directly led to further declines in oil prices on Monday (Brent crude fell 0.28% to $69.23/barrel, and WTI fell 0.46% to $67.01/barrel), extending Friday's decline. Market expectations of oversupply reinforced bearish sentiment, particularly as the UAE's additional production increase (accounting for 2.4% of global demand) further amplified the signal of easing supply. However, India's announcement to continue purchasing Russian crude oil partially offset the impact, limiting the price decline and failing to shift the short-term downward trend.
Medium-Term: Supply-Demand and Policy Risks Intertwine
On the Supply Side: OPEC+'s production increase plan may be paused after September, as Goldman Sachs anticipates accelerated OECD inventory accumulation and fading seasonal demand support. However, if US shale oil production is forced to cut production at break-even points due to low oil prices, OPEC+ may adjust its strategy and even consider further releasing the remaining 1.66 million barrels/day of production capacity, which would continue to suppress oil prices.
Long-Term: Market Share Competition and Structural Overcapacity
OPEC+'s production increase strategy aims to reshape the global oil landscape by squeezing out high-cost producers, such as US shale oil, through low prices. Due to rising equipment costs driven by tariffs and low oil prices, US shale oil companies have cut capital expenditures, resulting in a decline in the number of active drilling rigs and a slowdown in production growth. This strategic game is likely to keep oil prices in a low range for a long time, with significant long-term downward pressure. Unity within OPEC+ and coordination between Saudi Arabia and the UAE will be key to policy implementation.
📊Technical aspects
Crude oil's short-term (1H) trend has reversed downward from its highs. The moving averages are diverging and aligning downward, indicating a downward trend in the short term.
The K-line chart has continued to close with small real bodies, and the MACD indicator is about to form a golden cross near the zero axis, signaling weakening downward momentum and a bullish bias on pullbacks. Crude oil is expected to remain weak and downward today, with a potential correction near $65.00.
WTI(20250729)Today's AnalysisMarket news:
After gold prices soared to an all-time high of more than $3,500 an ounce in April, the latest report from the Commodity Futures Trading Commission (CFTC) showed that fund managers have increased their bullish bets to the highest level in 16 weeks.
Technical analysis:
Today's buy and sell boundaries:
66.09
Support and resistance levels:
68.13
67.37
66.87
65.30
64.80
64.04
Trading strategy:
If the price breaks through 66.87, consider buying, the first target price is 67.37
If the price breaks through 66.09, consider selling, the first target price is 65.30

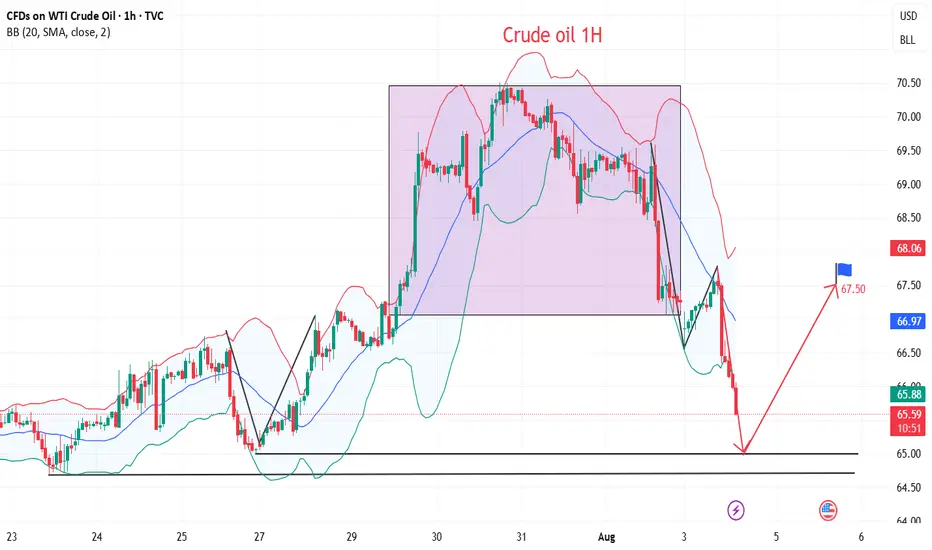
Market Analysis: Oil Prices Ease – Market Awaits Fresh CatalystMarket Analysis: Oil Prices Ease – Market Awaits Fresh Catalyst
WTI crude oil is also down and remains at risk of more losses below $64.60.
Important Takeaways for WTI Crude Oil Price Analysis Today
- WTI crude oil price continued to decline below the $66.00 support zone.
- It traded below a connecting bullish trend line with support at $65.60 on the hourly chart of XTI/USD at FXOpen.
WTI Crude Oil Price Technical Analysis
On the hourly chart of WTI crude oil at FXOpen, the price struggled to continue higher above $67.50. The price formed a short-term top and started a fresh decline below $66.00.
There was a steady decline below the $65.80 pivot level. The bears even pushed the price below $65.00 and the 50-hour simple moving average. The price traded below a connecting bullish trend line with support at $65.60.
Finally, the price tested the $64.75 zone. The recent swing low was formed near $64.73, and the price is now consolidating losses. On the upside, immediate resistance is near the $65.60 zone. It is close to the 50% Fib retracement level of the downward move from the $66.42 swing high to the $64.73 low.
The main resistance is $65.80. A clear move above it could send the price towards $66.40. The next key resistance is near $67.50. If the price climbs further higher, it could face resistance near $70.00. Any more gains might send the price towards the $72.00 level.
Immediate support is near the $64.60 level. The next major support on the WTI crude oil chart is near $63.20. If there is a downside break, the price might decline towards $60.00. Any more losses may perhaps open the doors for a move toward the $55.00 support zone.
This article represents the opinion of the Companies operating under the FXOpen brand only. It is not to be construed as an offer, solicitation, or recommendation with respect to products and services provided by the Companies operating under the FXOpen brand, nor is it to be considered financial advice.

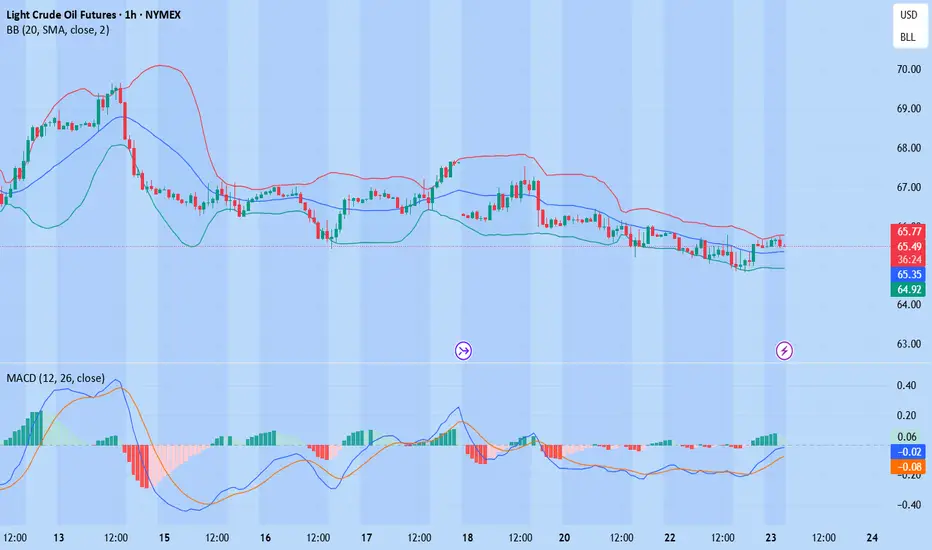
WTI(20250723)Today's AnalysisMarket news:
White House officials plan to visit the Federal Reserve headquarters on Thursday local time.
Technical analysis:
Today's buying and selling boundaries:
65.22
Support and resistance levels:
66.22
65.85
65.61
64.84
64.60
64.22
Trading strategy:
If the price breaks through 65.61, consider buying, the first target price is 65.85
If the price breaks through 65.22, consider selling, the first target price is 64.84
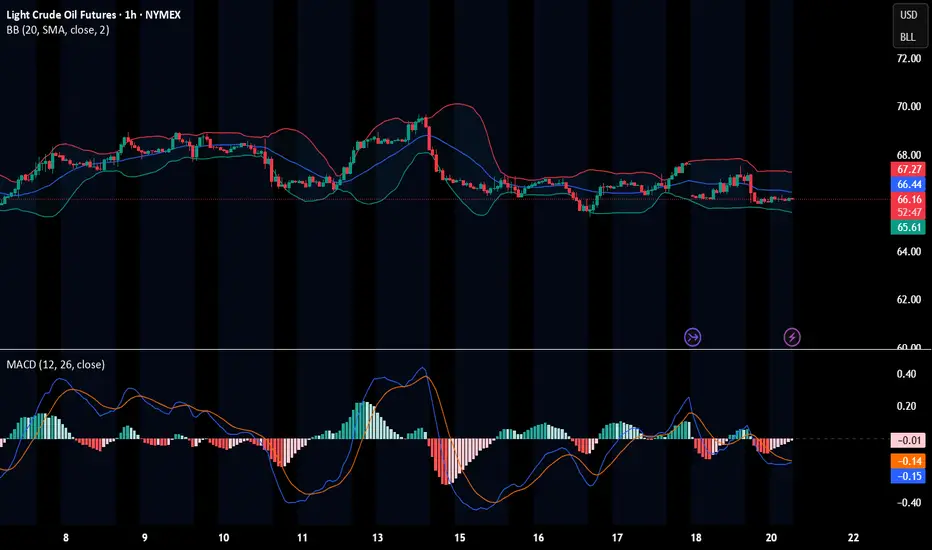
WTI(20250721)Today's AnalysisMarket news:
Waller refused to comment on whether he would dissent at the July meeting, saying that the private sector was not performing as well as people thought, and said that if the president asked him to be the chairman of the Federal Reserve, he would agree.
Technical analysis:
Today's buying and selling boundaries:
66.42
Support and resistance levels
68.00
67.41
67.02
65.81
65.43
64.84
Trading strategy:
If the price breaks through 66.42, consider buying, and the first target price is 67.02
If the price breaks through 65.81, consider selling, and the first target price is 65.43
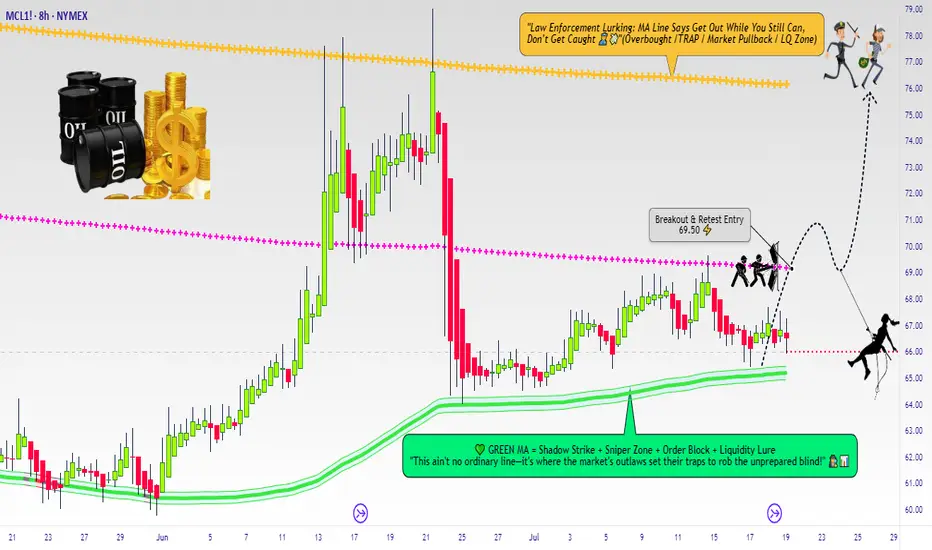
Micro WTI Swing Breakout Setup – Robbing Liquidity the Smart Way🛢️ "Crude Ops: The WTI Energy Vault Breakout Plan" 🛢️
(A Thief Trader Swing Setup | MA Breakout Trap Heist 💰💥)
🌍 Hola! Bonjour! Marhaba! Hallo! Hello Robbers & Market Movers! 🌟
Welcome to another high-voltage heist mission straight from the Thief Trading Den. This ain’t just a chart—this is an Energy Market Extraction Plan based on real smart money footprints 🔎.
🔥 Master Robbery Setup: MICRO WTI CRUDE OIL FUTURES 🎯
We got a bullish breakout alert from the shadows! This is not a drill.
💣 ENTRY STRATEGY
💼 "The Heist Begins Above 68.50"
Watch the Moving Average (MA) zone closely—this is where weak hands get trapped and we slide in with stealth limit or breakout orders:
🛠️ Plan of Entry:
Buy Stop Order: Just above 68.500 (after confirmation of breakout ✅).
Buy Limit Layering (DCA): On pullbacks around 15m/30m swing lows for precision entries.
🧠 Pro Tip: Use alerts to catch the exact entry ignition spark—don't chase, trap with patience like a true thief.
🛑 STOP LOSS (SL)
⚠️ "No SL? That’s a rookie mistake."
SL should only be placed post-breakout using the 8H wick-based swing low (around 66.50).
💡 SL is your personal vault door—set it according to:
Lot size
Risk appetite
Layered entry strategy
📌 Reminder: No SL or order placement before breakout. Let the market show its hand first.
🎯 TARGET ZONE (Take Profit)
Primary Target: 76.00 🏁
But hey... the smartest robbers escape before alarms ring — so trail that stop, secure your profits, and vanish like smoke 🥷.
💥 FUNDAMENTAL & SENTIMENT CATALYSTS
🔥 Current bullish energy comes from:
📉 USD weakness
🏭 Crude inventory drawdowns
⚖️ Geopolitical supply shocks
🐂 Hedge funds scaling long per latest COT data
📊 Intermarket cues from risk-on assets
🧠 Do your diligence: Go check fundamentals, COTs, and macro narratives before entering. Info = Edge.
📢 RISK MANAGEMENT NOTE
🚨 Don't go wild. Market is volatile, especially around:
News drops 📉
Fed or OPEC speeches 🎙️
Crude inventory reports 🛢️
Pause entries during news events. Use trailing SLs to lock the vault behind you.
❤️ SUPPORT THE ROBBERY MISSION
💣 Smash that BOOST button if this plan hits your nerve.
Let’s keep robbing liquidity zones together and growing the Thief Trader Brotherhood 🕵️♂️💰.
📡 Stay tuned for the next stealth heist drop. We rob the market with class. 💎🚀