Can geopolitics rescue oil from five-year lows?At some point this year there could be a strong opportunity to buy crude oil, as prices near USD 55 per barrel are potentially unsustainable.
WTI crude oil futures rose more than 3.5% on Thursday to trade above USD 57.9 per barrel, rebounding from a two-day slide. The move, however, was not enough to recover the losses earlier in the week, and prices remain close to the five-year low set in December.
Uncertainty around Venezuelan exports resurfaced after Washington announced plans to maintain indefinite control over the country’s crude sales.
Meanwhile, in Iran, protests have been reported in Tehran and other cities as inflation rises and the currency weakens, adding another layer of geopolitical risk for oil. Unlike Venezuela, Iran continues to export roughly 2 million barrels per day and produces between 3.2 and 3.5 million barrels per day, contributing a meaningful volume of global supply.
Wtioil

Oil Tries to Approach the $60 Level Once AgainOil prices have started the week with a notable bullish bias, posting gains of more than 1.5% in the short term. For now, buying pressure has remained firm, driven by rising geopolitical uncertainty stemming from growing tensions in Venezuela, which have begun to lift the risk premium for crude oil in the near term. Any scenario involving tighter U.S. sanctions, potential logistical disruptions, or direct frictions with the United States tends to immediately increase perceived risk in the oil market.
Venezuela remains a relevant global oil producer, so potential political disruptions could affect global crude supply in the short term. This dynamic appears to be influencing recent price action in the oil market. As long as uncertainty remains elevated, current buying pressure in WTI is likely to continue dominating price movements over the coming sessions.
The Bearish Trend Remains Relevant
Since June 20, 2025, average oil price movements have respected a well-defined bearish trendline, which continues to stand out as a key technical pattern on the chart. As long as buying pressure fails to clearly break above this structure, the bearish trend is likely to continue dominating market oscillations. However, a sustained breakout could pave the way for a more meaningful bullish bias, with prices holding above the 50-period simple moving average.
RSI
The RSI has managed to break above the neutral 50 level and maintains a consistent upward slope, indicating that average momentum over the past 14 sessions remains dominant. If the RSI continues to rise, it could reflect a renewed buying pressure in oil price action during the upcoming sessions.
MACD
Although the MACD remains relatively calm, its histogram has begun to hold above the zero line, suggesting that buying pressure is dominating short-term moving averages. As long as this behavior persists, it may continue to signal steady demand for oil in the short term.
Key Levels to Watch
$59 – Key resistance: A level where the bearish trendline converges with the 50-period simple moving average. Price action that manages to consolidate above this area could activate a dominant bullish bias, breaking the bearish structure that still attempts to prevail.
$57 – Nearby barrier: A recent neutrality zone. If price action once again consolidates around this level, it could signal the formation of a short-term sideways range.
$55 – Key support: The lowest level seen in recent weeks and the most relevant downside barrier to monitor. Selling pressure that pushes price back toward this area could revive a renewed bearish bias and extend the current bearish trendline.
Written by Julian Pineda, CFA, CMT – Market Analyst

WTI Oil: Bullish Structure Broken – Preparing for a Deep Drop?Crude Oil (WTI) is showing clear signs of a trend reversal from bullish to bearish after failing to break above the long-term descending trendline.
Technical Analysis:
Trendline Breakdown: Price has officially broken below the ascending support trendline.
Strong Resistance: The current retest is facing heavy selling pressure at the 57.300 zone, right below the major descending trendline.
Market Structure: A distribution phase has formed, confirming a short-term bearish shift with a series of lower highs.
Short Setup:
Entry Zone: 57.250 – 57.300 (Retest of the broken trendline).
Stop Loss (SL): 57.812 (Above the recent swing high).
Take Profit 1 (TP1): 55.945.
Take Profit 2 (TP2): 55.131.
⚠️ DISCLAIMER: This post is for educational purposes and personal opinion only; it is not financial advice. Trading indices involves significant risk, especially during low-liquidity holiday periods. Please Do Your Own Research (DYOR) and manage your risk strictly.

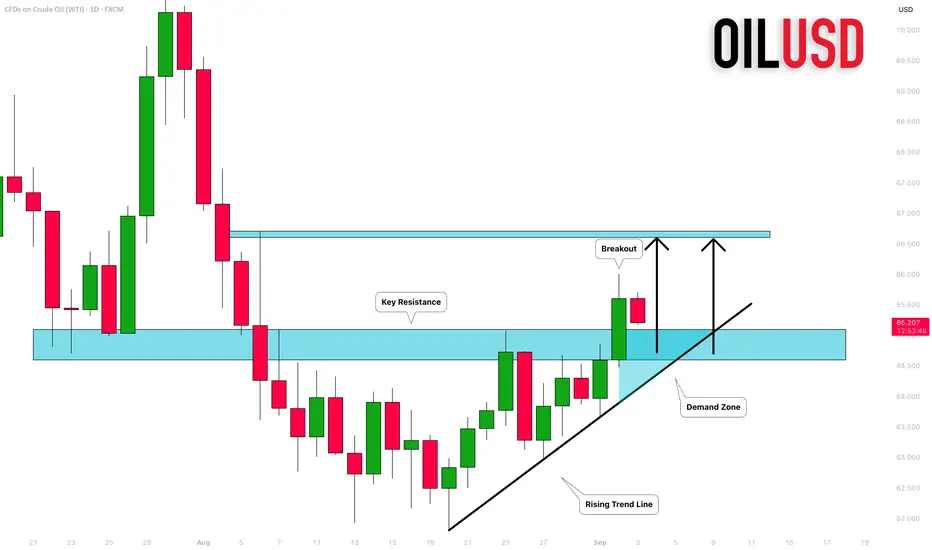
USOIL (WTI) – High-Probability Bullish Setup USOIL (WTI) – High-Probability Bullish Setup from Strong Demand Zone
🔍 Market Structure & Price Action Insight
USOIL is currently trading inside a well-defined and repeatedly tested demand zone between 55.10 – 56.50.
This zone has proven its strength by rejecting price three times in the past, each time producing a meaningful bullish reaction.
The current revisit into this zone offers a high-quality risk-defined buying opportunity for swing and positional traders.
📌 Trade Execution Plan (Bullish Bias)
🟢 Entry Zone:
55.10 – 56.50
🔴 Stop Loss:
50.00
(Below the demand structure to avoid false breakdowns)
🎯 Target 1:
64.00
(Previous structure + supply reaction area)
📊 Technical Confluence
✔ Multiple demand-zone validations
✔ Price reacting at historical accumulation area
✔ Clear structure-based invalidation level
✔ Favorable Risk : Reward profile
🧠 Professional Trading Insight
Strong trades are not created by prediction, but by location and confirmation.
When price revisits a proven demand zone, patience and discipline offer an edge. Entries taken close to demand provide superior psychology and controlled risk.
📈 Trade Management Note
Partial booking can be considered near intermediate resistance levels.
Trail stop only after structure confirmation — let the market do the work.

Will Crude Oil Rise or Fall?Crude Oil Futures (Jan 2026) - Market Analysis
Crude oil is trading at $58.39 per barrel, down 0.19%. Recent data show prices ranging from $58.12 to $58.62, indicating a period of consolidation. Key support is forming around $58.12, while resistance is at $58.62.
The overall momentum suggests limited near-term volatility, with the price hovering near its recent lows. Traders should watch for a breakout above resistance or a drop below support for the next directional move.
Stay tuned for further updates as market conditions evolve, and always manage risk
appropriately when trading futures.
#crudeoil #oilprices #trading #commodities #marketanalysis

WTI Oil Market Outlook: Sell Zones & Key LevelsOil is still respecting a broader downtrend structure with consistent lower highs and lower lows. Price recently reacted from the $62–63 resistance zone (trendline + supply) confirming another lower high and maintaining bearish momentum. As long as oil stays below this zone the chart suggests a continuation toward the downside with next supports sitting near $56.30, $52.50 and potentially $50.00 if bearish pressure accelerates.
Only a clean breakout above $63 with strong candles would invalidate this bearish outlook and shift momentum toward the $66–70 zone.
🔻 Sell Setup 1
- Entry Zone: 62.00 – 63.00
- Stop Loss: 63.80
- Targets: TP1 59.00, TP2 56.30, TP3 52.50
🔻 Sell Setup 2
- Entry: Break below 57.50 and retest
- Stop Loss: 59.20
- Targets: TP1 56.30, TP2 52.50, TP3 50.00
Note
Please risk management in trading is a Key so use your money accordingly. If you like the idea then please like and boost. Thank you and Good Luck!

WTI Crude Returns to the Year’s LowsIn recent trading sessions, WTI crude oil has posted three consecutive losing sessions, recording a decline of more than 4.7% in the short term. Selling pressure remains steady, driven by concerns over a potential market oversupply, especially with the upcoming OPEC+ meeting in December. Additionally, weaker market confidence has raised expectations of lower short-term demand for oil, reinforcing a sense of uncertainty in crude price movements. If this trend persists, it could result in stronger selling pressure in the coming sessions.
Downtrend Remains Firm
For now, the downward movements have maintained a bearish trendline that has persisted over recent months. So far, buying attempts have not been strong enough to challenge this structure. As the price approaches the year’s lows, the downtrend could become even steeper in the coming sessions.
RSI
The RSI indicator continues to show consistent oscillations below the neutral 50 level, suggesting that the average momentum over the past 14 sessions remains predominantly bearish. If the RSI continues to decline, this could indicate stronger selling pressure in the next few sessions.
TRIX
Meanwhile, the TRIX indicator remains below the neutral 0 level, signaling that the average strength of the exponential moving averages continues to favor a bearish bias. As long as this sentiment persists, selling momentum is likely to remain dominant in WTI crude’s price action.
Key Levels to Watch:
$57 – Key Support: Represents the year’s low zone and serves as the main bearish barrier. A break below this level could reinforce the ongoing downtrend and extend selling pressure in the coming sessions.
$60 – Nearby Barrier: Corresponds to the 50-period simple moving average. Price movements returning to this level could trigger indecision and lead to a short-term sideways range.
$64 – Major Resistance: Aligns with the 200-period moving average and represents the most important bullish barrier in the short term. If the price reaches this level, it could revive buying momentum and challenge the current bearish structure.
Written by Julian Pineda, CFA, CMT – Market Analyst

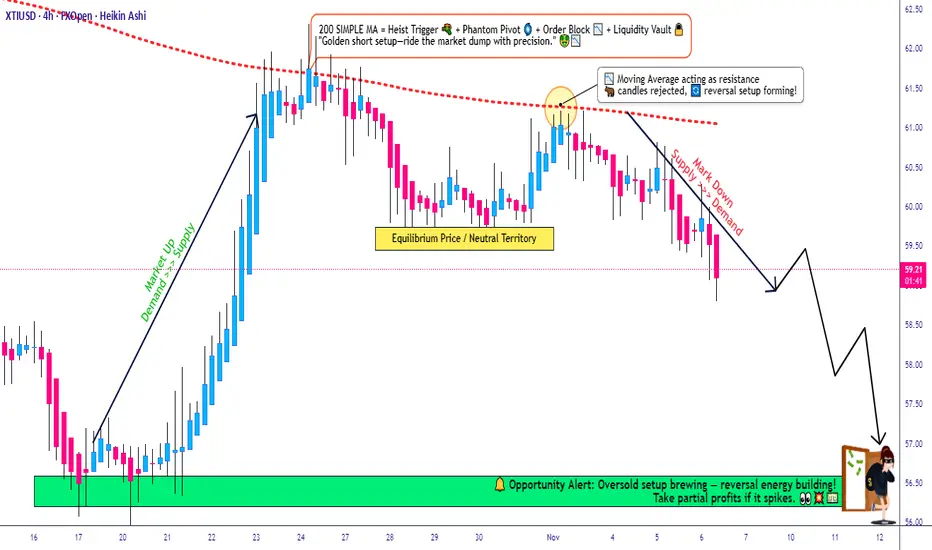
Is XTI/USD Setting Up for a Sharp Bearish Correction?🚨 WTI/USD CRUDE OIL: THE BEARISH HEIST AWAITS 🎯
═══════════════════════════════════════════════════════════
THE SETUP: Breaking Down The Crime Scene 🕵️♂️
We're executing a bearish pullback strategy on WTI/USD spot crude oil, leveraging the 200-period Simple Moving Average (SMA) as our primary technical confirmation. The energy sector is flashing opportunity signals, and it's time to work the levels like a seasoned professional.
📊 STRATEGY FRAMEWORK
Market Direction: Bearish Pullback from 200 SMA Resistance
Timeframe: Suitable for Swing & Day Trading Operations
Asset Class: Energies | WTI Crude Oil Spot
💰 THE LAYERED ENTRY STRATEGY (Multi-Level Approach)
This is where the Thief Method shines—stacking limit orders at key price levels to accumulate positions as the market comes to you:
Suggested Entry Layer Points:
Layer 1: 60.50 💧
Layer 2: 60.00 💧
Layer 3: 59.50 💧
Layer 4: 59.00 💧
⚠️ Pro Tip: Feel free to add or adjust layers based on your risk tolerance and position size. The beauty of this method is scalability—customize to YOUR account size and risk parameters.
🛑 STOP LOSS PLACEMENT
Primary SL Level: 61.00
Positioned at the nearest swing high/candle wick resistance above our entry cluster. This respects natural market structure and gives us a defined, measurable risk point.
⚡ DISCLAIMER ON RISK MANAGEMENT:
This is NOT financial advice. Risk management is YOUR responsibility. The suggested SL is based on technical structure, but YOU control your account. Set stops that align with YOUR risk tolerance. Trade only what you can afford to lose.
🎯 PROFIT TARGET STRUCTURE
Primary Target: 56.50
Secondary Support Level: 56.00 — A police barricade of strength where multiple factors converge:
Strong historical support confluence 📍
Oversold zone recognition ⚖️
Potential reversal trap (exit strategy alert) ⚠️
Exit Strategy: Consider banking profits at 56.50 before support intensifies at 56.00. Lock in gains as the technical structure suggests potential friction.
⚡ DISCLAIMER ON PROFIT TARGETS:
Again, these are TECHNICAL levels only. YOU decide your exit strategy. Whether you take full profits at 56.50, trail stops, or use partial exits—this is YOUR trading plan. No setup is guaranteed.
🔗 RELATED PAIRS TO WATCH (Correlation Check)
Understanding energy market interrelations helps you spot confirmation signals:
US Dollar Index ( TVC:DXY ) → Inverse correlation to crude oil. Strengthen USD = Bearish pressure on oil. Watch DXY for confirmation of our bearish bias.
CSEMA:S&P 500 ( AMEX:SPY / CME_MINI:ES1! ) → Risk sentiment indicator. If equities weaken, crude often follows bearish patterns. Check equity trends for macro confirmation.
Energy Select Sector ETF ( AMEX:XLE ) → Direct correlation. Tracks large-cap energy stocks. Oil weakness often precedes XLE drops.
FX:EURUSD → Global risk sentiment. Weak euro = risk-off environment = potential crude weakness. Monitor for macro context.
AMEX:USO (Crude Oil ETF) → Direct oil tracking instrument. Moves in lockstep with WTI. Use for backup confirmation.
📋 THE THIEF STRATEGY CHECKLIST
✅ Confirm 200 SMA as resistance/bearish context
✅ Stack limit orders—don't chase price
✅ Define your personal stop loss (around 61.00 structure)
✅ Target scale-outs near 56.50-56.00
✅ Use correlation pairs for macro confirmation
✅ Manage position size ruthlessly
✅ Accept losses—they're tuition in the market
💬 ENGAGEMENT BOOST
✨ If you find value in my analysis, a 👍 and 🚀 boost is much appreciated — it helps me share more setups with the community!
#WTI #CrudeOil #EnergyTrading #TechnicalAnalysis #ThiefStrategy #SwingTrading #DayTrading #Trading101 #ForexEnergy #MultiLayerEntry #RiskManagement #TradingSetup #FinancialMarkets #Energies #TradingCommunity
CRUDE OIL (WTI): Strong Selling Imbalance
Look at a large selling imbalance candle that was formed
on an hourly time frame after a test of falling trend line on a daily.
I think that there is a high chance that WTI Crude Oil will
continue falling now.
Goal - 59.6
❤️Please, support my work with like, thank you!❤️
I am part of Trade Nation's Influencer program and receive a monthly fee for using their TradingView charts in my analysis.

WTI(20251106)Today's AnalysisMarket News:
US ADP employment rose by 42,000 in October, the largest increase since July 2025, exceeding market expectations of 28,000. The US ISM non-manufacturing PMI for October came in at 52.4, a new high since February 2025.
Technical Analysis:
Today's Buy/Sell Threshold:
60.27
Support and Resistance Levels:
61.30
60.91
60.66
59.87
59.62
59.23
Trading Strategy:
Consider buying if the price breaks above 60.27, with a first target price of 60.66.
Consider selling if the price breaks below 59.87, with a first target price of 59.62.

Oil’s Bottom Is on Its Last Breath — A Major Rally Is ImminentPrevious analysis:
Update is on the chart above 👆
The downside we were hunting looks near completion; in time terms, the correction also appears done.
Wave structure points to the end of wave 2 and the start of a powerful wave 3 up. Failed downside breaks and liquidity sweeps of recent lows back this view.
Confluence: demand retest, deep fib retrace (around 78–88%), and weakening seller momentum at the latest lows.
Roadmap: once this phase completes, I’m looking for an impulse toward $110—with momentum building as price reclaims 65 and then 81.
Risk: even if this setup gets stopped, I’ll keep looking for long entries—trend context and timing still favor upside continuation.
Macro angle: a major oil spike is rarely just a chart pattern—it’s a stress signal. What crisis is this foreshadowing? Middle East? Or something broader and global on supply/demand?
If this resonates, save & follow for the next updates. (Not financial advice.)

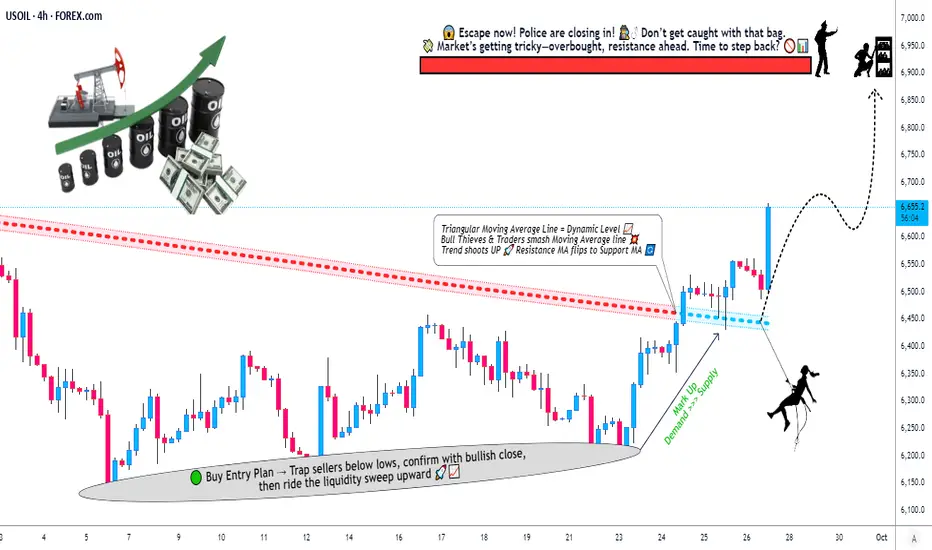
Crude Oil Trading Map: Bullish Momentum vs Key Resistance🛢️ WTI Crude Oil (USOIL/XTIUSD) – Energies Market Wealth Strategy Map ⚡
🎯 Trade Plan (Swing/Day Trade Vibe)
📌 Bias: Bullish setup confirmed by Triangular Moving Average dynamic resistance breakout.
💰 Entry (Thief Layering Strategy):
We don’t just walk in the front door — we layer like true OG’s.
Buy Limit Layers: 6450, 6500, 6550, 6600
You can always add more “layers” depending on your conviction & style.
🛑 Stop Loss (Thief Escape Plan):
Suggested SL: 6350
⚠️ Note: Dear Ladies & Gentlemen (Thief OG’s) — I’m not recommending you use only my SL. Risk is yours, profit is yours. Protect your bag your way.
🎯 Target Zone (Profit Heist Exit):
First escape point: 6900
Above here? Careful. Around 6950 sits a Police Barricade 🚔 (Resistance + Overbought Trap). That’s where the chase gets real — don’t overstay!
🔑 Key Notes for the Thief OG’s:
Layering Strategy: Spreading entries reduces exposure & maximizes flexibility.
Dynamic Resistance Breakout: Momentum shift confirms bulls are sneaking in.
Psychological Trap @6950: Overbought zones = potential reversals.
🔗 Correlation & Related Pairs to Watch:
TVC:USOIL / FXOPEN:XTIUSD (Primary Chart)
BLACKBULL:BRENT / TVC:UKOIL → Closely tracks WTI, sometimes diverges.
FX:USDJPY & TVC:DXY → Oil often inversely correlated with the US Dollar.
OANDA:XAGUSD & OANDA:XAUUSD → Commodity cousins, useful for cross-market sentiment.
FOREXCOM:SPX500 & NASDAQ:NDX → Risk-on sentiment can boost crude oil demand outlook.
✨ “If you find value in my analysis, a 👍 and 🚀 boost is much appreciated — it helps me share more setups with the community!”
⚠️ Disclaimer: This is a Thief Style Trading Strategy — just for fun and market education. Not financial advice. Trade at your own risk.
#USOIL #XTIUSD #CrudeOil #WTI #EnergyMarkets #SwingTrade #DayTrading #TechnicalAnalysis #TradingStrategy #ThiefStrategy
Oil market sentiment remains bearish near termOil market sentiment remains bearish near term
Oil prices slipped as supply glut fears and renewed U.S.–China trade tensions weighed on sentiment.
The IEA projected a potential 4 million bpd surplus in 2026, citing rising OPEC+ output and weak demand. Massive oil volumes in transit and storage are expected to reach key hubs soon, adding to oversupply pressure.
Trade friction between Washington and Beijing intensified after new tariff threats and export curbs, raising concerns over slower global growth and lower energy demand.
Analysts note that geopolitical risk has faded, shifting focus to inventory data. Traders await U.S. crude and gasoline stock reports due Oct. 15, with expectations of a 200,000-barrel rise in crude inventories and draws in fuel products.
Outlook:
Market sentiment remains bearish near term, with weak demand signals and high supply overshadowing minor geopolitical support.

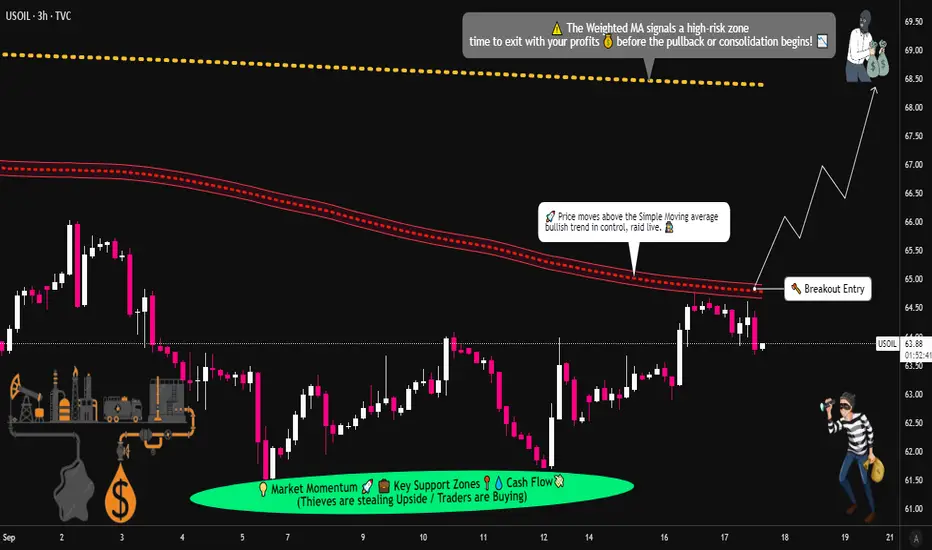
Can USOIL Break Higher? SMA Breach & Target at $68🛢️ USOIL Energy Market | Cash Flow Management Strategy (Swing/Day Trade)
📌 Trading Plan:
👉 Bias: Bullish (pending order setup)
👉 Confirmation: When Simple Moving Average (SMA) is breached by buyers, trend confirmation is valid.
👉 Entry Style: Layered buy-limit entries after breakout confirmation (Thief Strategy 🕵️♂️ = multi-layer entry).
📥 Layered Buy Limit Orders (example setup):
64.00 ✅
64.50 ✅
65.00 ✅
65.50 ✅
(You can increase the number of layered entries based on your own style — flexibility is the thief’s edge!)
⚠️ Important: Buy-limit layers are only valid AFTER breakout confirmation. Do not jump in without confirmation.
🎯 Risk Management (SL & TP):
📌 Stop Loss (Protective Level)
Example stop placement: 63.50
(🔑 Note: This is my style. Manage risk in your own way — never copy-paste without adapting!).
📌 Target Zone
Projected resistance near 68.00, aligned with:
Weighted Moving Average (WMA) resistance
Overbought conditions
Possible “trap” zone ⚠️
💡 Best approach: Secure profits step by step. Escape once the target region is approached.
📢 Note for Traders (Thief OG’s):
I’m not recommending only my SL or my TP. This is just a framework. You’re responsible for your own money management, profits, and exits. Trade at your own risk, and take the bag when you feel it’s right. 💰
🔗 Correlation & Related Pairs to Watch:
Energy markets are heavily correlated across multiple assets:
🛢️ TVC:USOIL / BLACKBULL:WTI – Main setup
🛢️ BLACKBULL:BRENT – Moves in sync with USOIL, watch for confirmation
💵 TVC:DXY – Stronger USD often pressures crude oil prices
💹 AMEX:XLE (Energy Sector ETF) – Tracks US energy stocks, gives indirect flow confirmation
🪙 FX:NGAS – Energy sector cousin, can sometimes give early signals of demand shifts
Keep an eye on these related pairs/assets for flow confirmation and stronger conviction.
🧾 Key Points Recap:
✔️ SMA breach = buyers’ control confirmed
✔️ Layered entries (Thief Strategy 🕵️♂️)
✔️ Stop loss = personal choice (mine @63.50)
✔️ Target = 68.00 escape zone
✔️ Risk & reward = your own responsibility
✔️ Watch related assets for confirmation
✨ “If you find value in my analysis, a 👍 and 🚀 boost is much appreciated — it helps me share more setups with the community!”
#USOIL #WTI #CrudeOil #EnergyMarkets #SwingTrade #DayTrade #TradingStrategy #PriceAction #ThiefStrategy #LayeredEntries #XLE #BRENT #DXY #NGAS
WTI with bearish momentum dominatingDue to a larger-than-expected increase in crude oil inventories, WTI prices fell. From the daily chart perspective, oil prices have broken below the lower edge of the trading range, and the medium-term objective trend is downward. Currently, oil prices are fluctuating near the lower edge of this range. The fast and slow lines of the MACD indicator are below the zero line, with bearish momentum dominating. It is expected that the probability of oil prices moving in an oscillating downward pattern in the medium term is relatively high.
Sell 60 - 60.2 TP 59 - 59.5 SL 60.5
Daily-updated accurate signals are at your disposal. If you run into any problems while trading, these signals serve as a reliable reference—don’t hesitate to use them! I truly hope they bring you significant assistance

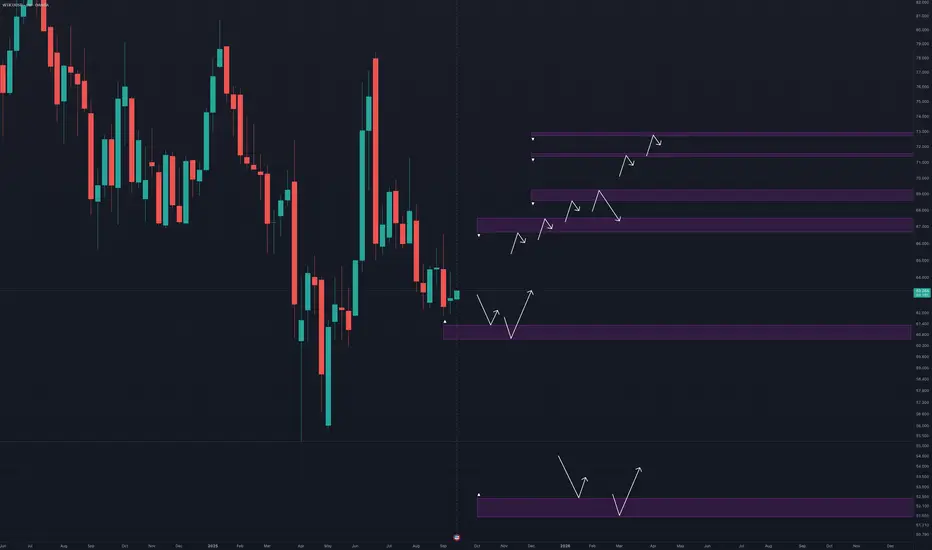
WTI Crude Oil🔹 I’ve marked the key resistance zones.
🔹 If I see a reversal signal at any of these levels, I’ll go short.
🔹 The breakout scenario is always valid too—if a level breaks, I’ll take the trade in the direction of the market.
🚫 No bias towards numbers, levels, or analysis.
✨ The key is to flow with the market, not fight it. If you try to stand against it, the market won’t just take your money—it will crush your confidence too.
🎯 We’re only a small part of a bigger picture. Stay flexible, stay unbiased.

CRUDE OIL (WTI): Pullback Trade From Support
WTI Crude Oil looks oversold after a test of a significant
daily horizontal demand zone.
A formation of a bullish imbalance candle on an hourly time frame
indicates a strength of that structure.
With a high probability, the price will pull back to 62.38
❤️Please, support my work with like, thank you!❤️
I am part of Trade Nation's Influencer program and receive a monthly fee for using their TradingView charts in my analysis.

WTI(20250922)Today's AnalysisMarket News:
Federal Reserve Board Governor Milan: Expects continued rate cuts in the coming months and will work to convince other policymakers to cut more quickly; Minneapolis Fed President Neel Kashkari: Two more rate cuts this year would be appropriate.
Technical Analysis:
Today's Buy/Sell Levels:
62.58
Support and Resistance Levels:
63.70
63.28
63.01
62.15
61.87
61.45
Trading Strategy:
If the market breaks above 62.58, consider buying, with the first target at 63.01.
If the market breaks below 62.15, consider selling, with the first target at 61.87

CRUDE OIL (WTI): Complete Support & Resistance Analysis Today
Here is my latest structure analysis for WTI Oil.
Resistance 1: 63.7 - 64.1 area
Resistance 2: 65.6 - 66.8 area
Resistance 3: 70.2 - 70.5 area
Support 1: 61.4 - 62.0 area
Support 2: 59.0 - 60.8 area
Support 3: 55.3 - 57.3 area
The price is currently breaking Resistance 1.
A daily candle close above that may push the prices to Resistance 2.
❤️Please, support my work with like, thank you!❤️
I am part of Trade Nation's Influencer program and receive a monthly fee for using their TradingView charts in my analysis.

WTI Crude Oil (CL) - Technical Analysis Report - 20250908Analysis Date : September 8, 2025
Current Price : $62.25
Market Session : Pre-Market Analysis
Executive Summary
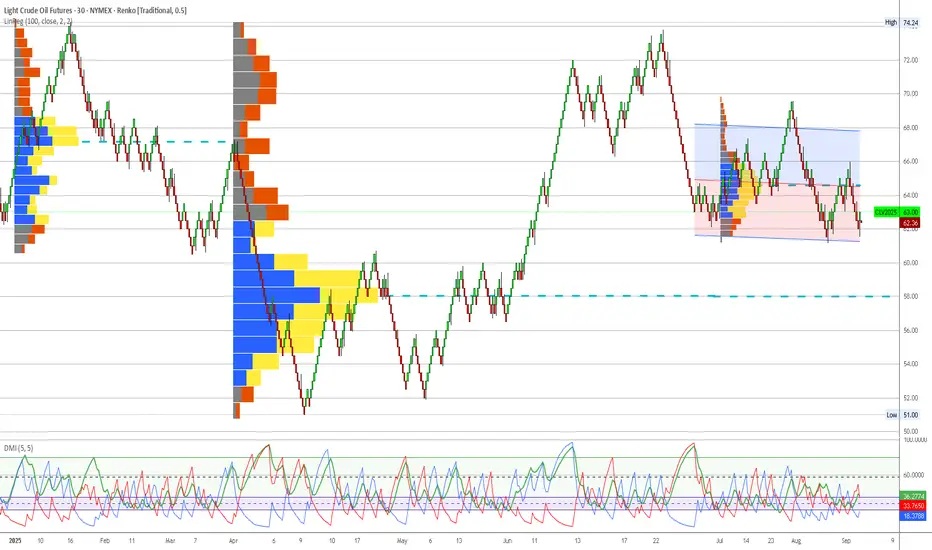
WTI Crude Oil presents a complex trading scenario with strong institutional support at current levels offset by concerning technical deterioration on the execution timeframe. The quarterly volume profile reveals massive smart money accumulation in the $62-64 zone, yet recent DEMA bearish crossover signals potential near-term weakness. This analysis provides a comprehensive framework for navigating this conflicted setup.
Quarterly Volume Profile Analysis
Institutional Positioning Intelligence
The quarterly volume profile (Q3 2025) reveals critical institutional positioning patterns that provide strategic context for all tactical decisions:
Primary Institutional Accumulation Zone: $62.00-$64.50
Massive blue volume concentration representing institutional accumulation
Heaviest volume density occurs at $62.50-$63.50 range
Current price ($62.25) sits at the lower boundary of this critical zone
Volume profile width indicates sustained institutional interest over extended period
Secondary Support Levels:
$60.50-$61.50: Moderate blue volume representing backup institutional support
$58.00-$59.00: Minimal volume suggesting limited institutional interest
Below $58.00: Complete volume void indicating institutional evacuation zone
Resistance Structure Analysis:
$65.00-$66.50: First institutional resistance zone with mixed volume
$68.00-$70.00: Heavy yellow volume indicating institutional distribution
$70.00+: Historical distribution zone from Q2 2025 peak
Price Structure Context
Historical Pattern Recognition:
The current positioning mirrors successful institutional accumulation patterns observed in previous commodity cycles. The width and intensity of the $62-64 blue volume zone suggests this represents a major strategic positioning by institutional participants, similar to the Natural Gas accumulation pattern that preceded its successful reversal.
Critical Structure Points:
Institutional Floor: $62.00 represents the absolute lower boundary of smart money positioning
Volume Point of Control: $63.25 shows peak institutional activity
Breakout Level: $64.50 marks the upper boundary requiring institutional continuation
Void Zone: $58-60 represents dangerous territory with minimal institutional backing
Execution Chart Technical Analysis
Current Technical Configuration
DEMA Analysis - CRITICAL WARNING SIGNAL:
Black Line (Fast DEMA 12): Currently at $62.25
Orange Line (Slow DEMA 20): Currently at $62.50
Configuration: Bearish crossover confirmed (black below orange)
Trend Bias: Technical momentum now bearish despite institutional support
DMI/ADX Assessment:
ADX Level: 40+ indicating strong directional movement
+DI vs -DI: -DI gaining dominance over +DI
Momentum Direction: Confirming the DEMA bearish bias
Trend Strength: High ADX suggests this technical shift has conviction
Stochastic Analysis:
Tactical Stochastic (5,3,3): Oversold territory providing potential bounce signal
Strategic Stochastic (50,3,3): Still showing bearish momentum
Divergence: Mixed signals between timeframes creating uncertainty
Support and Resistance Levels
Immediate Technical Levels:
Current Resistance: $62.75 (DEMA 20 orange line)
Key Resistance: $63.25 (institutional volume POC)
Major Resistance: $64.00 (upper institutional boundary)
Immediate Support: $61.75 (recent swing low)
Critical Support: $61.25 (institutional floor approach)
Emergency Support: $60.50 (secondary institutional zone)
Trading Scenarios and Setup Criteria
Scenario 1: Bullish Reversal Setup
Required Conditions for Long Entry:
DEMA recrossover: Black line must cross back above orange line
DMI confirmation: +DI must regain dominance over -DI
ADX maintenance: Strong directional reading above 25-30
Volume respect: Price must hold above $62.00 institutional floor
Stochastic alignment: Both tactical and strategic stochastics showing bullish divergence
Entry Protocol:
Primary Entry: $62.50-$63.00 upon DEMA bullish recrossover
Secondary Entry: $62.00-$62.25 if institutional floor holds with technical improvement
Position Sizing: 2% account risk maximum given conflicted signals
Stop Loss: Below $61.50 (institutional support violation)
Profit Targets:
Target 1: $65.00 (first institutional resistance) - Take 50% profits
Target 2: $67.00 (major resistance zone) - Take 25% profits
Target 3: $68.50-$70.00 (distribution zone) - Trail remaining 25%
Scenario 2: Bearish Breakdown Setup
Short Entry Conditions:
DEMA bearish continuation: Black line accelerating below orange line
Volume violation: Price breaking below $62.00 institutional floor
DMI confirmation: -DI expanding lead over +DI
ADX persistence: Maintaining strong directional bias
Short Setup Parameters:
Entry Range: $61.50-$61.75 on institutional support breakdown
Stop Loss: Above $62.75 (failed breakdown)
Targets: $60.00, $58.50, $57.00 (volume void zones)
Risk Management: Tight stops given counter-institutional positioning
Scenario 3: Range-Bound Consolidation
Sideways Trading Framework:
Range Definition: $62.00-$64.50 (institutional accumulation zone)
Long Zone: $62.00-$62.50 (lower boundary)
Short Zone: $63.75-$64.50 (upper boundary)
Stop Distance: 0.5-0.75 points ($500-$750 per contract)
Profit Target: Opposite range boundary
Risk Management Protocols
Position Sizing Guidelines
Conservative Approach (Recommended):
Maximum Risk: 1.5% of account (reduced from standard 2% due to technical/institutional conflict)
Contract Calculation: Account Size × 0.015 ÷ (Stop Distance × $10)
Example: $100,000 account with $0.75 stop = 200 contracts maximum
Stop Loss Hierarchy
Tactical Stop: $61.75 (execution chart support)
Strategic Stop: $61.50 (institutional boundary approach)
Emergency Stop: $60.75 (institutional floor violation)
Time-Based Risk Controls
Monitoring Requirements:
Daily: DEMA relationship and institutional level respect
4-Hour: DMI momentum shifts and ADX strength
Hourly: Stochastic divergence patterns
Exit Timeline: 10 trading days maximum if no clear resolution
Market Context and External Factors
Fundamental Considerations
Supply/Demand Dynamics:
OPEC+ production decisions impacting supply outlook
US Strategic Petroleum Reserve policies
China demand recovery prospects
Refinery maintenance season effects (September-October)
Geopolitical Factors:
Middle East tension levels affecting risk premiums
US-Iran relations impacting supply disruption concerns
Russia-Ukraine conflict ongoing effects on global energy flows
Seasonal Patterns
September-October Considerations:
End of summer driving season typically bearish for demand
Hurricane season potential for supply disruptions
Heating oil demand preparation potentially supportive
Refinery turnaround season creating temporary supply tightness
Monitoring Checklist and Alert Levels
Daily Monitoring Requirements
DEMA Status: Track black vs orange line relationship
Institutional Respect: Confirm price behavior at $62.00 floor
Volume Analysis: Monitor any changes in accumulation patterns
External Events: EIA inventory reports, Fed policy statements
Correlation Analysis: Monitor relationship with dollar strength and equity markets
Critical Alert Levels
Bullish Alerts:
DEMA bullish recrossover above $62.50
Strong bounce from $62.00 institutional floor
+DI reclaiming dominance over -DI
Break above $64.50 with volume confirmation
Bearish Alerts:
Break below $62.00 institutional floor
DEMA gap expansion (black line diverging from orange)
Volume breakdown below secondary support at $60.50
ADX above 50 with strong -DI dominance
Conclusion and Strategic Outlook
WTI Crude Oil presents a classic conflict between institutional positioning and technical momentum. The quarterly volume profile provides unambiguous evidence of major institutional accumulation at current levels, yet execution chart technical deterioration cannot be ignored. This scenario requires heightened vigilance and reduced position sizing until technical and institutional signals realign. The institutional floor at $62.00 represents the critical decision point - respect of this level with technical improvement offers exceptional risk/reward opportunities, while violation signals potential deeper correction despite smart money positioning.
Strategic Recommendation: Defensive positioning with readiness to capitalize on either directional resolution. Prioritize capital preservation while maintaining alert status for high-probability setups upon signal alignment.
Next Review: Daily assessment of DEMA configuration and institutional level respect
Document Status: Active monitoring required - conflicted signals demanding careful attention
Important Disclaimer
Risk Warning and Educational Purpose Statement
This analysis is provided for educational and informational purposes only and does not constitute financial advice, investment recommendations, or trading signals. All trading and investment decisions are solely the responsibility of the individual trader or investor.
Key Risk Considerations:
Futures trading involves substantial risk of loss and is not suitable for all investors
Past performance does not guarantee future results
Market conditions can change rapidly, invalidating any analysis
Leverage can amplify both profits and losses significantly
Individual financial circumstances and risk tolerance vary greatly
Professional Guidance: Before making any trading decisions, consult with qualified financial advisors, conduct your own research, and ensure you fully understand the risks involved. Only trade with capital you can afford to lose.
Methodology Limitations: Volume profile analysis and technical indicators are tools for market assessment but are not infallible predictors of future price movement. Market dynamics include numerous variables that cannot be fully captured in any single analytical framework.
The views and analysis presented represent one interpretation of market data and should be considered alongside other forms of analysis and individual judgment.
CRUDE OIL (WTI): Important Breakout!
With a strong bullish rally, WTI Crude Oil violated a significant
daily resistance cluster yesterday.
The broken structure and a rising trend line compose an important
demand zone now.
I will expect a bullish continuation from that.
Next resistance - 66.6
❤️Please, support my work with like, thank you!❤️
WTI Crude Oil – Range Support in FocusWe're waiting for price to reach the bottom of the range, and with a solid buy signal, we’ll consider going long.
However, since this level has been tested multiple times, it’s highly vulnerable to stop fishing — so caution is key.
As always, we’re ready for all scenarios:
If price breaks below, we’ll wait for a pullback to enter short.
But right now, we’re watching the range support for potential longs
