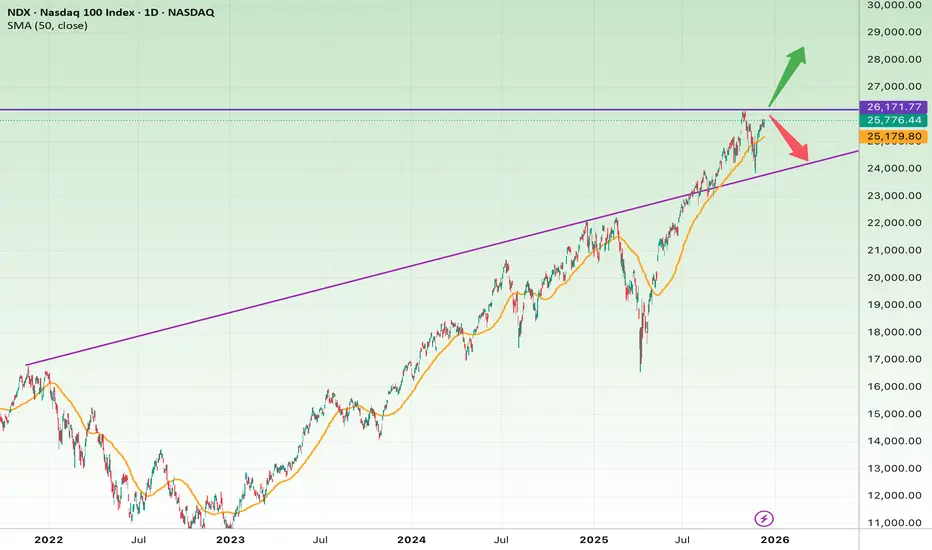
Nasdaq at a Make-or-Break Level: Breakout or Breakdown?Price is trapped between a major historical resistance and a long-term ascending trendline — a critical decision zone.
Bullish Scenario
If price breaks and holds above 26,300:
• Target 1: 27,500
• Target 2: 28,500–29,000
• Stop-loss: Close back below 25,800
Bearish Scenario
If price loses 25,200, and especially 24,800 (trendline):
• Target 1: 23,500
• Target 2: 21,800
• Stop-loss: Reclaiming 25,500
Short Fundamental View
• Tech giants continue to drive market momentum.
• Valuations are elevated, leaving room for correction.
• Fed policy and macro data will heavily influence future price action.
X-indicator
$ENA/USDT ANALYSISOn the 3-day chart, ENA/USDT is trading inside a long-term demand zone where price has reacted multiple times in the past, showing that buyers have stepped in here before. The market has been in a downtrend for several months and is still moving under a descending trendline, showing weak momentum overall, but it is also holding above the same support area that previously triggered a strong bounce. Candles are small and volume looks low, which shows indecision, and the price is moving sideways near the bottom of the range instead of breaking down or starting a strong move yet. Until a clear move happens, the chart is showing consolidation near support after a long decline, meaning the market is in a waiting phase where buyers and sellers are trying to take control.

DOT USDT LONG SIGNAL---
📢 Official Trade Signal – DOT/USDT
📈 Position Type: LONG
💰 Entry Price: 2.179 (Limit Order)
---
🎯 Take-Profit Targets (Partial Exits):
• TP1: 2.218
• TP2: 2.248
• TP3: 2.300
• TP4: 2.393
• TP5: —
---
🛑 Stop-Loss: 2.084
📊 Timeframe: 15m
⚖️ Risk/Reward Ratio: ≈ 2.25 (based on TP4)
💥 Suggested Leverage: 3× – 5×
---
🧠 Technical Analysis Summary
DOT shows potential bullish momentum after stabilizing near a key support zone around 2.179.
A successful break above immediate resistance could trigger a move toward higher timeframe liquidity areas.
The 15m chart structure suggests a possible shift upward, with clear targets aligned with previous swing highs and orderbook liquidity levels.
Critical upside targets:
2.218 → 2.248 → 2.300 → 2.393
A sustained move above TP1 (2.218) may accelerate momentum toward 2.300 and 2.393.
---
⚙️ Trade Management Rules
✔ Take partial profit at each TP level
✔ Move stop-loss to entry point once TP1 is reached
✔ Trail stop-loss as price progresses toward higher targets
✔ No re-entry if stop-loss (2.084) is triggered
✔ Confirm bullish structure on 15m chart before entering
---
📌 TradingView Hashtags
#DOTUSDT #DOT #CryptoSignal #LongTrade
#TradingView #FuturesTrading #TechnicalAnalysis
---
Let me know if you would like this translated to Persian or adjusted in any way.

Ethereum Analysis + Correlation of Bitcoin + Advanced TAHow can you analyze Ethereum deeply using volume, visible range, and RSI, together with technical and correlation analysis in the crypto space?
How does correlation work between Bitcoin and Ethereum?
And additionally, how do I personally approach technical analysis, where to look right now on Ethereum itself, and which direction the market and the crypto space are moving?
If this video reaches 10 likes or more, I will do an update on that.
Until then, I wish you the best.
And if you like the video, don’t forget to comment, like, and share.
Also, leave me a comment below on which asset I should talk about next, or which strategies or problems you are currently facing in trading.
Happy to help, just share it in the comments.
And let me know as well if you like this type of video, Face sharing.


APT USDT LONG SIGNAL---
📢 Official Trade Signal – APT/USDT
📈 Position Type: LONG
💰 Entry Price: 1.7780
---
🎯 Take-Profit Targets (Partial Exits):
• TP1: 1.8100
• TP2: 1.8480
• TP3: 1.8880
• TP4: 1.9214
• TP5: 1.9532
• TP6: 2.0000
---
🛑 Stop-Loss: 1.7200
📊 Timeframe: 15m
⚖️ Risk/Reward Ratio: ≈ 2.34 (based on TP6)
💥 Suggested Leverage: 5× – 10×
---
🧠 Technical Analysis Summary
APT is showing signs of bullish momentum after holding above a key support area near 1.7750. The 15m chart suggests a potential upward shift if price breaks above immediate resistance around 1.8100. Higher lows and increasing buy pressure could propel APT toward the identified liquidity zones above.
The key upside targets are structured as follows:
1.8100 → 1.8480 → 1.8880 → 1.9214 → 1.9532 → 2.0000
A confirmed break above TP1 (1.8100) may accelerate upward movement toward 1.8880 and beyond.
---
⚙️ Trade Management Rules
✔ Take partial profit at each TP level
✔ Move SL to entry once TP1 is reached
✔ Trail stop-loss upward as price advances
✔ Do not re-enter if SL (1.7200) is triggered
✔ Confirm bullish structure on 15m chart before entering
---
📌 TradingView Hashtags
#APTUSDT #APT #CryptoSignal #LongTrade
#TradingView #FuturesTrading #TechnicalAnalysis
---
Let me know if you'd like this adjusted for a different style or translated into Persian.

Apple Consolidates at Key Fibonacci Level: Is a Breakout Coming?Apple is sitting right under a big technical level: the 38.2% Fibonacci retracement around $279–280. This spot has been blocking price for days, and the stock keeps bouncing between this resistance and the support levels below.
Buyers have already defended the 50% ($276) and 61.8% ($273) Fib levels, which shows there’s still strength in the uptrend. But unless Apple finally pushes above $280 with conviction, it could swing back down to retest those support levels again.
In short: Apple is coiling up, and the breakout direction from here will tell us everything about the next move.

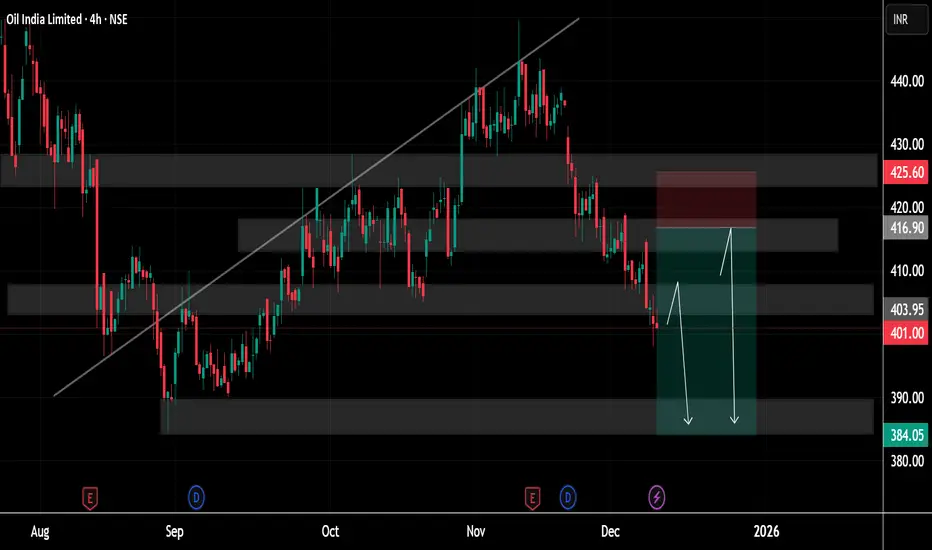
Crude Oil Price Update – Clean & Clear ExplanationCrude Oil highlighting how the market has shifted from a previously rising trend into a phase of weakness. Earlier, the price followed an upward sloping trendline, reflecting steady buying strength, but eventually the price broke below that trendline, signalling the start of a broader correction. Since then, the chart has formed a series of lower highs and lower lows, showing the transition from bullish momentum to a more bearish structure.
Several supply and demand zones are clearly marked on the chart with shaded regions. These zones help identify where buying or selling pressure is strongest. The upper zone near 425–430 represents a major supply area where sellers have previously stepped in and pushed the price down multiple times. Just below it, the 416–420 region shows another resistance area that reinforces the overhead selling pressure.
On the downside, the price is currently trading around the 401 level, where it is testing a mid-level demand zone. The chart shows projected arrows indicating the possibility of the price dipping deeper into the broader demand area around 384–390. This zone has historically acted as a strong support, where buyers could attempt to defend the price again.
The highlighted risk-to-reward box suggests a potential short setup, where traders might expect further downside movement until the price reaches the lower support zone. However, there is also a secondary upward arrow indicating that if the price finds strong support, it may bounce back toward the mid-range resistance near 416, before facing sellers again.
Overall, the chart represents a long-term picture of price correction inside a well-defined supply and demand structure, where the market is currently showing bearish momentum but may find stability and buyers closer to the lower demand zones. The structure reflects how the market is balancing between downward pressure and potential reversal zones, giving a clear roadmap of key levels for future movement.
If you find it helpful please like and comments for this post and share thanks.
XEL in BUY ZONEMy trading plan is very simple.
I buy or sell when at either of these events happen:
* Price tags the top or bottom of parallel channel zones
* Money flow volume spikes beyond it's Bollinger Bands
So...
Here's why I'm picking this symbol to do the thing.
Price in buying zone at bottom of channels
Money flow momentum is spiked negative and outside of Bollinger Band
Entry at $74.62
Target is upper channel around $78.50

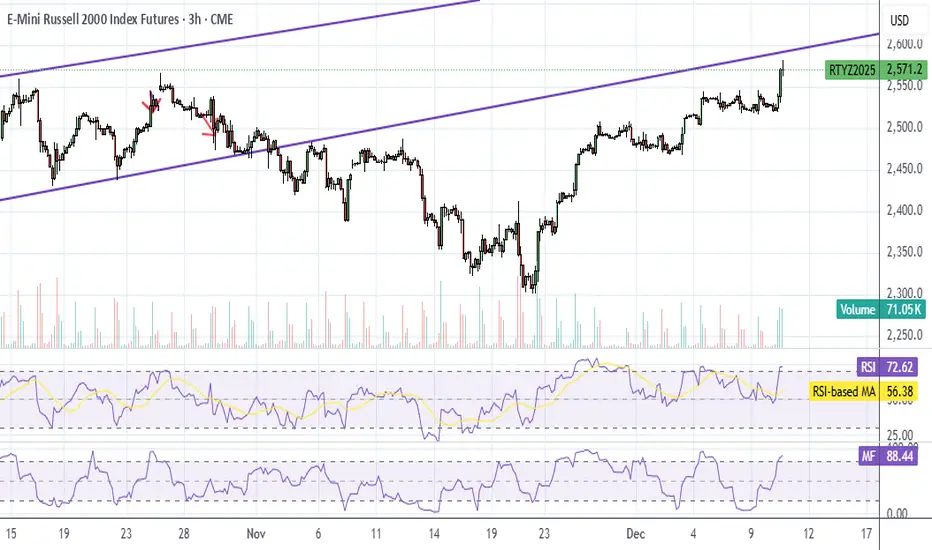
RTY UpdateRTY is overbought on both RSI and MFI but I think it backtests that purple line before dropping.
Expecting a pump tomorrow morning then back to teh whipsaw. See my ES plot./
GC (gold) UpdateMFI hit overbought and SI (silver) hit overbought on RSI.
Decided it was easier to trade stock options than commodities today. No position.

RR - Nearly time to go long on Robotics?I like to make trades at the confluence of a number of factors. I think RR is nearly at some of those points so I'm going to open the idea - and we'll journal this like usual.
** Important: I am not long yet, and don't yet recommend it.
Let's look at the support:
1. The lower trendline. My lower trendline is actually lower than it could be (there are other trendlines that indicate a higher point, but I like to be safe. We need to hold this trendline which is currently about $3
2. The 200 day EMA is at $3.22. Also really good support.
3. The POC is currently at $3.18. Again, really good support.
4. It does also look like that head and shoulders pattern from October is complete.
5. If we don't hold that $3 support the next support is around $2.30. But, that current $3 support would become resistance, and we'd be likely be stuck down there. So we need to hold that $3.
The resistance:
1. That upper trendline has held strong. It's been touched multiple times and each time bounced down with some volume - indicating it's still strong. Before going long here we need to break that trendline.
2. After earnings we found resistance at $4.60. That will be an important level to break. After that breaks and holds, the next resistance is likely the right shoulder and that volume node at about $6
The trade plan goes as follows:
1. Go long if:
1a. We break the upper trendline.
1b. Or we bounce off the 200day or POC.
2. Ideally, we drop a bit more down to about $3.30, then bounce with some momentum and break the trendline.
If 1a happens, I'll likely sell puts, happy to own if they get exercised.
If 1b happens, I'll buy LEAP Calls and potentially play with some synthetic covered calls.
My target price is $5.80 - just before that $6 resistance.
I'll update weekly - or if I got long.

WTI Crude bearish below 5980The WTI Crude continues to display a bearish outlook, in line with the prevailing downward trend. Recent price action suggests a corrective pullback, potentially setting up for another move lower if resistance holds.
Key Level: 5980
This zone, previously a consolidation area, now acts as a significant resistance level.
Bearish Scenario (rejection at 5980):
A failed test and rejection at 5980 would likely resume the bearish momentum.
Downside targets include:
5796 – Initial support
5728 – Intermediate support
5667 – Longer-term support level
Bullish Scenario (breakout above 5980):
A confirmed breakout and daily close above 5980 would invalidate the bearish setup.
In that case, potential upside resistance levels are:
6025 – First resistance
6100 – Further upside target
Conclusion
WTI Crude remains under bearish pressure, with the 5980 level acting as a key inflection point. As long as price remains below this level, the bias favours further downside. Traders should watch for price confirmation around that level to assess the next move.
This communication is for informational purposes only and should not be viewed as any form of recommendation as to a particular course of action or as investment advice. It is not intended as an offer or solicitation for the purchase or sale of any financial instrument or as an official confirmation of any transaction. Opinions, estimates and assumptions expressed herein are made as of the date of this communication and are subject to change without notice. This communication has been prepared based upon information, including market prices, data and other information, believed to be reliable; however, Trade Nation does not warrant its completeness or accuracy. All market prices and market data contained in or attached to this communication are indicative and subject to change without notice.

$MSTR ..Houston we’ve found a support NASDAQ:MSTR , MSTR went from trading at 400 times bitcoin value to less than 1(slightly) book to value. And it Happened suspicously while hitting the volume profile point of control.

Bitcoin reaction to FED RATE choices since 2021
It is really very simple
Back in 2021 and 2022, Bitcoin PA did what it was intended to do and rate decisions did not directly inpact Bitcoin at all.
We had the traditional 9-% pull back, as we had had in previous cycle.
The impact in the rising Rates was on companies in the Crypto Sphere, that suffered as rates were increased.
Repaying th eloans became intolerable.
Lets look at this cycle, from late 2022 to current day
Despite Steep Rate rises in late 2022, Early 2023, Bitcoin Price and trading Volume INCREASED.#
In Late 2022, you can see that a steep 75 point increase did not phase BTC from trying to rise but the impact on crypto companies and Banks began scaring people and the next 75 point rise tipped many over
But Bitcoin found a floor and remained there.
Then we had a 50 point rise and PA remained were it was...NO IMPACT>
Then we had a series of 3 x 25 point rises.
Bitcoin Rose through the first of those and fought back in the other 2, dipping slightly as the OverSold MACD cooled off ( this was on lower time frames )......The ONLT reason for the Range to lower prices
Weekly MACD
The Green box shows the period that BTC PA ranged, March to September 2023
THIS was the defining period for BITCOIN
Once it became cheaper to borrow nd ETF's were allowed. off we went.
Is Cheaper borrowing likely to sustain Bitcoins rise ?
OF COURSE
But please remain cautious.
100K -> 110K usdt is the line of possible rejection and has potential to enter Bitcoin into a Deeper Bear.
REMEMBER. BITCOIN is NOT effected by Rates, as we saw in early 2023, and If a BEAR Market is required, then it will happen no matter if Rates are lower.
For Me, I think we will see a rise, a Dip and then, around March next year,we will see the defining moment that will decree where we REALLY go
MACRO events can always accelerate that

CLSK Long to $36CleanSpark ( NASDAQ:CLSK ) is a bitcoin miner focused on utilizing clean energy to run their operations.
CLSK moves with high beta to BTC and in my view we're nearing the start of a very explosive move. Rationale on that is for another post.
There is confluence on many indicators for a push to $36 aka $10B valuation by mid January 2026.
I entered Jan27 $35 calls before Nov25 earnings.

LINK USDT LONG SIGNAL---
📢 Official Trade Signal – LINK/USDT
📈 Position Type: LONG
💰 Entry Price: 14.064
Entry price=2
13.756
---
🎯 Take-Profit Targets (Partial Exits):
• TP1: 14.294
• TP2: 14.515
• TP3: 14.740
• TP4: 14.976
• TP5: 15.316
• TP6: 15.660
---
🛑 Stop-Loss: 13.355
📊 Timeframe: 15m
⚖️ Risk/Reward Ratio: ≈ 2.03 (based on TP6)
💥 Suggested Leverage: 5× – 10×
---
🧠 Technical Analysis Summary
LINK is showing signs of bullish momentum after holding above the key support level around 14.064. The market structure on the 15-minute chart suggests a potential upward move, with higher lows forming and price testing immediate resistance zones. The take-profit levels are aligned with previous swing highs and liquidity concentrations on the higher timeframes.
The critical upside targets are:
14.294 → 14.515 → 14.740 → 14.976 → 15.316 → 15.660
A confirmed break above TP1 (14.294) may accelerate momentum toward the subsequent targets, especially if supported by increasing volume and bullish market sentiment.
---
⚙️ Trade Management Rules
✔ Take partial profit at each TP level
✔ Move stop-loss to entry point once TP1 is reached
✔ Trail stop-loss upward as price advances
✔ No re-entry if stop-loss (13.872) is triggered
✔ Confirm bullish structure and momentum before entering
---
📌 TradingView Hashtags
#LINKUSDT #LINK #CryptoSignal #LongSetup
#TradingView #FuturesTrading #TechnicalAnalysis
---
Disclaimer: Always practice proper risk management and verify market conditions before entering any trade.

NVDA SELLIf you have not SELL NVDA, than be prepare to SELL NVDA riding it back down to 93.00 to 77.00 as Profit Targets, Stop Loss will be determine later!
If anyone likes long mumbo jumbo garbage analysis, than this is NOT for you.
Also, if you are afraid of risk, failure, and want only a 100% sure thing, than
run as fast as you can from the market, because the market is NOT a sure thing,
so it is definitely NOT for you.
WARNING: This is just opinions of the market and its only for journaling purpose. This information and any publication here are NOT meant to be, and do NOT constitute, financial, investment, trading, or other types of advice or recommendations. Trading any market instrument is a RISKY business, so do your own due diligence, and trade at your own risk. You can loose all of your money and much more.

US OilCrude Oil
- Double Bottom in Long Time Frame
- RSI - Divergence
- Fair Value Gap
- SSL
- Bearish Channel as an corrective pattern in Short Time Frame

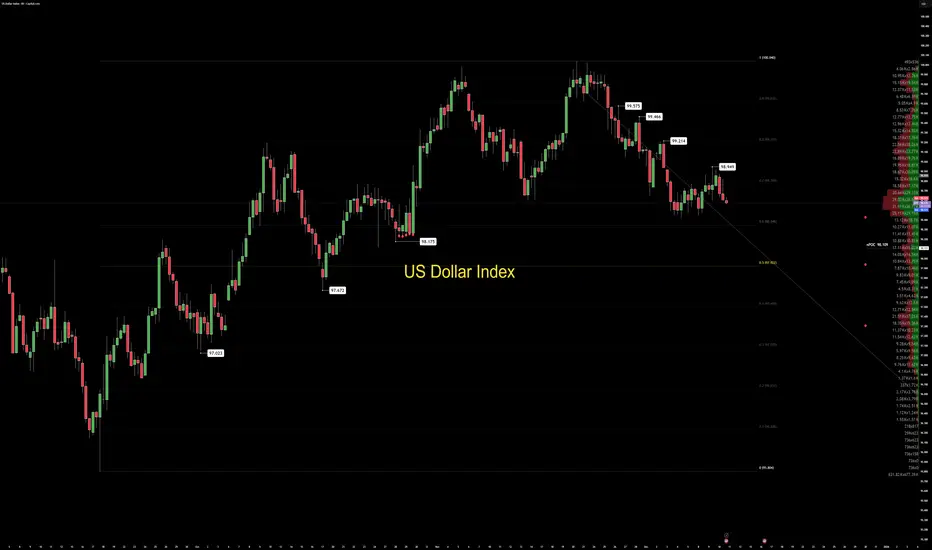
THE DAILY DOLLAR UPDATE — FOMC VOLATILITY WINDOWThe U.S. Dollar enters today’s session under a clear volatility regime. FOMC sits at the center of the macro landscape, and the market is positioning early.
The dominant behavior is not directional aggression. It is information gathering. The Dollar is being pushed toward the weekly discount zone near 98.175, where a known liquidity pool sits. This is not organic weakness — it is deliberate positioning.
Order flow confirms this intent. Absorption shows up consistently at the .6–.7 Fibonacci bands, indicating institutions are unloading inventory into premium while sentiment remains fragile. Retail sees a slowing trend. Professionals see asymmetric preparation around a major macro catalyst.
Market Structure (MSM)
Internal bearish structure remains intact. Selling continues to dominate the internal leg, and structure is guiding price toward the weekly discount zone. No bullish regime shift is confirmed, and the architecture remains clean on the higher timeframes.
Dynamic Geometry (DGM)
Despite bearish pressure, the Dollar still trades inside an overpriced bullish dynamic condition relative to the weekly and daily POVs. This creates geometric tension: structure wants discount, geometry remains stretched in premium. When those two conflict, liquidity usually resolves the argument.
Volume Flow (VFA)
The next major volume POC sits in the mid-range and aligns directly with the liquidity low. Participation is not accumulating at highs; it is preparing to rotate downward. Volume acceptance at lower prices would confirm this shift, but for now, the market is in transition.
Order Flow Dynamics (OFD)
Order flow today is absorbed at premium levels. Large participants are distributing into the upper bands rather than allocating fresh long exposure. Sweeps are small, deliberate, and designed to clear short-term positioning across both sides of the range.
Precision Execution (PEM)
The broader downtrend remains intact. Deviations stay negative. These are traditionally favorable conditions for Dollar sells and cross-market rotations into strength.
However, execution must respect the macro backdrop. FOMC, year-end flows, and reduced liquidity can distort intraday structure. Stops must sit behind higher-timeframe pivots. Patience is discipline in a news-driven environment.
Macro Calendar — United States
• FOMC Statement
• Fed Rate Decision
• Press Conference with Chair Powell
• High-volatility window expected pre- and post-announcement
CORE5 Identity Line
We do not react to movement. We interpret intention.
Takeaway
The Dollar is not collapsing; it is being positioned. FOMC will determine who read the behavior correctly.
— CORE5DAN
Institutional Logic. Modern Technology. Real Freedom.
Bullish, but not as strong as before.Hey guys, PIPPINUSDT just printed an absolute monster move, surging 60.50% in the last 24 hours from a low of $0.2200 to a high of $0.3966 before settling around $0.3571. This kind of explosive price action demands careful analysis because while the gains look incredible, the real question is whether we're looking at sustainable momentum or a classic pump setup ready to dump on latecomers.
Let's start with the trend structure, which is honestly pretty clean for such a volatile move. Price is holding above all three major exponential moving averages: EMA20 at $0.3249, EMA50 at $0.2758, and EMA200 at $0.2066. This creates what we call a bullish EMA stack, where faster averages sit above slower ones, and price maintains position above all of them. It's textbook trending behavior and exactly what you want to see if you're positioned long or looking for continuation entries.
The ADX is reading 57.2, which confirms we're in a strong trending environment rather than choppy consolidation. When ADX pushes above 50, it's telling you there's genuine directional conviction in the market, not just noise. Right now that direction is clearly bullish, supported by the internal market state showing a 5-to-1 bull-to-bear stack ratio. The directional confidence sits at 33.6%, which might seem low, but given the mixed signals from MACD and volume, it's actually reasonable - the trend is up, but momentum indicators are flashing some yellow flags.
Speaking of momentum, let's dive into the RSI and MACD situation. RSI at 64.7 is sitting comfortably in neutral territory, which is actually bullish because it means we've got room to run before hitting overbought conditions around 70-75 where profit-taking typically accelerates. We're not seeing extreme readings that would suggest an imminent reversal. However, the MACD is showing a bearish crossover with the MACD line at 0.0272 sitting below the signal line at 0.0308. This divergence often precedes short-term consolidation or pullbacks, especially after parabolic moves like we just witnessed. It's not screaming reversal, but it's definitely suggesting we might need to digest these gains before the next leg higher.
The Bollinger Bands are painting a really clear picture of the current price structure. Upper band sits at $0.3704, middle band (which is basically a 20-period SMA) at $0.3318, and lower band at $0.2932. Price is currently trading above the middle band but well below the upper band after getting rejected from $0.3966. That massive 19.4% upper wick from the session high is significant - it shows heavy supply came in at those elevated levels, and sellers were aggressive enough to push price down substantially. Compare that to the tiny 3.6% lower wick, and you can see buyers are still defending dips with conviction. The battle right now is whether bulls can reclaim that upper Bollinger Band at $0.3704 or if we consolidate/correct toward the middle band support.
Volume analysis is where things get a bit concerning for the immediate bullish case. Current volume sits at $152.9M, which is below the average of $214M. After a 60% rally, you'd ideally want to see sustained or increasing volume to confirm the move has legs. Declining volume after explosive gains often suggests the initial wave of buyers is exhausted, and we need fresh capital to push higher. The MFI (Money Flow Index) at 55.7 is neutral, not showing extreme buying or selling pressure, which keeps both continuation and correction scenarios on the table. We're not seeing the kind of volume capitulation that would signal a top, but we're also not seeing the accumulation that would confirm the next leg up is ready to fire.
From a support and resistance perspective, here are your critical levels to watch. Immediate support sits at the EMA20 around $0.3249, which has been tested and held multiple times during this rally. Below that, you've got the middle Bollinger Band at $0.3318 acting as a secondary support zone. If both of those fail, the EMA50 at $0.2758 becomes your major support, and breaking that would likely invalidate the bullish structure and trigger a deeper correction toward the lower Bollinger Band at $0.2932. On the resistance side, the immediate ceiling is that Bollinger upper band at $0.3704. Reclaiming this level with volume would open the door to retest the session high at $0.3966, which is now a proven supply zone. Breaking above $0.3966 would be incredibly bullish and could trigger FOMO buying toward psychological resistance at $0.4000 and potentially $0.4100+ if momentum really accelerates.
For anyone looking to trade this setup, here's how I'd structure it. Entry zone would be on a pullback to $0.3350-$0.3400, ideally coinciding with a test of the middle Bollinger Band or EMA20. This gives you a better risk-reward than chasing current levels. Stop loss needs to sit below $0.3180, just under the EMA20 with enough breathing room to avoid getting stopped out by normal volatility and wick action. Your target progression should be scaled: TP1 at $0.3750 (retest of Bollinger upper band and psychological resistance), TP2 at $0.3900 (approaching previous high), and TP3 at $0.4100 for the aggressive holders chasing extension moves. That structure gives you roughly 2.5:1 risk-reward on the conservative first target, scaling up to 4:1 if this catches another wave of momentum. Consider taking partial profits at each level and trailing your stop as price advances.
The bull case here is straightforward: strong ADX-confirmed trend, clean EMA alignment, RSI with room to expand, support levels holding firm, and overall market structure favoring continuation. If volume returns above average levels and we reclaim $0.3704 with authority, this setup could easily push toward $0.40-$0.42 as retail FOMO kicks in. The bear case centers on that MACD bearish divergence, declining volume, and the massive supply that showed up at $0.3966. If we break below EMA20 at $0.3249 on increasing volume, it would likely trigger stops and send price down to test EMA50 around $0.2758, potentially even the lower Bollinger Band at $0.2932 if selling accelerates.
Overall confidence on the bullish continuation sits around 67% - we've got more factors supporting upside than downside, but those momentum divergences and volume concerns keep this from being a slam-dunk high-conviction setup. The trend is your friend until it bends, and right now the trend is still intact despite some warning signs. Risk management is crucial here given the volatility and the parabolic nature of the recent move.
How are you playing this move - waiting for a deeper pullback or riding the momentum?

BTCUSD – SWING LONG (4H Trendline Bounce)BTCUSD – SWING LONG (4H Trendline Bounce)
Entry: 90,000–90,500 (retest of ascending trendline support)
Targets: TP1 95,000 | TP2 98,000 | TP3 100,000+
Stop Loss: 87,500 (below recent low)
Leverage: 5–10x (swing hold 1–3 weeks) Setup: Clean bounce off the blue trendline, higher lows intact, volume building on upside. Bullish continuation targeting ATH retest. NOT financial advice
DYOR | Trade at your own risk | Risk management key!#Bitcoin #BTC #BTCUSD #CryptoTrading #SwingTrade #Trendline #Bullish #TradingSignals #Crypto #AltseasonWho's loading up on this swing? Drop your thoughts below!

ICP USDT LONG SIGNAL---
📢 Official Trade Signal – ICP/USDT
📈 Position Type: LONG
💰 Entry Price: 3.419
---
🎯 Take-Profit Targets (Partial Exits):
• TP1: 3.472
• TP2: 3.541
• TP3: 3.596
• TP4: 3.660
• TP5: 3.743
• TP6: —3.828
---
🛑 Stop-Loss: 3.300
📊 Timeframe: 15m
⚖️ Risk/Reward Ratio: ≈ 2.03 (based on TP4)
💥 Suggested Leverage: 5× – 10×
---
🧠 Technical Analysis Summary
ICP is showing signs of bullish momentum after finding support near the 3.419 level. The market structure on the 15-minute chart indicates a potential upward shift, with price action forming higher lows and testing key resistance zones. The identified take-profit levels align with previous swing highs and liquidity concentrations.
The critical upside targets are:
3.472 → 3.541 → 3.596 → 3.660
A confirmed break above TP1 (3.472) is expected to accelerate momentum toward the subsequent targets, particularly if accompanied by increasing buying volume.
---
⚙️ Trade Management Rules
✔ Take partial profit at each TP level
✔ Move stop-loss to entry point once TP1 is reached
✔ Trail stop-loss upward as price advances
✔ No re-entry if stop-loss (3.300) is triggered
✔ Confirm bullish structure and momentum before entering
---
📌 TradingView Hashtags
#ICPUSDT #ICP #CryptoSignal #LongSetup
#TradingView #FuturesTrading #TechnicalAnalysis
---
Disclaimer: Always practice proper risk management and verify market conditions before entering any trade.
