EURUSD approaching the support _longEURUSD is trading in a channel and soon price may come to support and pullback from here . let us see how it plays out .
X-indicator

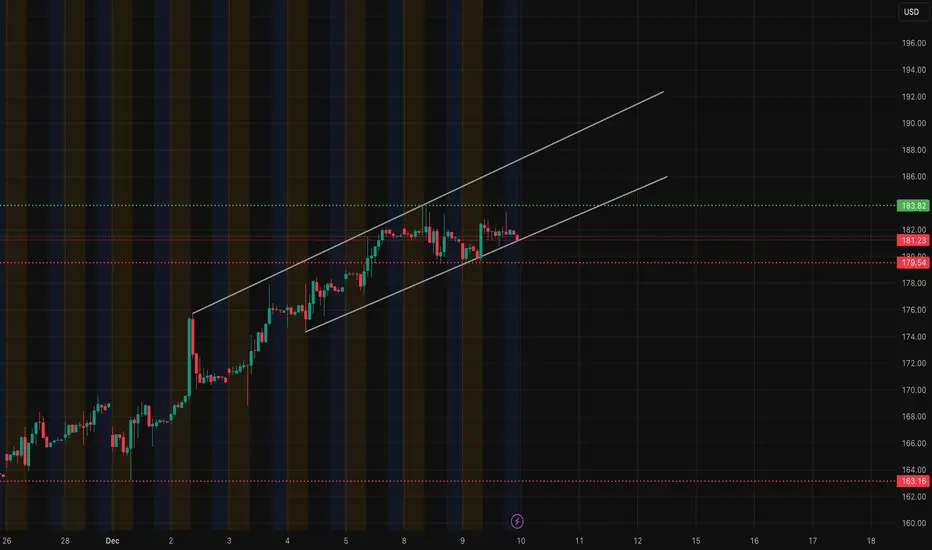
PLTR — Dec. 10 Outlook | Tight Range Inside an Up-ChannelTight Range Inside an Up-Channel, Watching 181–180 Zone
PLTR has been walking up inside a clean ascending channel for several sessions, and today’s structure keeps that story intact — but pressure is building at the mid-channel line.
On the 1H, price is still respecting the channel, but momentum is slowing. You can see several candles failing to push through the 183 area. This is the same zone where sellers stepped in previously, and it lines up with the green resistance band.
The 15-minute SMC chart gives a clearer read on intraday behavior. Earlier we had a BOS toward the upside, but now price is drifting back into the lower half of the wedge. The latest movement shows a CHoCH toward the downside, which warns that buyers are losing control short-term. As long as price sits under 182–182.8, buyers are not in full momentum.
The downside SMC levels at 181.23 → 180.77 → 179.55 are the zones to watch. If PLTR loses 181 with conviction, we likely slide into the discount zones you mapped — especially the 179.5 liquidity level.
Now the GEX chart is important here. PLTR is pinned between heavy call interest above (183–188) and notable put support building near 172.5–170. That creates a compression window around current price. GEX is neutral to slightly supportive but not strong enough to force a breakout on its own. If price stays under 183, dealers aren’t under pressure to hedge upward — meaning upside moves can fade quickly.
So the way I’m looking at this:
If PLTR holds 181 and stays inside the channel bottom, buyers still have a chance to rotate back into 183. That’s the only spot where a real breakout would make sense.
If 181 breaks, it opens the path toward 180 and potentially 179.5, which is where liquidity sits and where price would likely stabilize before deciding the next leg.
This chart right now is about patience. No momentum until one of these levels breaks cleanly.
Disclaimer:
This analysis is for educational purposes only and not financial advice. Always do your own research and manage risk according to your trading plan.
EUR-JPYIt reacted negatively to resistance. There’s no hurry for approval; for selling, the specified support level needs to be broken first, then it can be sold.

EUR/USD Is Compressing — A Breakout Is Getting Close📊 (1) MARKET STRUCTURE
NZD/USD is moving inside a well-defined descending channel, creating:
Lower Highs
Lower Lows
However, the most recent bearish swings are shorter and losing momentum —
a signal that the downtrend is weakening.
📉 (2) PRICE REACTION
Every touch of the channel’s lower boundary triggers a visible reaction upward.
Recent candles show:
Smaller bearish bodies
Wicks rejecting the lows
Early signs of micro higher lows
These elements indicate absorption of sell pressure.
⏳ (3) HTF CONTEXT
On the H1 structure:
Price is sitting at the oversold edge of the channel
Momentum is compressing
The market is forming a tight consolidation zone
This compression phase often precedes a bullish breakout.
📐 (4) EXPECTATION
High-probability scenario:
Price may dip slightly to retest 0.5960 – 0.5965
A new higher low forms
Breakout of the upper channel line
Price extends toward 0.6025 – 0.6040
This is a textbook reversal from the channel floor.
🎯 (5) TRADING SIGNAL
BUY SETUP
Entry: 0.5960 – 0.5965
Stop Loss: Below 0.5940
Take Profit:
TP1: 0.5990
TP2: 0.6015
TP3: 0.6038 (breakout target)
Key Advantages
Weakening bearish momentum
Clean reactions from channel support
Tight compression before breakout
High R:R opportunity with controlled risk

six touches in 15 years...Bitcoin Has Entered a Level It Has Only Reached Six Times and the Dates Tell the Story
Bitcoin’s Weekly RSI has dropped to 36, a historically rare zone that the chart hits only during periods of extreme structural stress.
And when we overlay this with the timeline on the chart, every dip into this RSI basement aligns with major real-world events, each stamped by a specific date.
Let’s match every RSI-36 moment with what actually happened and when.
2011 — The Mt. Gox Hack (June 19, 2011)
BTC’s earliest major crash occurred on June 19, 2011, when Mt. Gox was breached and trading halted.
Liquidity evaporated instantly, triggering one of Bitcoin’s first violent drawdowns.
2015 — Mt. Gox Bankruptcy Confirmation (January 2015 – April 2015)
While Mt. Gox filed for bankruptcy protection earlier (February 2014), the real market shock hit in 2015 as court proceedings confirmed the exchange’s insolvency and creditors reported massive unrecoverable losses.
Key dates:
January 2015: BTC bottomed near $150
April 2015: Bankruptcy trustee disclosures shook the market again
2018 — The ICO Bubble Implosion (January 2018 – December 2018)
BTC peaked on December 17, 2017, then the unwind began:
January–February 2018: ICO failures and SEC actions
November 2018: Final capitulation during Bitcoin Cash hash war
2020 — Global COVID-19 Crash (March 12–13, 2020)
When the WHO declared COVID-19 a pandemic on March 11, 2020, global markets melted down.
On March 12, 2020 (“Black Thursday”), Bitcoin recorded one of its steepest single-day drops ever.
2022 — Terra Collapse → Crypto Contagion → FTX Implosion
Here are the exact dates of the triple-shock:
May 9–12, 2022: Terra/Luna death spiral
June 12, 2022: Celsius froze withdrawals
July 5, 2022: Voyager filed for bankruptcy
November 8–11, 2022: FTX collapsed and filed for Chapter 11
Each failure compounded systemic risk across crypto.
2025 — The Sixth Touch: Tariff Shock & Global Instability
The most recent RSI drop aligns with the 2025 macro-driven selloff, tied to:
Tariff escalations between major economies
Heightened geopolitical tensions
Risk-off flows hitting all high-beta assets
BONUS CHART EVIDENCE (NERD MODE):
Your chart clearly maps each RSI-low event to a real historical stress point:
Year Event Date Chart Marker
2011 Mt. Gox Hack June 19, 2011 MT. GOX HACK
2015 Mt. Gox Bankruptcy Fallout Jan–Apr 2015 MT. GOX COLLAPSE
2018 ICO Bubble Crash 2018 (Dec bottom) ICO BUBBLE
2020 COVID Crash March 12–13, 2020 COVID CRASH
2022 Luna → Celsius → FTX Collapse May–Nov 2022 TERRA / FTX COLLAPSE
2025 Macro + Geopolitical Stress 2025 TARIFF WAR & WARS
Each RSI drop perfectly aligns with the chart’s highlighted crisis zones.
The currencynerd Take
This RSI zone is more than a technical level, it’s a historical fingerprint.
Every time Bitcoin visits this region, the market is either:
wrapping up a generational panic, or
warming up for deeper chaos.
And based on the chart…
BTC is once again standing at a level touched only during the darkest moments in its history.
What happens next doesn’t just shape price, it shapes the entire cycle.
put together by : Pako Phutietsile as @currencynerd
courtesy of : @TradingView

Alert: Bitcoin Price Charts Bear Flag Bitcoin follows the downward path posted earlier on the weekly chart (see related)
The falling knife accelerated after price broke below $100k as it swiftly hit the 80k level and stopped there just ahead of the next viable support at $74k
The price is now within a pink downtrend channel as RSI turned bearish below the 50 reading
Every strong move is followed by corrective price action
So the price bounced off the $80k and is now in a sideways consolidation
This is how the Bear Flag pattern has formed (white lines)
I think one more minor leg up is likely to complete the corrective structure
Watch for a breakdown of the flag’s downside to target the distance of the flagpole below
This aligns with both the downside of the descending channel and the $64k strong support
As I checked, MicroStrategy’s (MSTR) BTC cost basis is around $66k
Watch RSI as it should remain bearish below 50 to support the drop

BTCUSD — Strong Supply Rejection & Bearish Continuation SetupBTCUSD is reacting strongly to the major supply zone, where sellers have stepped in multiple times, creating consistent price rejections. Each attempt to break above this level has failed, confirming that this zone is a high-pressure resistance area.
After the failed breakout, price formed a trapping area, indicating that smart money trapped late buyers before reversing the market. This is a classic sign of distribution, where buyers lose strength and sellers take control.
Additional bearish signals include:
Multiple wick rejections at resistance showing aggressive selling
Lower highs forming inside the range, signaling weakening bullish momentum
Break of internal structure, confirming sellers are gaining control
Absence of strong bullish volume, showing buyer exhaustion
Price now heading toward the nearest support and liquidity levels
With strong supply overhead and buyers losing momentum, market sentiment remains bearish, and BTCUSD is likely to continue drifting downward toward the demand zone area and the marked target level.
If this analysis helps you, hit like and drop your thoughts below!

Nasdaq Buy Area Buy Nasdaq once retest IFVG , Algo 2 is running in Daily time frame
expecting big candle once break this breaker

CAKE/USDT Long Setup— Multiple resistance tests, decreasing volatility, price compression under the level
— Entry: Conditional order (NOT market)
Trigger: $2.356
Limit buy: $2.358
— Stop: $2.265 — 3.5% is the price movement from entry to stop, NOT the loss percentage
— Target: $2.55
Risk per trade: 0.5% of the total account — this is the percentage of potential loss
Position size: 15% of the total account, 10x leverage
RR: 1:2.25

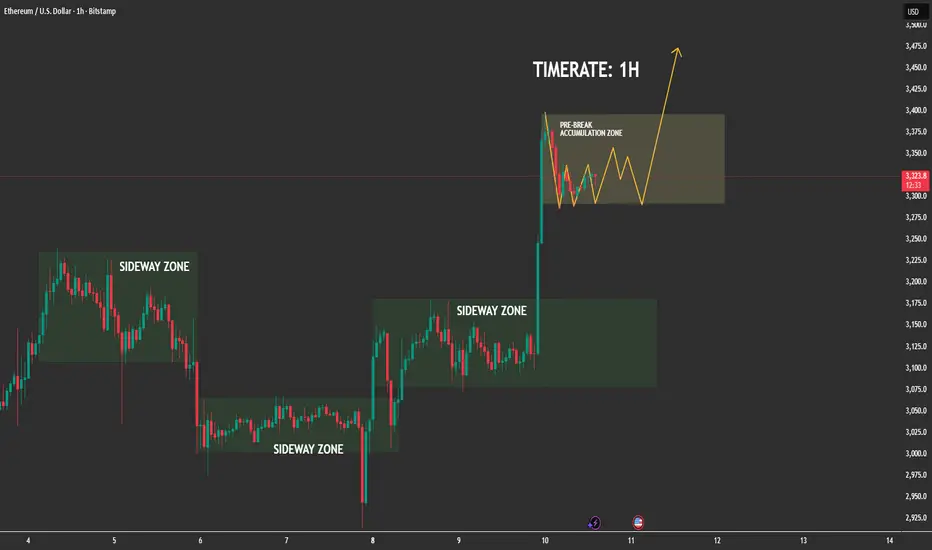
Ethereum Has Entered Its Pre-Expansion Accumulation📊 (1) MARKET STRUCTURE — CLEAN SIDEWAY → BREAKOUT → RE-ACCUMULATION
The chart shows a repeating pattern:
✔ Phase 1: Sideway Zone
ETH repeatedly compresses in sideways zones, forming liquidity pools and equal highs/lows.
✔ Phase 2: Breakout With Strong Momentum
Each sideways block ends with a powerful impulsive candle clear evidence of aggressive buy-side imbalance.
✔ Phase 3: Post-Break Re-Accumulation (CURRENT PHASE)
Price is now inside the highlighted pre-break accumulation zone,
moving in a tight, controlled structure a textbook bullish continuation setup.
This is the phase where institutional traders rebalance orders before the next run.
📍 (2) PRICE BEHAVIOR — BULLS IN FULL CONTROL
-No sharp rejections after the breakout
-Dips are shallow and quickly absorbed
-Market is forming higher low micro-structures
-Momentum clearly stays in the hands of buyers
This confirms the market is not distributing, but absorbing liquidity and building a base.
🌐 (3) MACRO FACTORS SUPPORTING ETH UPSIDE
✔ ETH ETF Approval Momentum (US + Asia)
Regulatory mood continues shifting positively, with multiple jurisdictions preparing Ethereum ETF products. Institutional demand keeps increasing quietly in the background.
✔ Falling US Inflation & Dovish Fed Expectations
Recent CPI and PPI reports show cooling inflation. The market widely expects 2025–2026 rate cuts, which historically push liquidity into risk assets ETH benefits directly.
✔ Ethereum Supply Shock
-Over 27% of ETH is staked
-Net supply remains deflationary under high network activity
-Reduced exchange reserves signal accumulation
This creates a tightening supply environment that amplifies price expansion.
✔ Altcoin Rotation Phase
BTC dominance stabilizing → capital increasingly flows into ETH and large-cap alts.
Macro + on-chain + liquidity flows all align with a bullish continuation.
⏳ (4) HTF CONTEXT — BULL CYCLE CONFIRMED
Higher timeframes show:
-ETH broke out of a weekly compression range
-Structure is fully bullish
-Market currently resetting before next leg
-No bearish reversal signals anywhere in sight
This supports the thesis that the current 1H accumulation is not random, it is part of a much larger bullish leg forming.
🚀 (5) EXPECTATION — HIGH PROBABILITY SCENARIO
ETH is expected to:
-Continue oscillating inside the pre-break accumulation zone
-Form a series of small higher lows as drawn
-Absorb liquidity from both sides
-Break out toward 3,400 → 3,450+
The path of least resistance remains upward.
🎯 (6) TRADING INSIGHT (Non-Signal)
Markets only explode after liquidity is collected.
ETH is doing exactly that holding strong after a breakout and compressing before expansion.
This is the signature behaviour of a healthy bullish trend.
Gold Just Flipped Structure.....The market just transitioned from a bearish sequence into early bullish structure. Most traders will miss this shift but if you understand BOS, ChoCH, and liquidity behaviour, this is where smart money prepares for the next leg up.
1. Market Structure Overview
Your chart shows a full bearish sequence (LH–LL) that has recently transitioned:
-Multiple Lower Highs (LH) and Lower Lows (LL) → clear bearish structure.
-A Change of Character (ChoCH) occurs at the key zone → first signal of reversal.
-A clean Break of Structure (BOS) to the upside confirms buyers stepping in.
-Price then creates a Higher Low (HL) followed by Higher Highs (HH) → early bullish trend established.
This is a textbook reversal from bearish → bullish.
2. Key Zones Identified
Support Zone (Demand)
Located around 4195 – 4174
→ This is where the ChoCH and HL formed, confirming buyer strength.
Resistance Zone (Supply)
Located around 4219 – 4229
→ Price is currently approaching this zone. If it breaks, bullish continuation is expected.
3. Price Behaviour & Expectation
Your yellow projection is correct:
- Price may pull back into the minor support (near current level).
- After that, a bullish leg toward 4219 zone is expected.
- If BOS occurs above 4229, price has room to expand toward new highs around 4238–4244.
This aligns perfectly with the HH → HL structure forming now.
4. Trading Logic
Why bullish?
- Clear BOS on bullish side
- Higher Low forming above support
- Liquidity taken from previous LL
- Price respecting the new bullish structure
Invalidation
If price breaks below 4174, bullish structure is invalidated.
5. Trade Signal
This follows your trading style — structure-based, clean, and logical.
📌 BUY ENTRY: 4203 – 4207
(Retesting minor support + inside new bullish structure)
📌 STOP LOSS: 4178
(Below HL and below ChoCH zone — strong invalidation)
📌 TAKE PROFIT 1: 4219
(Retest of resistance zone)
📌 TAKE PROFIT 2 (Main Target): 4229 – 4233
📌 TAKE PROFIT 3 (Extended Target): 4242 – 4244
Risk–Reward:
1 : 2.5 up to 1 : 4 depending on TP

XAG/USD: Major Resistance Cleared, What Comes Next?🥈 XAG/USD — SILVER VS U.S. DOLLAR
Metals Market • Swing / Day Trade Opportunity Guide 🧭📈
⚙️ Market Outlook — Bullish Confirmation
Silver has broken through a major resistance zone, shifting momentum firmly into bullish territory.
This breakout signals the presence of strong buyers stepping in, making the market attractive for both short-term and swing-trade setups.
🎯 Trade Plan
📌 Entry:
Enter at any available level after the confirmed breakout retest.
Bullish continuation patterns are forming, giving us a clean pathway to the upside.
🛡️ Stop Loss — Thief Style SL @ 57.000
Dear Ladies & Gentlemen (Thief OG’s), secure your capital wisely.
Adjust SL according to your personal system, risk appetite, and style.
I do not recommend copying my SL blindly — your strategy = your rules.
🎯 Target — Profit With Precision @ 62.000
We have:
🧱 Strong resistance zone
🔥 Overbought conditions expected
🎭 Potential bull-trap areas above
So escape with profits once the market hits our zone.
Dear Ladies & Gentlemen (Thief OG’s), your TP is also your choice — manage your profits with discipline.
🔗 Correlated & Related Pairs to Watch ($ Versions Included)
Tracking these helps confirm momentum, spot divergences, and follow overall metals sentiment.
1️⃣ XAU/USD (Gold vs USD) — TVC:GOLD
Why watch?
Gold and Silver often move together due to safe-haven demand.
When Gold surges strongly while Silver lags, Silver usually follows.
If Gold rejects from resistance, Silver may also cool off.
Key Point:
Gold strength = higher probability continuation in Silver’s bullish wave.
2️⃣ XAU/XAG (Gold-to-Silver Ratio) — $GoldSilverRatio
Why watch?
A falling ratio means Silver is gaining strength faster than Gold.
A rising ratio signals Silver weakness.
Key Point:
A drop in the ratio supports our bullish Silver narrative.
3️⃣ DXY (US Dollar Index) — TVC:DXY
Why watch?
Silver is priced in USD.
When DXY drops, metals typically rise due to USD weakening.
Key Point:
If TVC:DXY shows bearish momentum → Silver bullish continuation is more confident.
4️⃣ XAG/EUR (Silver vs Euro) — OANDA:XAGEUR
Why watch?
Useful to understand Silver’s global demand, not just USD-denominated.
If Silver is bullish across currencies, then the trend is fundamentally strong.
Key Point:
Multi-currency strength confirms genuine Silver demand.
5️⃣ Copper Futures (HG) — CAPITALCOM:COPPER
Why watch?
Silver has partial industrial demand.
When copper rises, it signals industrial activity strength → bullish for Silver.
Key Point:
Copper strength = supportive macro backdrop for Silver.
🧠 Final Outlook
A clean breakout, supportive cross-metal correlations, and favorable USD weakness give Silver an attractive path toward 62.000.
Trade smart, protect your capital, lock in profits, and execute like true Thief OG’s. 🥷📊

GBPUSD at support LongGBPUSD price has returned to the Support level from this area the price may resume to higher level within this channel . let us see how it plays out.

EURUSD Sell???Price has been in a descending weekly range, however during that time I've been in profit and taking partials while scaling in as well to account for swap fees, you guys should know my trading style by now, once I take direction I will commit until I see a break in the form of CISD then I will wait for retracement then exit.
Long story short I'm still short on EU, actually looking for more scaling in opportunities today as I expect FED rate cuts to strengthen my position pushing price closer to my TP 1.154.

It's a time for RKLB - 45% potential profit - 62 USDThe chart shows Rocket Lab Corporation on the daily timeframe. After a strong bullish trend, the price entered a deep correction phase, dropping into the 41–42 USD area. Currently, the decline appears to be losing momentum, and price action shows signs of stabilizing around a key support zone. This area has previously acted as a demand zone, which increases the likelihood of a short-term bounce.
The price is currently positioned below two moving averages, but it has started to approach them from underneath. This may indicate a potential short-term trend reversal if the price breaks above the first moving average and holds above it. Such behavior often signals the beginning of a corrective or reversal move to the upside.
The RSI indicator is in low territory, suggesting that the stock is near oversold conditions. Historically, this often results in a technical rebound as selling pressure weakens and buyers re-enter at discounted levels. Moreover, recent candlestick structure indicates decreasing selling pressure and early signs of demand returning to the market.
The highlighted price projection toward the 62 USD level reflects a potential corrective move back into a previous resistance zone, which also aligns with a psychological price level. From a technical perspective, this area represents a logical first upside target following such a strong downward move. If buying momentum continues and price breaks through local resistance levels, a move toward the 60–62 USD region in the near term is a realistic scenario.
Overall, the technical picture suggests that the stock may be entering an early recovery phase after a strong decline, with growing probability of a short-term upward movement. The coming sessions will be critical — a breakout accompanied by increased volume would strengthen the case for a move toward the 62 USD level.
Potential TP: 62 $
⚠️ Disclaimer
This analysis is for educational and informational purposes only and does not constitute financial or investment advice. The financial markets involve risk, and past performance is not indicative of future results. Always conduct your own research or consult with a licensed financial advisor before making any investment decisions.

Analysis of USA Rare Earth $USAR Investment PotentialOverview of Government Investment in Strategic Minerals
USA Rare Earth ( NASDAQ:USAR ) has emerged as a potential candidate for government investment, following in the footsteps of other strategically significant companies. For instance, the Department of Defense (DoD) acquired a 15% stake in MP Materials for $400 million in July 2025, becoming the company's largest shareholder. Additionally, the administration has taken equity positions in Lithium Americas and Trilogy Metals. These actions are part of a broader initiative aimed at securing domestic supply chains for critical minerals.
Current Status and Prospects of USAR
At present, USA Rare Earth is considered a speculative investment due to its lack of profitability. Nevertheless, the company's future prospects appear favorable as it continues to develop rare earth mines and processing facilities. The strategic importance of these resources adds to the potential upside of the company.
Technical Analysis and Trading Strategy
A positive chart pattern has been identified for USAR, characterized by a rounded bottom, a recent pocket pivot, and a flat base formation. As of today, the stock is retracing toward its 21 Day Exponential Moving Average (EMA), indicated in blue on the chart. Ideally, further consolidation around this level would allow the stock to form a clear higher low. Should NASDAQ:USAR achieve this and resume its upward trend, initiating a starter position is planned. If the stock subsequently breaks above the established resistance area, the intention is to build out the position further.
Risk Considerations and Recommendations
Readers are strongly encouraged to conduct their own analysis and to adhere to their individual trading strategies. It is important to recognize that all investments carry inherent risk. Careful and informed decision-making is essential when allocating capital in financial markets.

MU – Trend Still Intact, EMA50 Bounce SetupMU - CURRENT PRICE : 220.00 - 222.00
Technical Reasons (Bullish Bias)
1️⃣ Price retesting strong dynamic support
Price is holding above the 50-day EMA, which has acted as support throughout the uptrend. Pullback into EMA50 often forms a bullish continuation point.
2️⃣ Price still above the Ichimoku Cloud
Price is trading above the cloud, meaning long-term trend remains bullish. The cloud is thick — showing strong trend support. Latest pullback is testing the top of the cloud, usually a high-probability bounce area.
3️⃣ RSI turning up from mid-zone (not overbought)
RSI is around 50, which is a healthy reset in an uptrend. No overbought conditions → room for upside continuation.
4️⃣ Trend structure remains bullish
Higher highs & higher lows remain intact. Current candle shows buying interest at key support.
5️⃣ Market respects previous breakout area
Price pulled back to retest September–October breakout zone → classic break-and-retest setup.
ENTRY PRICE : 218.00 - 222.00
FIRST TARGET : 236.00
SECOND TARGET 260.00
SUPPORT : 201.00

EURCHF Price Test the resistance before fall EURCHF moving within a well-defined ascending channel. Price has recently reached the upper boundary of this channel, entering a grey supply/resistance zone around 0.93900 – 0.94000.
Technically if the touching this resistance region, the chart illustrates a projected scenario then Price has been respecting both the upper and lower trendlines for several days the area above 0.93900 is highlighted as a potential sell zone, where price has stalled and shown signs of rejection if the bearish trend maintain we could see side target will be 0.93400 to 0.93000 after rejecting the top channel, the chart suggests a potential break below the mid-channel, followed by a deeper decline toward the lower levels.
You may find more details in the chart,
Trade wisely best f luck buddies.
Ps; Support with like and comments for better analysis thanks for supporting.

USD/JPY Looking sell from key supply zone 157,800 📉USD/JPY Sell Setup
Watching price react from the key supply zone at 156.800 on the 4H timeframe.
🎯 Technical Targets:
1️⃣ First Target: 155.800
2️⃣ Second Target: 154.500
💧 Liquidity Zone:
157.900
⚠️ Risk Management First!
Always use proper position sizing and protect your capital.
👇 Like, Follow, Comment & Share for more setups! 🚀📊

Swing Trading AUD/CAD: A Detailed Bullish Scenario📌 𝐀𝐬𝐬𝐞𝐭: AUD/CAD — “Aussie vs Canadian Dollar”
𝐅𝐨𝐫𝐞𝐱 𝐌𝐚𝐫𝐤𝐞𝐭 𝐓𝐫𝐚𝐝𝐞 𝐎𝐩𝐩𝐨𝐫𝐭𝐮𝐧𝐢𝐭𝐲 𝐆𝐮𝐢𝐝𝐞 (𝐒𝐰𝐢𝐧𝐠 𝐓𝐫𝐚𝐝𝐞)
🧭 𝐓𝐫𝐚𝐝𝐞 𝐏𝐥𝐚𝐧: 𝐁𝐮𝐥𝐥𝐢𝐬𝐡 — 𝐌𝐀 𝐏𝐮𝐥𝐥𝐛𝐚𝐜𝐤 + 𝐏𝐫𝐞𝐜𝐢𝐬𝐞 𝐑𝐞𝐭𝐞𝐬𝐭 𝐂𝐨𝐧𝐟𝐢𝐫𝐦𝐞𝐝
The trend structure remains bullish with clean higher-lows. Price has reacted strongly from the dynamic support zone around the Moving Averages, validating a trend-continuation setup. Momentum stays on the buyers’ side with exhaustion signs on the sellers.
🎯 𝐄𝐧𝐭𝐫𝐲: 𝐌𝐮𝐥𝐭𝐢-𝐋𝐚𝐲𝐞𝐫 𝐁𝐮𝐲 𝐎𝐫𝐝𝐞𝐫 𝐒𝐭𝐫𝐚𝐭𝐞𝐠𝐲 (𝐓𝐡𝐢𝐞𝐟 𝐌𝐞𝐭𝐡𝐨𝐝)
This plan uses a layered limit entry system to reduce risk and improve average execution:
Buy Limit Layers:
0.91400
0.91500
0.91600
0.91700
(You may increase or decrease layers based on your personal strategy.)
Concept: This layering method allows catching pullback liquidity sweeps and retest reactions across micro-levels — ideal for swing positioning.
🛡️ Stop Loss (SL): 0.91200
This is the proposed Thief SL.
However, you must adjust SL based on your risk tolerance, trade size, and personal strategy.
Your money—your responsibility.
🎯 Target (TP): 0.92400
Price is approaching a Police Barricade Zone — a strong resistance area where:
Market is entering overbought territory,
A possible bull trap might form,
Liquidity zones cluster tightly.
Take profits safely.
Again, adjust TP as per your risk and comfort.
📚 Related Pairs to Watch (Correlation Insights)
💱 1. USD/CAD ( OANDA:USDCAD )
Correlation: Moderate Positive
When CAD strengthens (often due to oil), USDCAD tends to drop, and AUDCAD may also feel downside pressure.
Watch oil and CAD macro data.
💱 2. AUD/USD ( OANDA:AUDUSD )
Correlation: Strong Positive with AUD strength
If AUD shows broad market strength versus USD, chances increase for AUD to outperform CAD as well.
Risk sentiment (RISK-ON/RISK-OFF) heavily impacts it.
💱 3. CAD/JPY ( OANDA:CADJPY )
Correlation: Risk sentiment indicator
When CADJPY weakens, global risk sentiment may be shifting, which can slow AUDCAD bullish momentum.
💱 4. AUD/JPY ( OANDA:AUDJPY )
Correlation: High risk sentiment sensitivity → guidance for AUD strength
If AUDJPY rallies, it shows strong AUD flows—supportive for AUDCAD longs.
💱 5. WTI Crude Oil ( TVC:USOIL )
Correlation: Inverse Effect on AUDCAD
CAD is an oil-linked currency.
Rising oil → CAD strengthens → AUDCAD may drop.
Falling oil → CAD weakens → AUDCAD tends to rise.
🧠 Final Notes
This is a structured swing setup designed for layered execution, strong risk control, and clarity.
Always adapt entries, stops, and targets to your own strategy.
Trade responsibly, trade smart.

XAGUSD – 4H OutlookBias: Short-term corrective move after hitting major supply zone.
XAGUSD just tapped a strong 4H supply zone around 62.70 – 63.00, and price immediately rejected with a clear wick. This confirms sellers are active at this level.
Structure-wise, silver has been moving in a parabolic impulse, and now the chart is showing the first signs of exhaustion. If the rejection holds, market likely forms a lower high before shifting into a deeper correction.
Key Levels
62.70–63.00 (Supply Zone – Strong Rejection)
61.98 (First support / retest area)
60.62 (Major 4H structure support)
59.31 (Bigger correction target)
What I Expect Next
Price retests the supply zone → forms a lower high
Pullback continuation toward 61.98
Break below opens the door to 60.62
Full correction target sits near 59.30
Momentum indicators also show bearish divergence + Stoch RSI cooling off, supporting a temporary downturn before any bigger trend continuation.
Summary
XAGUSD likely enters a short-term correction phase after rejecting a key supply area. I expect price to form a lower high and continue down toward the 60–59 zone unless buyers reclaim and hold above 63.

EURCHF 1D EURCHF shows a clean technical structure that rarely deceives a focused trader. After a strong impulse price reacted precisely at the 0.786 Fibonacci level at 0.93884 confirming strong demand near the upper boundary of the range. The current setup suggests a pullback toward the 0.5 Fibonacci level at 0.93123 which forms the optimal continuation zone. As long as price maintains this area the trend remains bullish and limits the risk of a deeper correction. Once the market stabilises above the Fibonacci cluster the first target stands at 0.94419. The second target at 0.96107 reflects the natural extension of the current impulse. Volume supports buyers and creates favourable conditions for a sustained move higher. The logic here is simple the market pauses only to regain strength for the next leg.

EMA 34 & 89 Signal That the Uptrend Is Still Not ConfirmedHello everyone,
BTC is currently in a clear transition phase as the 34 EMA (red) remains below the 89 EMA (blue), or has only barely crossed upward without forming enough separation to confirm a new bullish trend. Price is hovering around 91,000–92,000, sticking closely to the EMA cluster, which at this stage acts more as dynamic resistance than a reliable support. Looking left on the chart, the 92,000 zone corresponds to the previous distribution top — a major supply area filled with trapped orders — making any breakout attempt even more difficult. In other words, BTC is simply retesting the 34–89 EMA cluster combined with old supply, and the probability of a strong immediate reversal is relatively low.
From a macro perspective, the hesitation becomes even more understandable. The Federal Reserve and its rate-cut path remain the biggest variables: markets expect further cuts, but nothing official has been delivered. Without clarity on how dovish the Fed intends to be, major funds are unlikely to aggressively rotate into risk-on assets like crypto. Liquidity inflows also remain muted — no new spot ETF catalysts, no institutional accumulation announcements, and on-chain data shows no strong capital inflow into BTC. As a result, price has enough momentum to retest EMAs, but not enough to break through resistance and establish a sustainable uptrend. Sentiment is also mixed: short-term traders are taking profit into resistance after the recent dump, while buyers prefer to wait for clearer Fed signals, limiting the strength of any chase buying.
Given this backdrop, I still view the current recovery as a technical bounce within a broader weak structure. With the 34 EMA yet to meaningfully separate above the 89 EMA and price still fluctuating around 91–92k, BTC needs one of two conditions to confirm a real breakout: either a strong positive catalyst (aggressive Fed cuts, significant USD weakness, or a clear return of ETF inflows), or a deeper pullback into lower-timeframe demand to build a base first. My preferred scenario is continued choppy movement around the 34 & 89 EMA cluster; and if price keeps rejecting 92k and eventually closes a 4H candle below 90k, the likelihood of revisiting 88k–86k increases before any strong and sustainable rally can take shape.
