TECHNICAL ANALYSIS – BTCUSD (4H)1. Market Structure: Ascending Channel (Orange)
The chart clearly shows an ascending trend channel – the upper and lower orange lines.
Lower Channel Support: ~$87,000
Upper Channel Resistance: ~$96,000
Medium-term trend = uptrend as long as the price remains within this channel.
2. Key Levels You Have Marked
Resistance
$94,133 – local resistance from which the price recently rejected.
$95,866 – upper boundary of the resistance zone + near-upper channel line.
$99,067 – high target upon channel breakout.
Support
$92,190 – price is currently within this zone, struggling to maintain it.
$90,757 – important intraday support; a breakout opens the way lower.
USD 88,203 – strong support, converging with the lower part of the channel.
3. Price action
Currently, I see:
Rejection from the 94.1k level, which is resistance.
Attempt to return to the center of the structure, but the candlestick is rejected from above.
The market is making a short-term lower high → slight weakening of momentum.
4. Stoch RSI
Stoch RSI (4h):
The lines are in a downward trend from the upper levels, meaning a short-term correction is just beginning.
There is no signal for an upward reversal yet → momentum favors a move to lower support levels.
⭐ 5. Scenarios for the next hours/1–2 days
BULLISH (if BTC maintains 92k–90.7k)
Condition: No break below $90,757
Potential moves:
Consolidation at 92k–91k
Stoch RSI begins to curve upward
Attack:
$94,133
$95,866 (upper channel resistance)
Target:
→ $96,000
→ possible test of $99,000 with a strong breakout
BEARISH (if BTC breaks $90,757 down)
This is a key level. If it breaks:
A quick decline to $88,203
High probability of a retest of the lower channel line (~87k)
This still won't destroy the uptrend, but it will open the door to buying lower.
X-indicator

Mean Reversion Setup: VNQ1. RSI in oversold region
2. Price likely to rebound back the the mean
Trade Rules:
Entry Trigger - RSI has cross below oversold region, enter limit buy at close price
Exit Trigger - Close at market when close price cross above exit trigger (Red Line)

Gold before breakout its in range watch levels📊 Gold (XAU/USD) – 30M Timeframe Outlook
📌 Key Range: 4202 – 4218
🔼 Bullish Scenario:
If price breaks above 4218, upside targets are:
✨ 4230
✨ 4237
✨ 4248
🔽 Bearish Scenario:
If price breaks below 4202, downside supports are:
🛑 4193
🛑 4178
🛑 4170
💡 Note: Always use proper risk management and wait for confirmation before entering any trade.
👍 Like | 💬 Comment | 🔁 Share

PIOC - PSX - Technical AnalysisPIOC on monthly TF, after making a Cup & Handle pattern has started its bull run in June 2023 which is still going strong.
RSI is almost in the same region since Nov 2023 and therefore it points to somewhat constant and upward buying sentiments in this SCRIPT. Also on monthly TF there is a hidden bullish divergence, which may cause a sudden pumping up of the price.
As per AB=CD pattern TP can be 364 and as per Cup&Handle pattern, TP can be 404 which is even higher.
Trade values:
Buy-1 : 291 (CMP)
SL: 260
TP1: 364
TP2: 404

Bitcoin reaction to FED RATE choices since 2021
It is really very simple
Back in 2021 and 2022, Bitcoin PA did what it was intended to do and rate decisions did not directly inpact Bitcoin at all.
We had the traditional 9-% pull back, as we had had in previous cycle.
The impact in the rising Rates was on companies in the Crypto Sphere, that suffered as rates were increased.
Repaying th eloans became intolerable.
Lets look at this cycle, from late 2022 to current day
Despite Steep Rate rises in late 2022, Early 2023, Bitcoin Price and trading Volume INCREASED.#
In Late 2022, you can see that a steep 75 point increase did not phase BTC from trying to rise but the impact on crypto companies and Banks began scaring people and the next 75 point rise tipped many over
But Bitcoin found a floor and remained there.
Then we had a 50 point rise and PA remained were it was...NO IMPACT>
Then we had a series of 3 x 25 point rises.
Bitcoin Rose through the first of those and fought back in the other 2, dipping slightly as the OverSold MACD cooled off ( this was on lower time frames )......The ONLT reason for the Range to lower prices
Weekly MACD
The Green box shows the period that BTC PA ranged, March to September 2023
THIS was the defining period for BITCOIN
Once it became cheaper to borrow nd ETF's were allowed. off we went.
Is Cheaper borrowing likely to sustain Bitcoins rise ?
OF COURSE
But please remain cautious.
100K -> 110K usdt is the line of possible rejection and has potential to enter Bitcoin into a Deeper Bear.
REMEMBER. BITCOIN is NOT effected by Rates, as we saw in early 2023, and If a BEAR Market is required, then it will happen no matter if Rates are lower.
For Me, I think we will see a rise, a Dip and then, around March next year,we will see the defining moment that will decree where we REALLY go
MACRO events can always accelerate that

XAUUSD: Bullish Trend Strengthens After Dip Toward 4170.Analysis:
Gold is currently trading around the 4180 zone, holding firmly above the key intraday support at 4170. The strong support remains positioned at 4151, which is the level bulls must defend to keep upward momentum intact.
On the upside, the immediate resistance stands at 4198, followed by a secondary barrier at 4218. A breakout above 4198 would signal renewed bullish momentum and open the door for a test of 4218, where stronger supply pressure may appear.
The recent dip toward 4170 was met with solid buying interest, reinforcing bullish sentiment. With the market pricing in the Fed’s rate-cut outlook, gold continues to benefit from broader macro support. Lower rate expectations typically weaken the dollar and reduce yields, giving gold an additional push toward the upside.
📈 Bias: Bullish
📍 Key Levels:
Support: 4170 / 4151
Resistance: 4198 / 4218
Target : 4240
As long as price holds above 4170, the bullish trend remains favored. A sustained move above 4198 could accelerate the next upward leg.

XEL in BUY ZONEMy trading plan is very simple.
I buy or sell when at either of these events happen:
* Price tags the top or bottom of parallel channel zones
* Money flow volume spikes beyond it's Bollinger Bands
So...
Here's why I'm picking this symbol to do the thing.
Price in buying zone at bottom of channels
Money flow momentum is spiked negative and outside of Bollinger Band
Entry at $74.62
Target is upper channel around $78.50

Pre FomcSPX may have put in a leading diagonal. if so we should see a test of the highs. Vix can also drop first before moving higher. I still expect traps and a rally before a fall. I check some other markets as well...

The possibilities of tomorrowExpect tricks and traps tomorrow but ultimately I believe the market will drop no matter what it looks like for a few hours. I cover the SPX and Vix mostly for the video.

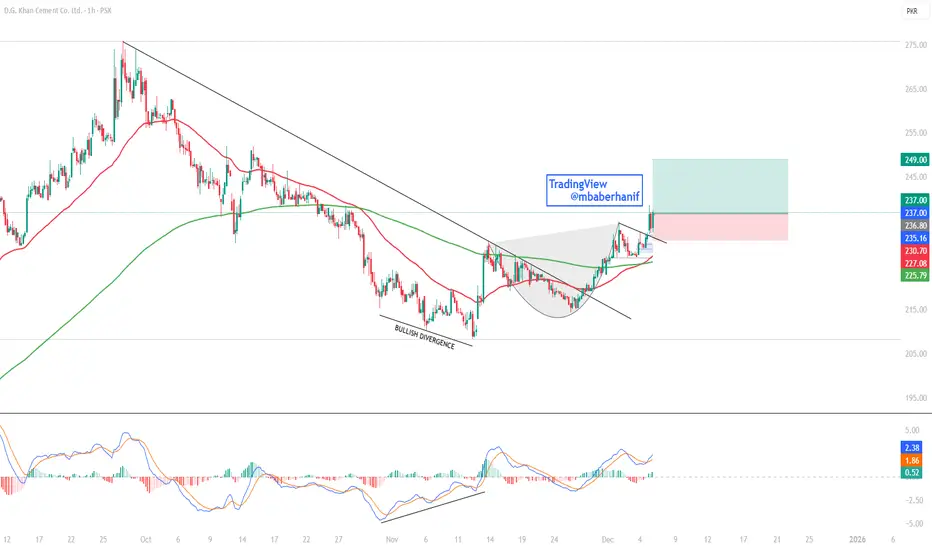
DGKC | Cup-and-Handle Breakout in Motion!DGKC has completed a clean cup-and-handle formation after breaking its multi-week downtrend, and today’s strong bullish candle has confirmed the handle breakout with rising momentum. Price is now holding firmly above the breakout zone near 236–237 , showing strength and opening the door for an upside continuation toward the 249 region, which aligns with the measured move of the pattern. As long as the stock sustains above the 231–232 support cluster (handle low + retest zone), the bullish structure remains intact, keeping buyers firmly in control and momentum favoring further upside. Use stop loss at 230.70 to manage your risk.
AMD OutlookHere it goes.
Yes, some of yall might see this and say "uh yeah crazy analysis, you just drawn up all the possible scenarios" since all the market can do is go up, down or consolidate.
Well, no.
This is about expected behaviour and bias.
As long as we are inside the top box, following the yellow line I'd trade rotations from the extremes.
If we break below, following the red line , I'd expect our next stop to be between 152-174.
This is where I would fill spot bags, get calls, whatever. It's a great zone for accumulation.
If we break, following the green line , above I'd continue to be long. Keep an eye on the macro-economics. Especially deals with China and the further progression of Companies like Moore Threads pose a threat to NASDAQ:NVDA and AMD.
Same with the TPUs from $GOOG.
Anyways, that's just my two cents.
Happy Trading.

My BUY on BTC ActiveBroke down my reasoning for wanting to BUY BTC at this level in my previous post from yesterday about what I wanted to see happen before pulling the BUY Trade signal. It's now live and active. Let's see how this plays out.

NZDUSD BUYSNZDUSD - ACCUMULATION
Same as AU; price has accumulated, liquidity has been swept, and we have entered the last phases, so for me the next move is a pullback to go higher (same view on most dollar pairs).

Bullish Momentum on EURUSD — Buy Scenario ActivatedEURUSD is showing positive momentum and is positioned for a potential bullish continuation. A buy entry from 1.16060 aligns with current upward structure, supported by improving risk sentiment and a softer dollar tone.
Price remains above key short-term support, indicating buyers are maintaining control. A break and hold above intraday resistance zones could accelerate the move toward 1.17000. Keep an eye on USD fundamentals and market volatility for confirmation.
Key Level
Entry 1.16060
Stop Loss. 1.15900
Target. 1.1700

EMA 34 & 89 Signal That the Uptrend Is Still Not ConfirmedHello everyone,
BTC is currently in a clear transition phase as the 34 EMA (red) remains below the 89 EMA (blue), or has only barely crossed upward without forming enough separation to confirm a new bullish trend. Price is hovering around 91,000–92,000, sticking closely to the EMA cluster, which at this stage acts more as dynamic resistance than a reliable support. Looking left on the chart, the 92,000 zone corresponds to the previous distribution top — a major supply area filled with trapped orders — making any breakout attempt even more difficult. In other words, BTC is simply retesting the 34–89 EMA cluster combined with old supply, and the probability of a strong immediate reversal is relatively low.
From a macro perspective, the hesitation becomes even more understandable. The Federal Reserve and its rate-cut path remain the biggest variables: markets expect further cuts, but nothing official has been delivered. Without clarity on how dovish the Fed intends to be, major funds are unlikely to aggressively rotate into risk-on assets like crypto. Liquidity inflows also remain muted — no new spot ETF catalysts, no institutional accumulation announcements, and on-chain data shows no strong capital inflow into BTC. As a result, price has enough momentum to retest EMAs, but not enough to break through resistance and establish a sustainable uptrend. Sentiment is also mixed: short-term traders are taking profit into resistance after the recent dump, while buyers prefer to wait for clearer Fed signals, limiting the strength of any chase buying.
Given this backdrop, I still view the current recovery as a technical bounce within a broader weak structure. With the 34 EMA yet to meaningfully separate above the 89 EMA and price still fluctuating around 91–92k, BTC needs one of two conditions to confirm a real breakout: either a strong positive catalyst (aggressive Fed cuts, significant USD weakness, or a clear return of ETF inflows), or a deeper pullback into lower-timeframe demand to build a base first. My preferred scenario is continued choppy movement around the 34 & 89 EMA cluster; and if price keeps rejecting 92k and eventually closes a 4H candle below 90k, the likelihood of revisiting 88k–86k increases before any strong and sustainable rally can take shape.

PLAY/USDT — Tight Ascending Structure Pressing Into Major ResistHey there!
December 10, 2025
PLAY has been coiling inside a very tight ascending structure, gradually pushing into its main resistance zone.
This type of price action is a classic sign of pressure building before a potential breakout.
The chart is showing one of the strongest bullish setups it has formed in weeks.
🔍 Technical Overview
Current price: ~$0.0336
4EMA: ~$0.0309 → price is consistently holding above it.
Volume has increased during the recent push upward, confirming genuine interest and accumulation near resistance.
📊 Market Structure Breakdown
1. Ascending triangle formation (late November → December)
Price is forming:
Higher lows
Flat resistance around $0.034–0.035
Tight compression inside a rising structure
This pattern generally signals bullish continuation, especially when forming beneath a clear resistance band.
2. First breakout attempts with rejection wicks
PLAY has already tested the resistance zone multiple times:
Each test produced upper wicks
But none resulted in a structural breakdown
Lows continue to rise each time
This means sellers are losing control and buyers are absorbing supply.
3. Price remains above EMAs → momentum still bullish
The short-term trend is clean:
Price riding the EMA
Higher lows maintained
No breakdown from structure
As long as PLAY stays above $0.031–0.032, the bullish thesis remains intact.
🧱 Key Levels
Major Support Zones
$0.031–0.032 → ascending triangle support
4EMA (~$0.031) → dynamic support
A breakdown below these would weaken the bullish setup.
Resistance to Break
$0.034–0.035 → key ceiling
This is the zone PLAY must close above to trigger expansion.
🎯 Breakout Targets
If PLAY breaks above $0.035, the next targets are:
$0.040 → minor liquidity level
$0.050–0.055 → next structural resistance
This is where the chart has historical supply and where liquidity is likely hiding.
The distance between current price and higher levels is large — meaning the breakout could have strong follow-through.
🔮 Outlook
PLAY is in a high-pressure compression against resistance, forming a textbook continuation pattern.
Bullish if:
Price closes above $0.035
Higher lows continue
Volume increases on the breakout
This would open the door to $0.040 and then $0.050+.
Bearish only if:
Price falls below $0.031
Ascending structure breaks
EMAs lose support
Until then, momentum remains clearly bullish.
Have an amazing week!

Ethereum Analysis + Correlation of Bitcoin + Advanced TAHow can you analyze Ethereum deeply using volume, visible range, and RSI, together with technical and correlation analysis in the crypto space?
How does correlation work between Bitcoin and Ethereum?
And additionally, how do I personally approach technical analysis, where to look right now on Ethereum itself, and which direction the market and the crypto space are moving?
If this video reaches 10 likes or more, I will do an update on that.
Until then, I wish you the best.
And if you like the video, don’t forget to comment, like, and share.
Also, leave me a comment below on which asset I should talk about next, or which strategies or problems you are currently facing in trading.
Happy to help, just share it in the comments.
And let me know as well if you like this type of video, Face sharing.

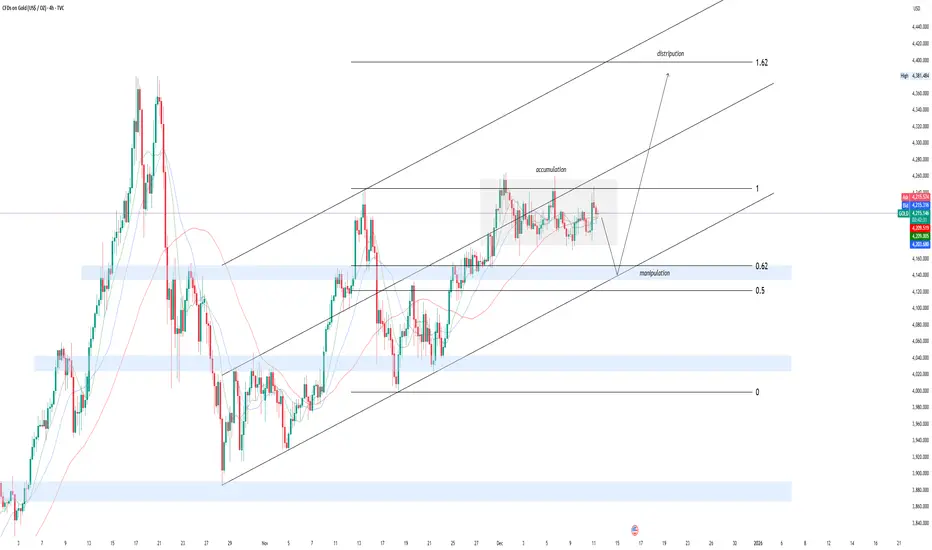
XAUUSD – LONG ACCUMULATION (Weekly/Monthly)XAUUSD – LONG ACCUMULATION (Weekly/Monthly)Entering BUY at current levels: 4180–4200
Final Target: 4500–4600+ (Breakout Q1 2026)
Stop Loss: 4000 (below major trendline) Pattern repeating: 2024 Dec sideways → 2025 mirror setup. Jan 2026 bull leg incoming after accumulation.NOT financial advice
DYOR | Trade at your own risk!#XAUUSD #Gold #GoldTrading #Bullish #PreciousMetals #Forex #Commodities #Trading #InvestingStacking time – who’s in?
This is only for big investors and this is swing trade.. So be careful

EUR/GBP Bearish Structure Activated After Technical Breakouts!🔥 EUR/GBP "THE CHUNNEL" 📉 BEARISH REVERSAL SETUP | Day/Swing Trade
📊 CURRENT MARKET DATA (Dec 10, 2025)
Live Price: 0.8737
Bias: BEARISH ⬇️
Setup Confirmed: Hull MA Pullback + TMA Breakout ✅
🎯 THE SETUP
📍 ENTRY STRATEGY: "THIEF LAYERING METHOD"
Multiple sell limit orders (layer your entries for optimal positioning):
Layer 1: 0.87600
Layer 2: 0.87500
Layer 3: 0.87400
💡 Thief OG's: Adjust layers based on your risk appetite & account size
🛑 STOP LOSS
Thief SL: 0.87700
⚠️ RISK DISCLAIMER: Dear Ladies & Gentlemen (Thief OG's), this is MY stop loss level based on MY strategy. You MUST adjust your SL according to YOUR OWN risk tolerance and trading plan. Not financial advice.
🎯 TAKE PROFIT TARGET
Primary Target: 0.86950
Technical Confluence:
✅ SuperTrend ATR acting as strong support zone
✅ Oversold conditions building
✅ Trap zone + correlation confirmation
✅ Hull MA trend reversal confirmed
💰 PROFIT MANAGEMENT: Dear Ladies & Gentlemen (Thief OG's), I do NOT recommend blindly following my TP. Scale out, trail stops, and take profits at YOUR discretion. Your money = your rules. Trade at your own risk.
🔗 RELATED PAIRS TO WATCH (Correlation Analysis)
💵 GBP PAIRS (Inverse Correlation)
FX:GBPUSD - Currently: 1.3314 ✅ Watch for GBP weakness confirmation
OANDA:GBPJPY - Currently: 208.53 ✅ Risk sentiment indicator
OANDA:GBPCHF - Negative correlation with EUR/GBP
💶 EUR PAIRS (Direct Correlation)
FX:EURUSD - Currently: 1.1637 ✅ Euro strength barometer
OANDA:EURCHF - Currently: 0.9352 ✅ Safe-haven flow indicator
OANDA:EURJPY - Currently: 182.20 ✅ Risk-on/risk-off confirmation
🔑 KEY CORRELATION INSIGHTS:
If GBP/USD strengthens → EUR/GBP likely drops ✅ (Supports our bearish bias)
If EUR/USD weakens → EUR/GBP likely drops ✅ (Double confirmation)
EUR/CHF movement → Shows Euro capital flows
GBP/JPY above 208 → Risk-on environment (monitor closely)
Watch for: GBP strength OR Euro weakness = EUR/GBP downside acceleration 🚀
📈 TECHNICAL ANALYSIS
Confirmed Signals:
🔵 Hull Moving Average pullback reversal pattern
🔺 Triangular Moving Average breakout (bearish)
📉 Price structure showing rejection at resistance
⚡ SuperTrend ATR support zone below @ 0.86950
Trade Logic:
Price has confirmed bearish reversal with strong technical confluence. Multiple moving average systems aligned for downside momentum. Layered entries allow for optimal risk-reward with reduced exposure at each level.
⚠️ FULL RISK DISCLOSURE
THIEF OG'S - READ THIS:
❌ This is NOT financial advice
❌ I am NOT recommending you copy my SL/TP levels
✅ YOU must manage your own risk
✅ YOU decide when to enter/exit
✅ YOUR capital = YOUR responsibility
✅ Trade what YOU can afford to lose
Risk Management:
Position size according to your account, never risk more than 1-2% per trade, and always have a plan before entering.
🎓 EDUCATION NOTE
The "Thief Layering Strategy" uses multiple limit orders to average into positions with improved entries. This reduces timing risk and provides flexibility for volatile market conditions.
Benefits:
✅ Better average entry price
✅ Reduced emotional decision-making
✅ Risk distributed across levels
✅ Adapts to volatility
📢 Drop a 🚀 if you're watching THE CHUNNEL with me!
📢 Comment your thoughts below - What's your EUR/GBP bias?
💬 Follow for more setups | 👍 Boost if this helps your analysis

BTC UpdateAnother failed Fed interest cut pump, MFI is overbought.
I decided to trade stock call options instead of BTC (IBIT), so no position. Looks bearish for tomorrow though.
Daily MFI is also overbought.

SHIB fighting EMAHey guys, SHIB is setting up for a potential breakdown on the 1H timeframe, and the risk-reward is looking pretty clean for short positions right now.
Price is trading at $0.00000853, sandwiched between EMA20/50 resistance at $0.00000857-858 and the make-or-break EMA200 support at $0.00000852. The ADX reading of 56.0 confirms we're in a strong trending environment, and that trend is decidedly bearish. RSI at 30.8 is approaching oversold, but without bullish divergence and with volume running 77% below average, there's no conviction for a reversal yet.
The setup: short entries around $0.00000855 with a tight stop above $0.00000865 (invalidation if we reclaim the EMA cluster). First target sits at the Bollinger Band lower support at $0.00000844, with an extended target at $0.00000838 if the EMA200 breaks. That gives us roughly 1:2.5 risk-reward on the conservative target and 1:4+ if we get the full move. The MACD remains bearish, MFI shows weak money flow at 36.5, and the internal market state is reading choppy with only 17% directional confidence, but the sell signals are stacking up.
Key risk: if price reclaims $0.00000859 (BB middle band) with volume, this whole setup gets invalidated and we could see a squeeze back toward $0.00000874. But until that happens, the path of least resistance is down, especially with such weak participation on bounces.
How are you playing this move? Waiting for the EMA200 break or already positioned short?

Gold (XAU/USD) — pre-FOMC technical + fundamental setupOn the 15-min chart we see repeated rejections off the same resistance zone horizontal supply + a down sloping trendline. Each attempt has failed so far. That suggests bearish bias in the short-term.
The current structure supports a potential drop toward ~ 4160 (support zone), assuming gold remains under the resistance trendline.
~ Key wildcard: tonight’s FOMC decision. Markets are pricing in a 25 bps rate cut with high probability. If the Fed cuts and delivers dovish guidance, gold could rally possibly invalidating the bearish setup.
✅ But if the Fed cuts while signalling a cautious stance or a pause in easing, the dollar/yields could bounce reinforcing gold’s bearish technical structure and likely triggering the projected move down toward ~ 4160.
PLAN A (base case): Stay short under resistance, target ~ 4160.
PLAN B (if FOMC surprises dovish): Watch for break above trendline on breakout, avoid new shorts; consider potential longs if follow-through appears (momentum + candle confirmation).
Fundamental lens: Gold is inherently sensitive to real interest rates and Fed policy. Dovish Fed = bullish for non-yielding safe-havens like gold; hawkish/dovishmpause tone = bearish or consolidative. Given mixed US data and sticky risk sentiment, the post-FOMC reaction could be swift and volatile.
consider waiting for the post-announcement move rather than pre-loading a large position. Use tight risk control (stop-loss above resistance if short; if buying after a break, wait for retest + confirmation).
