Possible Uptrend Continuation after brief consolidation.That looks like a potential **Bullish Flag/Channel** pattern forming on the EUR/USD 1-hour chart, suggesting a possible continuation of the preceding uptrend after a brief consolidation.
## 📈 Technical Analysis Overview
The chart shows the price consolidating within an upward-sloping channel (the two blue dashed lines) following a strong move up (the **flagpole**). This pattern is typically considered a **continuation pattern**.
* **Pattern:** Bullish Flag (or Ascending Channel/Channel Up).
* **Current Price:** Approximately **1.1566**.
* **Key Support (Bottom of the Channel/Proposed Entry Zone):** The red horizontal line at **1.15638** to **1.15466** (the shaded red box is the Stop-Loss zone). The lower blue dashed line represents dynamic support.
---
## 🎯 Proposed Trade Setup
The trade setup drawn on the chart anticipates a bounce off the lower boundary of the channel and a subsequent breakout to the upside.
### **1. Entry**
* **Potential Buy Zone:** Near the lower blue dashed line and the horizontal support level at approximately **1.15600 - 1.15700** (where the price is currently hovering). The red horizontal line is marked at **1.15638**.
### **2. Stop-Loss (Risk Management)**
* **Stop-Loss (SL) Level:** The red shaded area indicates the Stop-Loss should be placed below the recent swing low and the channel's support. The chart marks the bottom of this zone at **1.15308**. This is the point where the bullish structure is considered invalidated.
### **3. Take-Profit (Target)**
* **Take-Profit (TP) Level:** The target is set in the purple shaded box, which corresponds to the highs of the previous move (the start of the consolidation).
* **TP Zone:** **1.16636** to **1.16800**.
* *Note: A common target for a Flag pattern is to project the length of the flagpole from the point of breakout.*
---
## **🔮 Projected Price Action (The Cyan Path)**
The projected path indicates:
1. A short dip or consolidation to test the channel's lower support (the red zone/lower blue dashed line).
2. A strong **reversal/bounce** from this support.
3. A move up to break out of the top of the channel (the upper blue dashed line).
4. A continuation of the rally toward the main resistance/target zone (the purple box).
The pattern suggests a high-probability trade if the support holds and the upward momentum returns.
Would you like me to find some recent **fundamental news** for the EUR/USD pair that could influence this technical setup?
X-indicator

CLEAR GOLD SELL SETUPEntry: $4,227.63
Stop Loss: $4,245.58
Take Profit: $4,109.70
📉 Reasoning
Price reacted strongly at the intraday resistance zone around $4,244–$4,246, rejecting liquidity and forming a potential lower high. The risk-to-reward ratio of 1:7.4 shows high payoff potential if the move continues toward the demand area below $4,120.
📊 Risk Management
A tight SL above the liquidity sweep protects the setup. Position size controlled — only 14 lots, keeping exposure in line with account rules.
🎯 Objective
Targeting a deeper correction toward the next major demand zone with clear bearish continuation structure.

BUY EURUSD
1. **Break of Structure (BOS):**
Price made a higher high and then pulled back, showing bullish structure before continuing upward.
2. **Bullish Momentum / Trend Continuation:**
The market shows a sequence of higher highs and higher lows, suggesting an up-trend continuation.
3. **Retest of Previous Resistance as Support:**
Price pulled back to a previous supply/decision area and reacted, indicating support holding.
4. **Strong Bullish Candles Before Entry:**
Impulsive bullish candles show strong buyer interest and momentum.
5. **Liquidity Sweep (Stop Hunt) Before Entry:**
A wick below previous lows could indicate liquidity taken, followed by order-flow shift to the upside

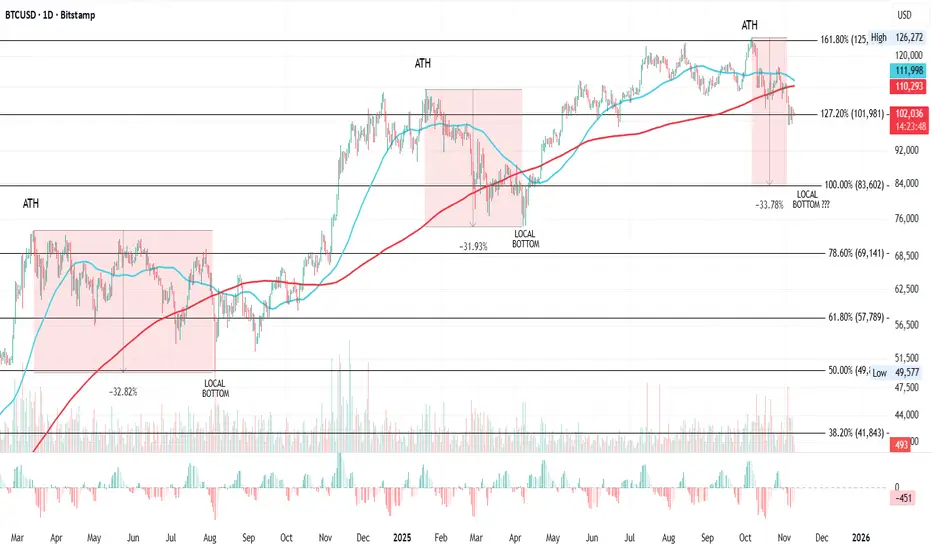
BTCUSD Daily: Watching for Post-ATH Correction Pattern to UnfoldPotential Local Bottom Ahead?
Overall Outlook: I'm tracking a recurring pattern in Bitcoin's price action following each all-time high (ATH), involving sharp drops, interactions with the 50-day and 200-day moving averages (MAs), and key Fibonacci levels. This has played out twice before in this cycle, and we're now in the midst of what could be the third iteration. The setup suggests a potential further drop of around 33.78% from the latest ATH, targeting the 100% Fib level for a local bottom, possibly timed near a death cross. If this holds true, it could signal a strong buying opportunity at the bottom, as price has historically reversed and rallied hard afterward. For now, the theory looks promising, but I'll update this idea as events unfold.
Key Pattern and Historical Observations: This analysis focuses on a consistent post-ATH correction structure that's emerged in Bitcoin's daily chart over the past couple of years. It typically involves: A new ATH breaking above a key Fib extension level.
A subsequent drop of 31-33%, crossing under the 50MA and 200MA.
Bottoming near a lower Fib level (often 2 levels below the ATH breakout point), with timing influenced by the death cross (50MA crossing under 200MA).
Post-bottom recovery: Choppy ups and downs, reclaiming MAs and Fib levels, leading to the next leg up.
Let's break it down by each ATH in the series: First ATH (March 2024): Peaked at $73,794, right above the 78.60% Fib level. This was followed by a 32.82% drop to a local bottom at $49,577. Price action dropped 2 Fib levels to land at the 50% Fib, after crossing under both the 50MA and 200MA. Notably, the local bottom formed just days before the death cross occurred, suggesting the cross could help time reversals. From there, recovery wasn't immediate, price pushed up, hit resistance at the 200MA, dropped, rallied again, and repeated this process. Eventually, it found support at the 50MA and pushed over the 200MA. This consolidation phase lasted from March to August 2024 before the uptrend resumed.
Second ATH (January 2025): Hit $109,356, breaking above the 127.20% Fib level. Similar to the first, it dropped 31.93% to a local bottom at $74,434 and again, 2 Fib levels lower, landing close to the 78.60% Fib (which was key in the prior ATH). This time, the bottom came shortly after the death cross, flipping the timing slightly from the previous instance (after vs. before). Post-bottom, price reclaimed the next Fib level and the 50MA, then crossed the 200MA and held strong without looking back, all the way until October 2025.
Third ATH (Early October 2025): Reached $126,272, just above the 161.80% Fib level. Following the pattern, but accelerating faster this time, price has already dropped under the 200MA and found at least temporary support at the 127.20% Fib level.
Current Setup and Open Questions: Based on the prior two ATHs, this third one raises two key questions that could define the next move: Will price drop to the next lower Fib level? That would mean targeting the 100% Fib, implying a total drop of around 33.78% from the $126,272 ATH (putting the local bottom somewhere near $83,600, give or take based on exact Fib anchoring).
Will a death cross mark the bottom? In the first case, the bottom was days before the cross; in the second, shortly after. Watching for an impending death cross could help time the reversal in real time.
If the pattern repeats, we're likely in the early stages of the correction, with more downside before the bottom forms. This setup has a good chance to play out given the historical parallels, offering a prime spot to buy the dip once the local bottom confirms. I'll keep this idea updated as price action develops, especially monitoring Fib interactions, MA crosses, and any signs of reversal. Potential Trade Considerations: Watch Zones: Resistance: 161.80% Fib ($126,272, prior ATH) and 200MA for any failed retests.
Support Targets: 127.20% Fib (current temp support), then 100% Fib for the potential local bottom (~33.78% drop zone).
Entry Idea: No aggressive positions yet, wait for signs of bottoming near the 100% Fib or around a death cross. If confirmed, long entry on reversal signals (e.g., bullish candle above 50MA).
Risk Management: Set stops below key Fib supports. Target post-recovery upside to prior ATH or higher Fib extensions.
Invalidation: A quick reclaim of the 200MA without further drop could break the pattern, shifting to bullish continuation.
External Factors:
While the technicals are strong, BTC in late 2025 is heavily influenced by US macros, which could amplify or disrupt this post-ATH drop pattern.
For instance: Ongoing Government Shutdown: The US federal government has been shut down since October 1, 2025, making this the longest shutdown in history (now at 39+ days as of Nov 9). It's causing widespread disruptions, including halted SNAP benefits for millions, delays in airport operations due to air traffic controller shortages, increased reliance on food pantries by military families, and broader economic strain like reduced tourism and spending ahead of Thanksgiving. Negotiations are stalled, with Senate Republicans pushing for votes to reopen but Democrats holding out for extensions on ACA tax credits. This uncertainty could weigh on risk assets like BTC, potentially accelerating the expected 33.78% drop if it drags on and hurts consumer confidence or triggers a recessionary vibe. On the flip side, a quick resolution might spark a relief rally, shortening the correction phase.
Fed's Stance on Rate Cuts: There's no FOMC meeting in November, so no rate cut then. For December, Fed Chair Powell emphasized after the October 29 quarter-point cut (bringing the fed funds rate to 3.75%-4%) that another reduction is "not a foregone conclusion" and depends on incoming data. Internal divisions are evident: some officials like Beth Hammack and Lorie Logan question further easing, citing a resilient economy and risks of reigniting inflation.
The shutdown is complicating this by blocking key data releases (e.g., jobs reports), which Powell likened to "driving in the fog." If no cut happens in December, it could pressure BTC lower in the short term by signalling tighter policy, aligning with a deeper Fib target. But if data softens dramatically (e.g., due to shutdown effects), a surprise cut might catalyze the bottom and reversal.
Ending QT and Potential QE Shift: The Fed announced it will end quantitative tightening (QT) on December 1, halting the balance sheet runoff and instead rolling over maturing Treasuries to hold holdings steady at around $6.6 trillion. This addresses tightening money markets and funding strains, but it's not yet quantitative easing (QE), it's more of a pause to maintain ample reserves rather than active expansion. Some analysts speculate this could pave the way for QE resumption if economic conditions worsen (e.g., prolonged shutdown or labour market cooling), potentially starting in December or early 2026. For BTC, ending QT removes a liquidity drain, which is bullish long-term and could support post-bottom rally. If QE kicks in sooner, it might act as rocket fuel, shortening the correction and pushing toward new ATHs faster, but watch for inflation risks that could prompt hawkish pushback.
If you like this idea, feel free to leave a comment, boost, or share your thoughts.
Remember, this is not financial advice; trade responsibly!
Always take profits and manage risk!
Interaction is welcome in the comments!
BTC/USD 2H – Key Support Levels Holding Strong BTC/USD 2H Analysis
Bitcoin is currently trading inside a clean range structure between a strong resistance zone above and two major support zones below. Price is reacting exactly within these boundaries, showing clear market behavior.
---
🔍 Key Technical Observations
📌 Resistance Zone
Price has rejected this level multiple times, confirming strong selling pressure above.
📌 Support 1
This is the first zone where buyers previously stepped in with strong momentum.
📌 Support 2
A deeper support level where liquidity sits and where strong bullish reactions occurred in the past.
---
📈 Expected BTC Move
Based on structure:
✔ If BTC holds above Support 1, we can expect a bounce toward resistance.
✔ If price breaks Support 1, a move toward Support 2 is likely before any bullish reaction.
✔ Range trading environment — wait for clean reaction signals.
The green arrows on the chart illustrate the potential bounce zones.
---
🙏 Support the Work
Your boosts, likes, and comments motivate me to continue providing clean and accurate chart breakdowns.
👉 Boost the idea & share your thoughts below!
— JT_CHARTsMaster

BTCUSD- SELL strategy weekly chart GANN SQIt feels heavy to the downside, and indicators (especially the monthly chart) have turned negative. Even though there are plenty of arguments for higher levels over time, one cannot deny we have reached very oversaturated levels. The potential to test $ 55k is there medium-term.
Strategy SELL @ $ 85k - 95k and take profit near $ 60k for now.

Make sure to manage your capital properly.A good price zone is more important than trying to pick the perfect price. Buying at a reasonable level matters more than catching exact tops or bottoms. Be a smart investor.
MSTR has bottomed out It appears the MSTR has bottomed out and it looks like the big boys have scared all the weak hands. As they are gobbling up positions in bitcoin and MSTR.

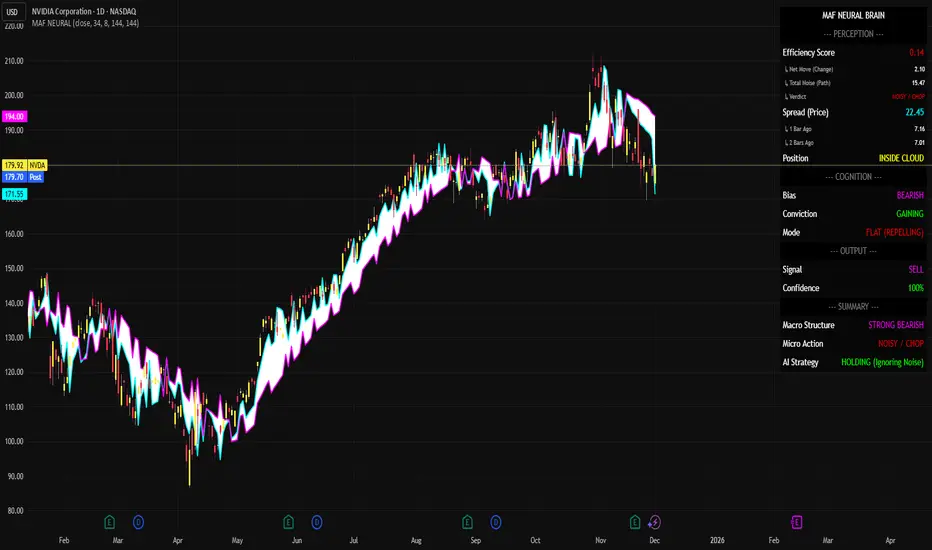
Trade Summary: Bearish Continuation with High ConfidenceYou are looking at the Daily chart for NVDA (NVIDIA Corporation). The broader trend is clearly bearish, and the MAF Neural Brain indicator has identified a high-probability continuation setup.
1. Perception (The Eyes): What the Indicator Sees
Efficiency Score: 0.14. This is very low, indicating "Noisy/Chop" price action. The daily candles are overlapping significantly, showing a struggle between buyers and sellers rather than a smooth trend.
Spread (Price): 22.45. Volatility is present but contained within the bearish structure.
Position: INSIDE CLOUD. Price is trading within the indicator's bands, confirming that this is a consolidation phase within the larger downtrend.
Trade Summary: Bearish Continuation with High Confidence
2. Cognition (The Mind): How the Indicator Interprets It
Bias: BEARISH. Despite the choppy daily action, the system maintains a negative bias.
Conviction: GAINING. This is the key insight. While the market looks messy to the naked eye, the algorithm's internal confidence in the downtrend is actually increasing. It sees the current chop as a pause before another drop, not a reversal.
Mode: FLAT (REPELLING). The market is stuck in a range that is resisting upward breakouts.
3. Narrative (The Story): The Strategic Output
Signal: SELL. A hard sell signal is active.
Confidence: 100%. The system is fully aligned. Every metric (Bias, Conviction, Structure) points to lower prices.
4. Summary (The Execution)
Macro Structure: STRONG BEARISH. The dominant force is selling.
Micro Action: NOISY / CHOP. The daily candles are messy.
AI Strategy: HOLDING (Ignoring Noise).
Trade Analysis: This setup represents a "Bear Flag" or Consolidation in a Downtrend.
The Opportunity: Traders often get shaken out during "Noisy" consolidations like this because they mistake the sideways movement for a bottom. The Neural Brain is explicitly telling you to ignore that noise.
The Action: If you are short, HOLD. If you are flat, this is a valid entry for a Short position, anticipating a breakdown from the current "Inside Cloud" consolidation.
The Verdict: The 100% confidence level combined with "Gaining Conviction" suggests the path of least resistance remains strictly downward.
In plain English: "NVDA is taking a breather after dropping, and the price action is messy. However, the internal data says sellers are still in total control and getting stronger. Don't buy the dip; expect the drop to continue."
#BTC Continues Deepening Correction?📊#BTC Continues Deepening Correction?
🧠From a structural perspective, we are still in a daily-level correction phase, with a short-term downtrend. Therefore, until a bullish structure is established within the same timeframe, we need to be wary of further pullbacks. We can only maintain an optimistic outlook after reversing the blue resistance zone.
➡️Therefore, short-term support is around 85358. If we continue to break below the low L, then we need to pay attention to the next support zone at 69000-74500.
Let's see 👀
🤜If you like my analysis, please like 💖 and share 💬
BITGET:BTCUSDT.P


USDCHFUSDCHF
- Bearish Channel as an corrective pattern in Short Time Frame
- Break of Structure
- RSI - Divergence
- Order Block
- Completed " 12345 " Impulsive Waves and " A " Corrective Wave

Price-Action Analysis (Gold – Daily Chart)Price-Action Analysis (Gold – Daily Chart)
1. Rising Wedge Structure
The chart highlights a rising wedge, where price is moving higher but the slope of the highs and lows is converging.
This shows that although price is advancing, the momentum is slowing because each new high is made with decreasing strength.
The wedge boundaries show price repeatedly touching both the upper and lower trendlines.
2. Recent Price Behavior
Price moved from the lower wedge boundary upward and recently touched the resistance area near the upper boundary.
After this touch, the latest candle shows a pullback, indicating a pause in upward momentum.
This is consistent with price meeting the top of a tightening structure.
3. Interaction With EMAs
Price has been trading above the EMA 7, EMA 9, and EMA 21, reflecting short-term upward pressure.
The EMA 50 lies further below and has acted as a secondary dynamic support in earlier phases of the chart.
The clustering of EMAs under price indicates a generally constructive short-term trend.
4. Possible Breakdown Area (Structure-Based)
The dotted vertical measurement displayed on the chart illustrates the height of the wedge.
This height is often used to project a distance, not as a signal, but simply to visualize how the pattern size compares with nearby price areas.
The green “Target” box reflects this projected measurement placed below the wedge’s lower boundary, representing a hypothetical zone based solely on the wedge’s size.
5. Volume Context
Volume appears higher during strong downward candles earlier in the chart, then stabilizes during the wedge.
This fits a common observation where momentum can slow as patterns tighten.
📌 Summary (Neutral & Descriptive)
Gold has been moving inside a rising wedge, showing higher highs and higher lows within a narrowing structure. Recently, price touched the upper boundary of the wedge and showed a mild pullback, indicating reduced momentum at that level. Price remains above several EMAs, reflecting ongoing short-term strength, while the pattern itself shows compression. A measured-move projection is drawn underneath the wedge to illustrate how its height compares with lower price zones if the structure were to resolve downward.

FDAX UpdateThe Euros sent futures red this morning, waiting to see if the support holds or breaks again.
I hate going long then watching a gap down in the morning.

FR40 SHORT THIS BITCH under this level seller are stong ; and they xwill push the price down , the fundamentals are all gathered and france is really having a bad moment over this Q4

HEIUSDT 1D#HEI is on the verge of breaking out above the descending resistance and the SMA50 on the daily chart. In case of a breakout, the potential targets are:
🎯 $0.2868
🎯 $0.3216
🎯 $0.3564
🎯 $0.4059
🎯 $0.4690
⚠️ Always remember to use a tight stop-loss and maintain proper risk management.

XAUUSD analysis for next All Time High ,possible. 4-hour candlestick chart** for **CFDs on Gold (XAU/USD)**, showing a technical analysis setup.
Based on the chart's markings, the analysis suggests a **bullish continuation** trade setup following a **breakout**.
Here's a breakdown of the key elements and the implied trade strategy:
### 📈 Technical Analysis Overview
* **Pattern:** The price action appears to have formed a large **symmetrical triangle** (or possibly a **rising wedge** leading into the final breakout) marked by the two light blue trendlines.
* **Breakout:** A **"BREAKOUT"** is explicitly marked where the price moved decisively above the upper trendline of the pattern.
* **Continuation Pattern:** After the initial breakout, the price formed a smaller, **bullish flag or pennant** (often called a **continuation pattern**) which is the small triangle/wedge-like pattern that the price recently broke out of again, or is currently testing. This pattern is usually a consolidation phase before the main uptrend resumes.
* **Target Zone:** The pink/purple horizontal box at the top, around **4,388 - 4,400**, represents the **target price zone** for the trade. This target often corresponds to the height of the preceding pattern (the larger triangle) or a significant previous high (which it is, as it matches the high from late October).
### 🟢 Implied Trade Setup
The green and red boxes indicate the proposed **Long (Buy)** trade:
| Element | Price Level (Approx.) | Significance |
| **Entry Zone** | $4,203.050 - $4,230.000 | The zone where the price is currently sitting, suggesting an entry upon confirmation of the continuation pattern breakout or a retest of the larger breakout level. |
| **Stop-Loss (SL)** | $4,130.851 | The **maximum risk** point, placed below the recent swing low and/or the lower trendline of the continuation pattern to protect the capital if the setup fails. |
| **Take-Profit (TP)** | $4,388.547 | The **target profit** level, aligning with the previous high and the pink/purple target zone. |
In summary, the chart depicts a strategy to **buy Gold** based on a **bullish breakout** from a long-term triangle pattern and a subsequent **bullish continuation pattern** (flag/pennant), aiming for the previous all-time high as the profit target.
Would you like a more detailed explanation of the **symmetrical triangle pattern** or the concept of a **continuation pattern** in technical analysis?

Tired of Entering Too Late? Here’s the Setup You Shouldn’t Miss1️⃣ Key Resistance Zone Rejected
Price tapped into the resistance area around 1.1638 – 1.1652, which previously acted as a strong supply zone.
The sharp wick rejection signals that buyers were unable to maintain momentum.
This is a high-probability reversal behavior.
2️⃣ Market Structure: Rounded Top + Liquidity Grab
The rounded top formation indicates slowing bullish momentum.
The long upper wick suggests a liquidity sweep before the expected bearish leg.
This aligns with institutional behavior:
➡️ sweep liquidity → fill orders → drop.
3️⃣ Short Entry Confirmation
The chart clearly marks the ideal ENTRY SHORT as the candle rejects resistance.
Entry Zone: 1.1635 – 1.1650 (depending on spread)
Stop Loss: Above 1.1652
Take Profit: Targeting the weak support zone and then deeper into the strong support below.
4️⃣ Expected Price Path
Based on structure + support layers:
- First drop toward 1.1570 – 1.1560
- Beak of this level → continuation to the 1.1551 zone
- If momentum is strong, eventual return to the major support block
This aligns with the clean pullback–drop model typical in a trending market.
📌 Summary
This is a textbook short setup:
- Clear resistance rejection
- Liquidity sweep
- Bearish structure forming
- Targets lining up with both weak and strong support levels
High-probability trade for sellers.

Xauusd.Chart Pattern...✅ TARGET Visible on my XAUUSD Chart
I have one main target marked with a blue upward arrow:
📍 Target Point: ~ 4,240 – 4,245 USD
This is the horizontal zone I highlighted above the current price, likely projected from the previous range height.
📈 What the Chart Structure Suggests (Based on What my Drew)
Price is riding an ascending trendline.
It’s above the Ichimoku cloud, which I'm using as bullish confirmation.
Breakout from a consolidation box appears to be measured and projected upward → giving the ~4,240 target.

EUR/USD 30M: Targeting a Mini Zone for a Bullish Continuation🚀 EUR/USD 1H/30M: Targeting a Volume Burst Zone for a Bullish Continuation
🎯 Key Analysis: Seeking Long Entry from Demand
This analysis focuses on the EUR/USD pair on the 1-hour chart (labeled as 1H in the corner, but the title references 30 Mints Analysis—suggesting the core idea is for intraday trading based on a higher timeframe structure). The core strategy is to identify a high-probability Demand Zone after a major market event (the prior spike) and anticipate a bullish continuation.
📉 Prior Price Action and Market Context
The chart shows a significant price movement just before the analysis period:
Strong Upward Move: Price saw a sharp, aggressive rally, creating a new swing high.
Order Flow Reversal (OFR): Following the rally, the price experienced an equally sharp, deep pullback. The level labeled "OFR" (likely standing for Order Flow Reversal or the initiation point of the pullback) marks the immediate distribution that occurred after the high was printed.
Current Status: Price has stabilized following the sharp drop and is now consolidating just above the identified entry zone.
💡 The Bullish Setup: Mini Reversal Zone (Demand)
The trade hypothesis is based on price pulling back into a high-quality demand zone before moving higher.
1. Volume Burst / Mini Reversal Zone (Demand Entry) 🟢
Zone Location: The primary interest zone is the green shaded box, spanning approximately 1.15900 to 1.16050.
Significance: This area is the "Mini Reversal Zone" which coincides with a "Volume Burst" zone. This suggests it's the origin of the aggressive buying that launched the previous rally (the base of the strong move).
Action Plan: This zone is anticipated to be a high-probability area for buyers to step in again, absorbing the selling pressure from the current pullback.
Target Entry: Entry is suggested near the upper boundary of this zone, specifically around 1.16000 (a psychological level) or slightly below, maximizing the risk/reward ratio.
2. The "Need Pattern" 📈
The chart indicates a "Need Pattern" arrow pointing into the entry zone. This suggests the analyst expects a specific candlestick pattern (e.g., an engulfing candle, pin bar, or double bottom) or a clear shift in lower timeframe momentum within this zone to confirm the long entry.
📈 Proposed Trade Plan & Target
Direction: Long (Buy)
Entry: Wait for price to enter the Mini Reversal Zone (~1.16000 - 1.16050) and confirm with a bullish pattern ("Need Pattern").
Stop Loss (S/L): Place the Stop Loss safely below the Volume Burst zone (e.g., below 1.15850) to protect against continuation of the bearish move.
Take Profit (T/P) : The initial target would be a retest of the prior high, or a move back to the OFR level (around 1.16250 - 1.16300) for a strong risk/reward. The long-term target is a break of the previous high, as shown by the upper arrow.
⚠️ Risk Disclaimer
This is a counter-trend move relative to the sharp pullback. Traders must wait for confirmation (the "Need Pattern") in the Mini Reversal Zone to manage risk effectively. Failure to hold the demand zone could signal a deeper move down.

XAU/USD Intraday Plan| Pullback in Play Below 4232Gold is pulling back below 4232 after failing to reclaim the 4274 resistance yesterday. Price is currently trading around 4212 and has also closed below the MA50, signalling a slowdown in bullish momentum.
Market structure has turned temporarily bearish, and for buyers to regain control we need a clean break above 4232 to reopen the path toward 4274, and if momentum is strong, 4322 next.
If selling pressure persists, price is likely to retest the First Reaction Zone(4185-4141), which aligns with the MA200 — adding confluence as dynamic support. A clean break below this area would open the door for a deeper pullback into the Support Level (4102-4049) and ultimately the HTF Support Zone(4014-3966), where buyers may look for a stronger bullish reaction.
📌Key levels to watch:
Resistance:
4232
4274
4322
Support:
4185
4141
4102
4049
4014
3966
🔎Fundamental Focus:
No high- or medium-impact data scheduled today, so price may move more on sentiment and headlines. Later in the week we have several important U.S. releases that could drive volatility. Geopolitical developments also remain a factor to watch.

BTCUSDT.P AnalysisBTCUSDT.P consolidates at 86,307 after a 5% December pullback from 113K highs, holding key demand zone 85K–87K with low volume.
Technical Indicators
RSI (32–40) and Stochastic signal oversold conditions across timeframes, while MACD shows bearish divergence weakening.
ADX above 50 confirms downtrend strength, but higher lows near 85K suggest potential reversal structure.
Key Levels
Support: 85,000 (swing low), 83,000 (next demand).
Resistance: 86,500 (breakout test), 89,500–93,500 (supply).

USD/JPY Analysis : Potential Reversal & Supply From Target Zone 📈 USD/JPY 1H: Potential Reversal and Supply Retracement Play
🔑 Key Context: Bearish Trend with Demand Zone Reaction
The chart initially shows a strong downward trend or significant pullback, characterized by lower swing highs and lower swing lows on the 1-hour chart. This bearish movement breached a prior low established around November 27th.
Prior Structure: Price fell sharply, breaking below a level that was part of a previous consolidation or minor distribution phase (the area marked 'D-R Supply' boundary).
Current Action: The price has recently made a strong low and is now showing signs of an aggressive move back up (a recovery rally).
🎯 Identifying Key Zones
The analysis highlights three critical zones based on supply/demand and technical structure:
1. Reversal Zone (Demand) 🟢
This is the lowest green box, around 154.650 - 154.800.
Significance: This zone acted as a strong Demand area, causing the significant bullish reversal/bounce we are currently seeing. It's the point where buyers stepped in aggressively, stopping the immediate bearish momentum. The low of the move touched the upper boundary of this zone before the strong rally began.
2. D-R Supply (Drop-Base-Drop/Rally-Base-Drop Supply) 🔴
This is the overall consolidation area that was previously broken, roughly between 155.600 and 156.400.
Significance: This large area represents where a significant amount of selling pressure entered the market, leading to the large drop. The current move upward is likely a retracement back into this supply structure.
3. Target and Volume Burst Zone 🔵 & 🟢
Target (Blue Box): This level, around 156.350 - 156.450, appears to be the immediate objective for the current bullish move. It lines up with the bottom of the old consolidation area (the D-R Supply).
Volume Burst (Top Green Box): This zone, from approximately 156.450 to 156.650, represents the upper part of the broken supply zone. This is a potential high-probability area where the initial sellers are likely to defend their positions, leading to a strong reaction (a "Volume Burst" of selling/distribution).
💡 Trading Hypothesis: Retracement to Supply
The current price action suggests the following trade setup:
Scenario : The bounce from the Reversal Zone (Demand) is expected to continue as a retracement to test the broken D-R Supply zone above.
Entry: Traders who entered at the Demand Reversal Zone would be looking to hold the position. New entries might look for continuation patterns to join the current rally.
Take Profit: The Target (blue box) and the lower part of the Volume Burst zone are key areas for taking profit on long positions, as price is expected to encounter significant resistance there.
Continuation/New Trade: Once the price reaches the Volume Burst area, a new short trade setup could be considered, anticipating a rejection and resumption of the overall bearish bias or a continuation of the downtrend from that high-resistance level.
⚠️ Caveats and Confirmation
The current rally needs to maintain momentum and successfully break above the CZ (Confirmation Zone) level marked around 156.000 to confirm the target is achievable.
Failure to sustain the rally above the 156.000 area could indicate a shallower retracement or a potential double-bottom/range setup.
Risk Management: Any long trade should place a stop-loss below the Reversal Zone low.
