BTC/USD BULLISH LONG TARGET 112.000 . WHO AGREED ?Price recently broke out of a strong upward channel, showing exhaustion after an extended bullish run. Once the channel failed, BTC dropped sharply and is now trading below the Ichimoku cloud, confirming a shift toward bearish correction.
The chart highlights a major demand zone where price is currently reacting. If this support breaks, the market may continue sliding toward the marked Target Point, which aligns with previous consolidation and a high-volume area.
As long as price stays below the cloud and fails to reclaim the old channel, the bias remains toward a deeper corrective move
X-indicator

USD/CAD Looking bullish from key support levels📈 USDCAD Bullish Setup Alert! 🇺🇸🇨🇦
Price is showing strong bullish momentum after reacting from the key support zone at 1.38000.
🎯 Technical Targets (15M Timeframe):
1️⃣ 1.38200
2️⃣ 1.38400
3️⃣ 1.38600
⚠️ Risk Management First!
Always use proper stop-loss & position sizing. Protect your capital. 🛡️
💬 Like | Follow | Comment | Share
Your support keeps the analysis coming! 🙌

XAUUSD Intraday Plan | Powell Spike Fades, 4219 Back in FocusWe saw a solid push into the 4,251 resistance yesterday following Powell’s speech, but the move was short-lived. Price retraced all gains during the Asian session and is now trading around 4,215 — once again sitting below the 4,219 resistance.
The overall outlook remains unchanged:
Buyers must reclaim the 4,219 resistance to target 4,251, with 4,285 becoming achievable if momentum strengthens.
If selling pressure builds, we could see the 4,185 Reaction Zone tested again. A break below 4,185 would expose the Support Zone, where buyers may look to react.
📌Key levels to watch:
Resistance:
4219
4251
4285
Support:
4185
4144
4102

XAUUSD in Uptrend, Awaiting Technical PullbackHi everyone, Domic here. Let’s take a closer look at gold today!
Overall, both news and technicals favor buyers. Gold has surged to around $4,270/oz, up $32 from yesterday, reaching its highest level in over a month. The Fed’s 0.25% rate cut, lowering the benchmark to 3.5–3.75%, has clearly weakened the USD — a positive catalyst for gold. Meanwhile, silver also hit a new high around $64.22/oz. According to Edward Meir, silver’s strong momentum is lifting gold and other precious metals, signaling a return of capital to safe-haven assets.
Looking ahead, the market eyes the Nonfarm Payrolls report on December 16 for clues on the next rate moves. Discussions over the next Fed chair, with front-runner Kevin Hassett supporting rate cuts, further strengthen expectations of a prolonged low-rate environment, keeping gold in a favorable position among safe-haven assets.
On the H4 chart, XAUUSD’s uptrend is clear. Price sits above both EMAs, with the short EMA (red) near 4,221 and the long EMA (blue) near 4,188, confirming the medium–long-term uptrend. The recent breakout pushed gold to 4,270–4,280 with rising volume, indicating active buying rather than a random spike. However, the gap between price and the short EMA is wide, making a technical pullback likely.
Preferred scenario:
Gold may retrace to a nearby support zone before resuming its uptrend. The first support is around 4,240–4,250, where price previously consolidated before the breakout — a potential shallow pullback before bouncing higher.
If selling intensifies, the 4,220–4,225 zone near the red EMA offers a good retest point, aligning with the broken resistance. In a stronger pullback, the long EMA (blue) near 4,188 acts as the next safety net, preserving the medium-term uptrend.
→ As long as price stays above this zone on H4, any dips are just pullbacks within the uptrend.
Wishing you successful trades!

DASH Breakout: Reversal or Trap?
Yello Paradisers, is this the beginning of a massive DASH reversal or just another fakeout that will punish impatient bulls?
💎#DASHUSDT has just broken out of a well-defined Falling Wedge formation, a classic bottoming pattern that often signals the end of a correction and the start of a new bullish phase. The move comes after a strong bounce from the major demand zone around $45–46, a level that has consistently attracted buyers and proven itself as a high-liquidity reaction area.
💎The breakout above the descending trendline shows that sellers are losing control, but the structure still demands confirmation. What matters now is whether the market delivers a clean retest. Ideally, a pullback toward the broken trendline or a dip back into the upper portion of the $45–46 demand zone would serve as a strong confirmation and potential entry trigger for the next impulsive move.
💎If buyers step in with strength on the retest, #DASH could start grinding higher toward the first resistance around $49–50, and if momentum sustains, the price may even push toward the more significant resistance region near $55.
💎That said, this structure is still fragile. A failure to hold the demand zone, particularly if price breaks below $44, would invalidate the bullish scenario and put DASH back at risk of deeper downside.
It’s not about being early, it’s about being right. Stay sharp and don’t let emotions dictate your trades. That’s the only way you make it far in this game.
MyCryptoParadise
iFeel the success🌴

Bitcoin bulls are on the riseMacro Policy: Rate Cut & Liquidity Easing Solidify the Policy Floor
The Federal Reserve delivered a much - anticipated 25BP rate cut in December, lowering the federal funds rate to the range of 3.50%-3.75%. With a total rate cut of 75BP throughout 2025, this move perfectly matched market expectations. Together with the accompanying liquidity - injection measures and clear signals of a sustained easing cycle, it has firmly built a solid policy floor for the crypto market, creating strong favorable conditions for bullish positions in assets like Bitcoin. The key positive drivers supporting the bullish trend are as follows:
1.**$400 Billion Treasury Purchase Plan Underpins Risk Assets with Liquidity**The Fed simultaneously launched a short - term Treasury bond purchase program, set to buy $40 billion worth of short - term Treasury bonds starting December 12. Though the Fed defined this as a "reserve management purchase", it essentially injects substantial liquidity into the overnight funding market. This operation acts as a powerful financial backstop for risk assets such as Bitcoin. It lowers the cost of capital for market participants, encourages capital to flow into high - growth alternative investment areas, and effectively eases the year - end liquidity strain that the market often worries about.
2.Clear Continuity of the Easing Cycle Eliminates Policy Shift FearsThe latest dot plot released by the Fed indicates an expectation of one more 25BP rate cut in 2026, which clearly shows that the easing cycle will continue. During the press conference, Chairman Powell did mention the potential risk of rising inflation. However, he did not negate the overall easing tone and emphasized that monetary policy has no predetermined path. This statement dispels the market's concerns about an abrupt policy reversal. Even though there were 3 dissenting votes in this rate - cut decision (a first in six years), the median forecast of Fed officials for the interest rate path remains consistent with that in September, which enhances the market's confidence in the stability of the policy direction.
3.Weakening Dollar Unlocks Upside Room for Crypto AssetsThe dollar index and Bitcoin maintain a strong negative correlation of -0.58. Interest rate cuts usually erode the appeal of the US dollar as a haven asset. As the Fed's rate - cutting cycle advances, the dollar has shown a weakening trend. This is particularly beneficial for Bitcoin, which is priced in US dollars, as it makes the cryptocurrency more affordable for global investors and thus spurs increased buying interest.
4.Historical Data Boosts Confidence in Short - term Bitcoin UpsideHistorical market performance provides strong empirical support for the bullish outlook of Bitcoin. Looking back at past market cycles, when the Federal Reserve was in a rate - cutting cycle and coupled with quantitative easing - like liquidity - injection operations, the probability of Bitcoin rising in the short term exceeded 76%. A typical example is the period after 2020, when the Fed slashed interest rates to near - zero levels in response to the pandemic. This move triggered a massive bull run in Bitcoin, with its price surging from around $5,000 to an all - time high of $69,000 by the end of 2021. Currently, the combined effect of the Fed's rate cut and Treasury purchase program is highly consistent with the above - mentioned favorable macro environment, further strengthening the certainty of Bitcoin's short - term rebound trend.
Bitcoin trading strategy
buy:90000-91000
tp:92000-93000-95000
sl:89000

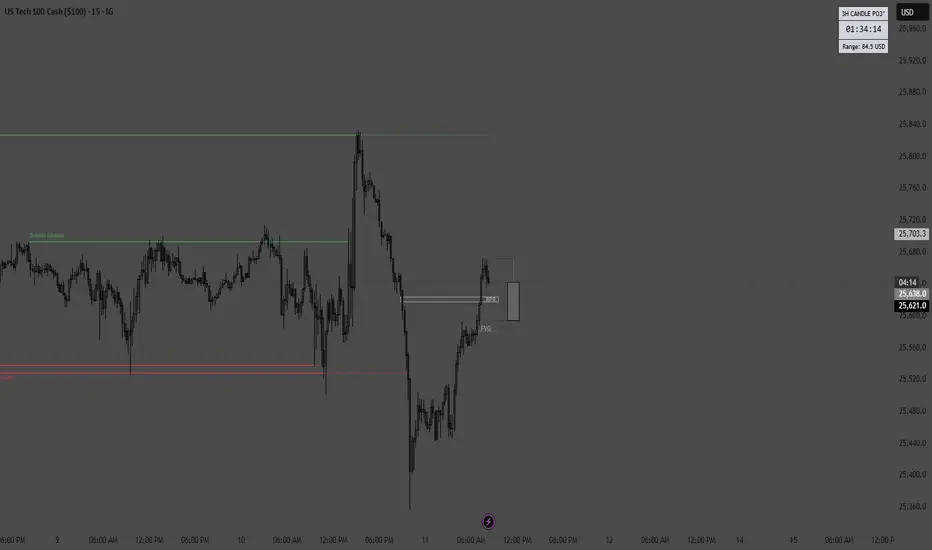
Order Block Rejection Toward Liquidity TargetsThis 4-hour USD/JPY chart shows a recent bearish shift after price rejected an identified Order Block and partially filled a Fair Value Gap (FVG) before continuing downward. The broader context includes a previously broken descending channel and a current retracement into a supply zone, suggesting bearish continuation. The chart highlights a clean inefficiency zone (FVG) serving as a potential mitigation point, from which sellers appear to be stepping in. Price is currently trading around 155.20, with projected downside continuation toward two marked liquidity levels.
Targets
1st Target: 154.058
2nd Target: 152.999

BTC/USD 1 Hour long idea setupBitcoin consolidation with new hype create institution are likely go for long position here is chart setup plan
Your chart highlights several key concepts:
support setup, resistance patch, FVG (Fair Value Gaps), trendlines, and a potential long (buy) setup.
Bullish Signs
Price sitting above diagonal trendline (ascending structure)
Higher low forming within demand zone
Upper FVGs acting as magnet
Final Summary
Bullish
Entry: $90.1k – $90.3k
Stop Loss: Below $89k
Target: $92.5k – $93k
resistance target trade setup.

$SOL ltf trade looking for a retest of the pivot point + 0.38 fib level + poc + as well as the daily ema20
lots of confluence in that area

This is my work aint it great peopleSo theres a cry face because its going down :( And happy face for no reason AND ARROWSSSSSSSSS

Elise | XAUUSD 15m — Sweep → Reaccumulation setupOANDA:XAUUSD
Price grabbed upside liquidity at 4258 and reversed into range accumulation.
Then price swept sell-side into strong demand at 4170–4178, reclaimed structure, and is now retesting micro-trend memory.
Bullish continuation is valid only if price confirms above short-term structure.
Long Scenario (Requires Break)
Break + hold above 4204–4208 enables expansion toward liquidity at:
• Target 1: 4218
• Target 2: 4225 liquidity pocket
Invalidation
Break below 4178 demand base cancels bullish structure and opens retracement toward:
• 4156
• 4138 deep sweep
Currently price is neutral until a bullish breaker confirms.
You do not have an entry just because price is bouncing.
⚠️ This is for educational structure only. Not financial advice

The Market Is Quietly Building a Trap1. Market Structure
- Price has been climbing cleanly from the support zone, forming a consistent bullish sequence: Higher Lows (HLs) and Higher Highs (HHs).
- Each yellow swing shows buyers still in control but momentum is visibly slowing as price pushes into the major resistance zone above.
2. Key Zones (Support & Resistance)
- Support Zone: Strong reaction base where the reversal started; buyers clearly defended this level multiple times.
- Resistance Zone: The market is now pressing into a heavy supply area visible from previous bearish reactions. This is where buyers typically weaken and liquidity shifts to the sellers.
3. Price Behavior at the Zone
- Inside the resistance area, price is starting to produce smaller HHs, overlapping candles, and hesitation early signs of bull exhaustion.
- The projected yellow path on your chart visualizes the most probable flow:
- A final liquidity grab above the resistance, then a sharp pullback as demand weakens.
4. Expected Scenario
The bullish structure remains intact for now, but the market is setting up a textbook bull trap.
Most likely scenario:
- Price pushes slightly higher to sweep liquidity
- Fails to maintain momentum
- Drops back into the resistance zone
- Then confirms the shift with a new Lower High (LH) → Start of short-term bearish correction
5. Trading Plan
No chasing longs into resistance.
Instead, wait for:
- A liquidity sweep above the zone
- Break of the minor bullish leg
- Retest → rejection → short entry
- Target: mid-range or the previous HL zone
This is a high-probability counter-move, aligned with how smart money manages liquidity at key levels.

GBPUSD | Bullish movement began? (READ THE CAPTION!)As you can see, GBPUSD reacted to the FVG and it surged in price because of FOMC, reaching as high as 1.33920, just 8 pip short of the 1.34000 that I had previously talked about.
At the moment, GBPUSD is dealing with supply zone, I expect it to go higher, somewhere around 1.34300, right at the bottom of the next supply zone, and then we have to wait and see how it reacts to that level.

BUY IDEA - GOLDLooking for price to come around the first or second demand zone (depending on PA) for a bullish continuation supporting yesterday's fundamentals.

Another bad day for price action in the Nasdaq
BAD DAY TO TRADE
Nasdaq is very choppy today just as it has been for the entire year. London session already dealt with very high FOMC push so if it went more Bearish on the day I wouldn't be surprised. However the price action for December has been absolutely abysmal. Pre-Market stocks are looking overall Bearish as of 1 Hour before open however that doesn't mean much with how many reversals have been happening lately. London session also broke sellside liquidity but not buyside so that could mean a bullish break of structure but FOMC messed up liquidity bad and it is still recovering so I am overall neutral on the day.
TECHNICAL ANALYSIS BNB/USDT1️⃣ Market Structure and Trend
The chart shows a long-term uptrend, confirmed by a very clean ascending trendline (orange), which has been acting as dynamic support for over a year.
After a strong breakout to ~1380, the price began a correction but still hasn't broken the higher low structure → the uptrend is intact.
2️⃣ Key Levels (exactly from your chart)
🟢 Resistance Levels (green):
~1018 USDT
~1150 USDT
~1249 USDT
These are potential targets for a renewed uptrend.
🔴 Support Levels (red):
~879 USDT – the closest important support
~838 USDT – a key defensive level
~683 USDT – deep support / last HTF trendline
The price is currently trading directly above the first support level.
3️⃣ Trendline (orange)
Your trendline is:
strong, multi-point
drawn on the D1 timeframe
currently around 850–880 USDT
➡️ If the price falls, the trendline perfectly aligns with the 838–879 zone, strengthening this zone as a "must defend."
4️⃣ Oscillators – Stoch RSI (bottom)
Currently:
The oscillator is in a high zone (above 80) → indicating local overbought
However, there is no clear downward crossover yet.
Meaning:
👉 Upward momentum is still active, but we are closer to a local high than a low.
5️⃣ Scenarios
🟢 Upside scenario (more likely as long as the trendline holds)
Condition: Maintaining the 879/838 levels and the trendline.
Targets:
1018 USDT – first resistance
1150 USDT – important medium-term resistance
1249 USDT – main HTF target
The longer the price consolidates above the orange trendline, the greater the chance of a renewed attack on 1150–1249.
🔴 Downside scenario (less likely, but crucial)
Condition: Downside breakout of 838 USDT and closing of the D1 candle below the trendline.
Then:
the market could enter a deeper correction phase
the target would be the 683 USDT level – this is also the main support level, where reactions were previously strong
This is a "capitulation" scenario, but it doesn't seem to be dominant given the current price action.
6️⃣ What can we see on the chart "here and now"?
✔️ The price has rebounded from the local low
✔️ It is still between support at 879 and resistance at 1018
✔️ The uptrend is intact
✔️ A potential HTF higher low has formed
✔️ The Stoch RSI shows momentum, but caution is warranted
➡️ The market is consolidating within the uptrend, with a high chance of a breakout upwards – provided support is maintained.

SOL looking Spicy... Keep an eye on the structure. Solana is still trapped inside a tight range, but momentum is quietly shifting.
Price continues to reject the same major resistance zone, while buyers are stepping in at the bottom of the range with repeated bullish signals on the lower indicators. Each pullback is showing less downside follow-through, and the oscillators are beginning to build higher lows.
The key level remains unchanged: SOL needs a clean breakout above the range high to open up that much larger volume gap toward the mid-140s. Until then, this is a consolidation with tightening compression.
Hold the range - breakout potential.
Lose the range - $116 becomes the next major support.
Watching this setup closely, SOL looks like it's preparing for a bigger move.
What’s your outlook here?

AUDCAD - Stuck in a Range… Bears Eye the Upper Boundary!📦AUDCAD has been moving inside a clear horizontal range , with price repeatedly rejecting the upper resistance zone highlighted in red. Each time price tapped this area, sellers regained control and pushed it downward.
⚔️Price is now approaching that same resistance once again. As long as this zone holds, we will be looking for sell setups, expecting AUDCAD to reverse back toward the lower bound of the range.
📉The bias remains bearish within this structure unless buyers manage to break and close above the resistance with strength.
Do you think AUDCAD will respect the range again? Share your thoughts below 👇
⚠️ Disclaimer: This is not financial advice. Always do your own research and manage risk properly.
📚 Stick to your trading plan regarding entries, risk, and management.
Good luck! 🍀
All Strategies Are Good; If Managed Properly!
~Richard Nasr

XRP - A Make-or-Break Battle at Major Support!!!📉XRP has been moving inside a falling channel , with sellers maintaining control for several weeks. However, price is now retesting a major weekly support zone around the 1.8–2.0 area, a level that has acted as a strong turning point in the past.
⚔️As long as this support zone holds, we will be looking for bullish reactions and potential long setups, expecting XRP to rebound inside the structure.
🏹If buyers step in, the first obstacle ahead will be the blue supply zone, which aligns perfectly with the upper channel trendline, creating a magnet-like area where price is likely to be drawn before the next decision.
Only a strong breakout above the supply zone would confirm a larger bullish reversal.
What do you think.. . will XRP defend this support and push higher? Share your view below 👇
⚠️ Disclaimer: This is not financial advice. Always do your own research and manage risk properly.
📚 Stick to your trading plan regarding entries, risk, and management.
Good luck! 🍀
All Strategies Are Good; If Managed Properly!
~Richard Nasr

XAG/USD: Major Resistance Cleared, What Comes Next?🥈 XAG/USD — SILVER VS U.S. DOLLAR
Metals Market • Swing / Day Trade Opportunity Guide 🧭📈
⚙️ Market Outlook — Bullish Confirmation
Silver has broken through a major resistance zone, shifting momentum firmly into bullish territory.
This breakout signals the presence of strong buyers stepping in, making the market attractive for both short-term and swing-trade setups.
🎯 Trade Plan
📌 Entry:
Enter at any available level after the confirmed breakout retest.
Bullish continuation patterns are forming, giving us a clean pathway to the upside.
🛡️ Stop Loss — Thief Style SL @ 57.000
Dear Ladies & Gentlemen (Thief OG’s), secure your capital wisely.
Adjust SL according to your personal system, risk appetite, and style.
I do not recommend copying my SL blindly — your strategy = your rules.
🎯 Target — Profit With Precision @ 62.000
We have:
🧱 Strong resistance zone
🔥 Overbought conditions expected
🎭 Potential bull-trap areas above
So escape with profits once the market hits our zone.
Dear Ladies & Gentlemen (Thief OG’s), your TP is also your choice — manage your profits with discipline.
🔗 Correlated & Related Pairs to Watch ($ Versions Included)
Tracking these helps confirm momentum, spot divergences, and follow overall metals sentiment.
1️⃣ XAU/USD (Gold vs USD) — TVC:GOLD
Why watch?
Gold and Silver often move together due to safe-haven demand.
When Gold surges strongly while Silver lags, Silver usually follows.
If Gold rejects from resistance, Silver may also cool off.
Key Point:
Gold strength = higher probability continuation in Silver’s bullish wave.
2️⃣ XAU/XAG (Gold-to-Silver Ratio) — $GoldSilverRatio
Why watch?
A falling ratio means Silver is gaining strength faster than Gold.
A rising ratio signals Silver weakness.
Key Point:
A drop in the ratio supports our bullish Silver narrative.
3️⃣ DXY (US Dollar Index) — TVC:DXY
Why watch?
Silver is priced in USD.
When DXY drops, metals typically rise due to USD weakening.
Key Point:
If TVC:DXY shows bearish momentum → Silver bullish continuation is more confident.
4️⃣ XAG/EUR (Silver vs Euro) — OANDA:XAGEUR
Why watch?
Useful to understand Silver’s global demand, not just USD-denominated.
If Silver is bullish across currencies, then the trend is fundamentally strong.
Key Point:
Multi-currency strength confirms genuine Silver demand.
5️⃣ Copper Futures (HG) — CAPITALCOM:COPPER
Why watch?
Silver has partial industrial demand.
When copper rises, it signals industrial activity strength → bullish for Silver.
Key Point:
Copper strength = supportive macro backdrop for Silver.
🧠 Final Outlook
A clean breakout, supportive cross-metal correlations, and favorable USD weakness give Silver an attractive path toward 62.000.
Trade smart, protect your capital, lock in profits, and execute like true Thief OG’s. 🥷📊

BTC/USD 4H CHART PATTERNThis BTC/USD chart shows a clean breakout above a long-term downward trendline that has been holding the price lower for several weeks. Each previous touch of this trendline resulted in rejection, but Bitcoin has now broken through with bullish momentum, supported by price action moving above the Ichimoku cloud. This shift indicates improving market sentiment and increasing buyer strength. After the breakout, the chart suggests that Bitcoin may continue climbing toward the next major target at 98,850, marked on the right side. If the price holds above the breakout zone and maintains stability above the cloud, the bullish continuation becomes more likely. Overall, the structure favors upside movement toward the highlighted target zone.
If you found this XAUUSD analysis helpful, don’t forget to LIKE 👍 and COMMENT 💬!

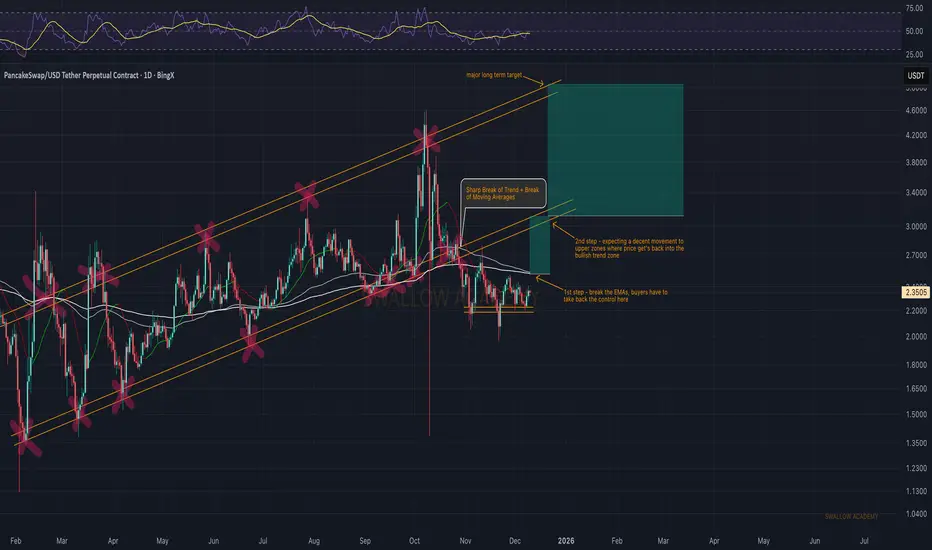
Pancake Swap (CAKE): Getting Ready To Enter The Bullish TrendCAKE is holding the support zone, but buyers still need to take back control by reclaiming the EMAs. That’s the first step before we even think about a move into the upper zones.
If buyers manage to secure the EMAs, we should see price pushing back toward the old bullish trend zone. That’s where the clearer momentum shift forms and the long-term target becomes realistic again. For now, it’s all about reclaiming those EMAs and building from this support.
Swallow Academy
BTC Isn’t Bottoming — It’s Bargaining: Why 75k Still Makes SenseAs I mentioned in my previous analysis, the idea that “BTC has bottomed” simply doesn’t convince me.
And let’s be honest: when a true bottom forms, you won’t see every account on social media announcing it. Markets don’t work that way — especially crypto, where optimism is often weaponized.
From a structural perspective, the entire rise from the 80k zone looks like a textbook corrective move. Yes, we had a perfectly normal rebound into the 94k area, but everything that followed has been classic corrective behavior:
- Mostly ranging price action
- Repeated spikes into 95k that were quickly sold
- Clear overlapping structure
- A bearish flag, which statistically favors continuation lower
If we also consider the four-month distribution phase between 110k–120k, it becomes even harder to justify a bullish reversal narrative. Distribution of that scale rarely resolves into instant trend reversals — instead, it usually marks the beginning of a deeper cycle shift.
So from a psychological standpoint, the crowd is still bargaining — trying to convince themselves the trend is intact, even though the structure keeps printing lower-probability bullish outcomes. That cognitive dissonance is exactly what fuels bear markets.
My view remains unchanged: 75k remains the primary downside target.
And for me, nothing changes unless BTC manages to stabilize above 100k — not just wicks above, but hold with clear buying interest.
Until that happens, selling rallies is the only rational play.
