VLO | Bearish Continuation | SHORTNYSE:VLO
Technical Summary
Valero (VLO) has shifted from a strong uptrend into a clear corrective downtrend. The chart now shows a completed lower-high and lower-low sequence, repeated failures to reclaim monthly structure, and a breakdown through the key support zone at 171–173.
Price is currently sitting inside a weakening demand area that has been tested multiple times. The most recent daily close shows sellers in full control, with no meaningful reaction from buyers.
Bearish Factors
1. Lower-High Structure
The uptrend has already transitioned into a downtrend. After the last swing high, price printed a clean lower high and failed to recover. This confirms a trend shift and favors continuation lower.
2. Breakdown of Support (171–173)
The 171–173 support has been tested several times. Each bounce became weaker, signaling demand exhaustion. The latest close below this zone indicates that former support is now behaving as resistance.
3. Rejection from the Keltner Basis
Price failed to hold above the Keltner mid-band near 175. This reinforces the bearish bias and suggests momentum is not strong enough to reclaim previous structure.
4. Volume Profile Gap Below
The volume profile shows a thin liquidity pocket from 170 down toward 163. When price enters these low-volume zones, continuation moves tend to be fast until the next high-volume node is reached. The next major value level aligns with the 161.87 zone.
5. Trend Context
The overall structure reflects distribution at the highs and increasing selling pressure. Until VLO can reclaim and close above the 175 area, the market favors continuation to the downside.
Short Scenario:
Breakdown Confirmation:
A daily close below 171 confirms continuation toward the value gap.
Targets:
• First target: 161.87 (major volume node)
• Secondary target: Keltner lower band near 163
Invalidation:
A daily close back above 175, reclaiming the Keltner basis and prior structure, invalidates the short thesis.
Outlook
VLO is displaying a textbook shift in trend from bullish to corrective, with weakening support and a clean liquidity pocket below. Unless price can reclaim key structure, the chart supports a move toward 162 over the coming sessions.
X-indicator

USDCHF Remains Range-Bound as Momentum WeakensUSDCHF continues to oscillate within a clearly defined horizontal range that has contained price action since mid-summer. The pair is once again pressing into the lower portion of this consolidation zone, following a sharp downswing that reflects renewed bearish pressure within the structure.
The broader trend context remains downward, with price trading below both the 50-day SMA and the 200-day SMA. The 50-day average has acted as dynamic resistance through most of the range, and the 200-day SMA continues to slope lower, reinforcing the longer-term bearish bias even as price fluctuates sideways in the near term.
Momentum indicators align with this softness. The MACD hovers near the zero line, showing weak directional conviction and minimal trend acceleration. The RSI has slipped toward the lower half of its range, suggesting that downside momentum is increasing but not yet stretched into oversold territory. Combined, these readings imply a lack of upward momentum as the pair tests the lower boundary of its multi-month box.
Overall, USDCHF remains in a neutral-to-bearish posture while contained inside its established range. How the market responds around the lower edge of this structure may determine whether consolidation continues or broader trend forces reassert themselves.
-MW

RKLB | Overextended Into Supply | SHORTNASDAQ:RKLB
Ticker: RKLB (Rocket Lab)
Timeframe: 1H
Bias: Short / Mean Reversion
Author: SHKSPR
Summary
RKLB just printed a parabolic leg straight into a major institutional supply zone, with the final candle closing outside the upper Keltner Channel. This is a statistically powerful signal for exhaustion and mean reversion. Volume profile confirms a thin liquidity pocket below, making the downside path clean.
This move is not sustainable without a pullback — and the chart is flashing a clear short.
Bearish Confluence:
1- Price Closed Outside Keltner Channel
RKLB broke beyond the upper KC band — a sign of volatility blowout and potential exhaustion.
Moves outside the channel historically revert back toward the median band.
2- Rejection From Supply (62.75–63.00)
The candle wicked into a well-defined supply zone:
Prior imbalance
Strong seller presence
Immediate rejection
Absorption at the top of the move
This is the exact area where smart money distributes.
3- Volume Profile: No Acceptance Above
The profile shows a thin volume region above the supply block.
Price briefly visited and got rejected instantly — signaling:
No willingness to build value above
Buyers are exhausted
Sellers are defending levels aggressively
4- Clean Targets Below
TP1: 61.87 — micro HVN + structural retest
TP2: 60.48 — Keltner median + volume shelf
A break below TP1 accelerates the drop.
5- Structure: Parabolic → Stall → Wick Reversal
Classic blowoff pattern:
Vertical expansion
Micro topping wick
Shift in momentum
High R/R short window
Market psychology: buyers trapped at the top, sellers preparing to unwind the move.
Trade Plan:
Short Zone: 62.75–63.00
Stops: Above 63.50 high
Targets:
TP1: 61.87
TP2: 60.48
Invalidation: 1H candle close above supply zone
Final Outlook
RKLB is extended, rejected from supply, out of volatility bounds, and sitting above a liquidity vacuum. Unless buyers reclaim and hold above the supply zone, the path of least resistance is down.
This is a high-probability mean-reversion short setup backed by structure, volatility, and volume profile.

Gold Extends Its Advance as Price Re-Approaches Major ResistanceThe chart shows Gold continuing to build on its broader uptrend, with price pressing back toward the well-defined resistance zone near 4,379 after several weeks of steady consolidation. Recent candles reflect renewed momentum, supported by both trend structure and indicator behavior.
Price remains firmly above the 50-day SMA, which has acted as dynamic support throughout the advance. The 200-day SMA is also trending higher and well below current price, reinforcing the longer-term bullish structure. A rising short-term trendline has guided the market from the November lows, and price is currently respecting this structure as it approaches the upper boundary of the range.
Momentum indicators show improving participation. The MACD has crossed back above its signal line, suggesting strengthening upside momentum after a cooldown phase. Meanwhile, the RSI is hovering near the upper portion of its range but remains below overbought territory, reflecting constructive momentum without immediate signs of exhaustion.
Overall, the technical landscape leans constructively bullish, with price retesting resistance while supported by rising averages and improving momentum. How price behaves around the 4,379 zone may determine whether consolidation continues or the prevailing trend resumes.
-MW

After Russell2000 Post-Tease Breakout, Crypto Bull Run FollowsSince Bitcoin's inception the Russell2000 (IWM) has mimicked a similar pattern involving a tease > dump > breakout with crypto always following suit into a new bull cycle. We all have noticed how most altcoins (such as LTC) didn't follow BTC in price action the past couple of years, but upon yesterday's IWM Breakout into price discovery, we should see altcoins (like LTC) (alongside all kinds of other speculative assets, cyclicals, commodities, etc.) follow suit. This set up suggests a crypto bull run starting now and likely ending within the next 6-12 months.

NXP
📈 1. TECHNICAL ANALYSIS
1.1 Long-term Trend & Channel Structure
Your chart shows a multi-year rising channel (2018–2025). Key observations:
• Price has respected this ascending channel for several years → long-term bullish structure.
• Current price is near the midline of the channel, not at extreme areas.
• The recent bounce from the lower mid-channel suggests buyers are active around 200–210 USD.
Conclusion:
As long as NXPI holds above 200–210, the long-term uptrend remains intact.
⸻
1.2 Moving Averages (EMA 9 / 50 / 200)
From the chart:
• EMA 9 is crossing above EMA 50 → bullish short-term momentum.
• Price is trading slightly above EMA 200, indicating a healthy medium-term trend.
Conclusion:
Momentum is shifting from neutral/bearish to positive.
⸻
1.3 RSI (14)
• RSI is currently near 60–65.
• It recently bounced from oversold levels near 30, showing strong reversal momentum.
Interpretation:
• RSI is not overbought yet, leaving room for additional upside.
• Bullish momentum is increasing.
⸻
1.4 MACD + RSI Combo Indicator
• MACD has formed a bullish crossover.
• Histogram is turning positive.
• Combined with RSI recovery, this supports a short-term bullish trend.
⸻
1.5 Key Support & Resistance Levels
Support zones
1. 210–215 USD → First important support
2. 195–200 USD → Strong structural support & lower band zone
Resistance zones
1. 235 USD → Immediate resistance
2. 255–260 USD → Strong historical resistance & upper channel area
3. 285–300 USD → Major top of long-term channel
⸻
📊 Technical Summary
Indicator Signal
Long-term trend Bullish (ascending channel)
EMA structure Bullish reversal forming
RSI Positive, not overbought
MACD Bullish crossover
Momentum Strengthening
Risk level Medium (price in middle of channel)
Overall technical outlook:
➡️ Bullish bias, but price is approaching a medium-term resistance zone around 235–255 USD.
⸻
🧠 2. FUNDAMENTAL ANALYSIS
Here is the latest macro-level fundamental overview for NXPI (NXP Semiconductors):
2.1 Business Overview
NXP is a major semiconductor company focused on:
• Automotive chips (ADAS, EV, infotainment)
• Industrial IoT
• Mobile & secure payment chips
• RF technologies
Automotive accounts for ~50% of revenue, making company performance closely tied to auto market trends.
⸻
2.2 Revenue & Earnings Outlook
Fundamentally:
• NXPI has strong cash flow and stable margins.
• Automotive semiconductor demand remains structurally high due to:
• EV transition
• Advanced driver-assistance systems
• Increasing chip content per vehicle
However:
• Industrial IoT demand has been soft recently.
• Some customers have been reducing excess chip inventory → short-term revenue pressure.
Overall, analysts expect moderate growth in 2025, driven mainly by automotive recovery.
⸻
2.3 Financial Strength
• Good free cash flow generation.
• Strong balance sheet.
• Aggressive share buyback programs.
• Maintains healthy profit margins compared to other semiconductor players.
Valuation:
NXPI is generally considered undervalued vs. premium peers like NVDA, AVGO, AMD, due to slower growth but higher stability.
⸻
2.4 Risks
• High exposure to automotive sector → cyclical.
• Global semiconductor supply-demand cycles.
• Competition increasing in MCU, automotive, and RF domains.
• Geopolitical risk (U.S.–China tensions).
⸻
✅ Combined Technical + Fundamental Outlook
Technical:
Momentum is improving, indicators turning bullish, long-term structure intact.
Fundamental:
Solid company with strong automotive demand drivers; moderate growth expected but stable cash generation.
Overall Bias:
Neutral-to-Bullish medium term
Bullish long term
⸻
⚠️ Disclaimer (as you requested):
This analysis is only my personal view based on the chart and publicly available information. I take no responsibility for any buy or sell decisions. Please do your own research or consult a financial advisor before making investment decisions.
⸻

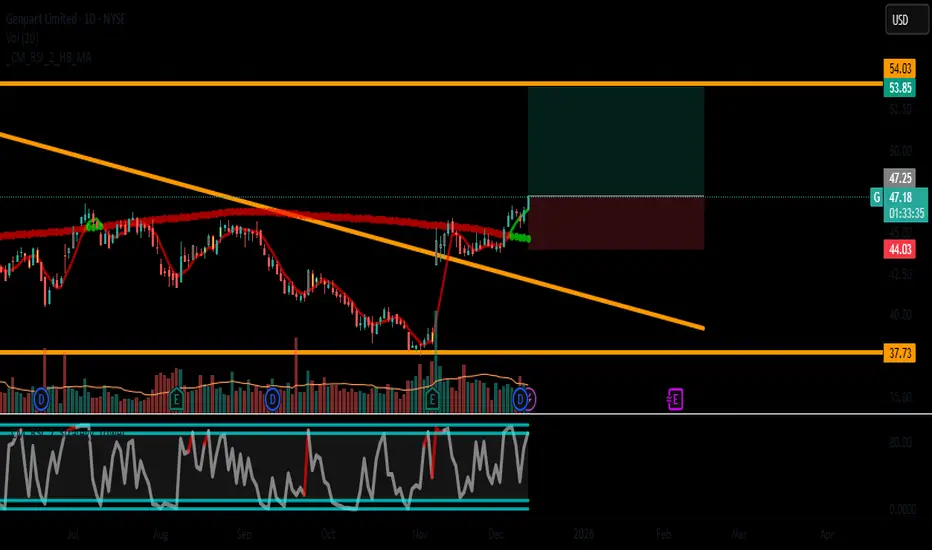
Genpact Limited- PERFECT CONVERGENCE TRADE SETUPTICKER: G (Genpact Limited)
TIMEFRAME: Daily + 4H + 1H (Rare Triple Alignment)
STRATEGY: Trend Continuation with Exceptional Fundamentals
📊 TECHNICAL ANALYSIS - TRIPLE BULLISH CONFIRMATION
MULTI-TIMEFRAME ALIGNMENT:
• DAILY: 🟢 BULLISH Trend, 🟢 BUY Signal
• 4HOUR: 🟢 BULLISH Trend, 🟢 BUY Signal
• 1HOUR: 🟢 BULLISH Trend, 🟢 BUY Signal
Rare perfect alignment across all timeframes
KEY LEVELS:
Current Price: ~$46.40
Immediate Target: $47.80 (Bollinger Upper Band)
Major Target: $53.51 (Fibonacci 161.8% Extension)
Critical Support: $44.00 (Strong Multi-Support Zone)
INDICATOR CONFIRMATION:
• RSI Daily: 70.7 (Strong momentum, NOT overbought)
• MACD: Bullish across all timeframes
• Bollinger Bands: Price riding upper band (strength)
• SMA Stack: Price > SMA20 > SMA50 (Perfect order)
• Volume: Consistent above average
CHART PATTERN:
Flag Pattern consolidation after breakout
Higher Highs & Higher Lows since September
Cup & Handle formation completing
💼 FUNDAMENTAL SUPERIORITY
EXCEPTIONAL SCORE: 10/10
text
• DEBT/Equity: 0.33 (Excellent balance sheet)
• P/E Ratio: 15.0 (Fair valuation)
• Interest Coverage: 7.7x (Strong solvency)
• Revenue Growth: +6.5% YoY
SECTOR ADVANTAGE:
Business Services sector outperforming
Digital Transformation tailwinds
Global BPO Leader - market position strength
INSTITUTIONAL SUPPORT:
88% institutional ownership
Recent analyst upgrades
Strong insider buying
🎯 TRADE PARAMETERS - HIGH PROBABILITY SETUP
ENTRY ZONE: $46.80 - $47.20
Ideal entry on slight pullback to trendline
STOP LOSS: $44.00 (-6.4%)
Below Daily SMA50
Below recent swing low
Below psychological $44 support
TAKE PROFIT: $53.51 (+13.8%)
161.8% Fibonacci extension
Measured move from flag pattern
Previous all-time high resistance
RISK/REWARD: 1:2.16 (Excellent)
📅 TIMEFRAME & POSITION MANAGEMENT
TRADE DURATION: 4-8 weeks
SMART POSITIONING:
STAGE 1 (50%): Entry at $47.00
STAGE 2 (30%): Add at $46.50 if retested
STAGE 3 (20%): Add on break above $48.50
PROFIT TAKING STRATEGY:
25% at $49.50 (Resistance break)
25% at $51.00 (Psychological level)
50% at $53.51 (Final target)
TRAILING STOP:
Breakeven at $48.00
Trail 8% after $50.00
Final stop at $49.50
⚠️ RISK MITIGATION
MONITOR THESE SIGNALS:
Daily RSI: Watch for divergence above 75
Volume: Should expand on breakout
Sector Rotation: Out of services into tech
Market Sentiment: Overall bullish bias needed
INVALIDATION CONDITIONS:
Daily close below $45.74 (immediate support)
RSI reversal with price making new highs
Volume dries up on upward moves
📈 PRICE SCENARIOS & PROBABILITIES
PRIMARY (75%): $53.51 Target Hit
Clean breakout, steady uptrend
Fundamentals continue to support
Sector remains favorable
SECONDARY (20%): $51.00 Partial Profit
Resistance at $51 holds initially
Consolidation before final push
Still profitable trade
MINOR (5%): Stop Loss Hit
Market correction or sector rotation
Unexpected fundamental news
Failed breakout scenario
🏆 WHY THIS IS A TOP-TIER TRADE
Rare Triple Alignment: All timeframes bullish
Fundamental Excellence: Perfect 10/10 score
Technical Precision: Clear levels, high probability
Risk Management: Favorable R/R ratio
Catalyst Ready: Sector tailwinds + institutional support
EDGE FACTORS:
No contradictory Connors signals
Low float stock with institutional accumulation
Consistent earnings growth history
Strong technical structure
📌 EXECUTION CHECKLIST
CONFIRM: Daily close above $46.50
CONFIRM: RSI maintaining above 65
CONFIRM: Volume > 1.2M shares
ENTRY: $47.00 zone
STOP: $44.00 (hard stop)
TARGET: $53.51 (scale out)
TRADE SIZE RECOMMENDATION: 3-4% portfolio allocation
CONFIDENCE LEVEL: 8.5/10
PATIENCE REQUIRED: Medium (weeks, not days)
Disclaimer: This analysis is for educational purposes. Past performance doesn't guarantee future results. Always conduct your own research and consult with a financial advisor.
✅ LIKE if you agree with this setup!
💬 COMMENT your take on G below!
🔔 FOLLOW for more high-probability trades!
🔄 SHARE with fellow traders!
#G #Genpact #Trading #Stocks #Investing #TechnicalAnalysis #FundamentalAnalysis #Breakout #TradingView #StockMarket
LONG ON UJPossible push to the upside on UJ
Sell Side Liquidity taken and the high broken right after giving me the impression that big institutions may have forced the SSL in order to enter the market
1;50 rr, may seem far fetched but looks like a good trade to me
possibility to get stopped out because of the tight SL
safer sl would be 153.550

IREN to 25 NASDAQ:IREN
in my opnion iren cant hold this up
its must go down to get up
fair price is 25-27
good luck

GBPCAD higher bearish expecting
OANDA:GBPCAD whats next, we are have strong bearish push, currently price on sup. zone, expecting break of same and new bearish push.
SUP zone: 1.85800
RES zone: 1.82500, 1.82000

A 50% increase in a short time This stock presents a compelling opportunity, backed by strong fundamentals and a healthy financial outlook. On the technical side, it's forming a bullish chart pattern with clear support levels — indicating strong institutional interest. The setup suggests potential for a breakout if current momentum continues.
shortWe are at go resistance zone on daily chart. Volume are going down and after the big spike up coming from fed rate cut, we are maybe going for a little breathing on the pair so i am trying to go gain some pips.
good P/L ratio
I put my TO on the previous structure breakout.
have great day

2026 $LMND +30% to +230% Playbook 2026 Scenarios & Probabilities
! If the fundamentals keep strengthening !
LMND is evolving inside a large bullish channel since May.
Estimated slope: +4 to +6 USD/month.
Mid-2026 projections:
Upper channel: 120–140 USD
Mid-channel: 95–105 USD
→ As long as price stays above the mid-channel, the broader trend remains bullish.
2. Current Pattern & Indicators
Pattern
Tight bullish consolidation, close to a potential breakout.
Indicators
RSI 57–63: bullish momentum, not overheated.
MACD: forming a bullish cross.
EMA45 (~73 USD): dynamic support.
MA200 (~60 USD): major long-term anchor for the trend.
3. Buy Zones – Revisit Probabilities
Accumulate Zone (75–67 USD)
≈ 35% probability
Buy Zone (67–60 USD)
≈ 50% probability
Strong Buy Zone (60–48 USD)
≈ 20% probability
4. 2026 Scenarios (Quantified)
1. Trend Continuation (Base Case)
Probability: 45%
Target: 95–110 USD
Upside: +15% to +32% from current levels, +40% to +70% if averaging inside buy zones.
2. Pullback → Reaccumulation
Probability: 40%
Target: 85–100 USD
Upside: +30% to +55% if buying 67–60 USD.
3. Breakdown Below MA200
Probability: 15%
Downside: 48–52 USD
Potential drop: –35% to –40%
4. Dream Case – Parabolic Expansion
Probability: 3–5%
Target: 150–200 USD
Upside:
From 83.7 → +80% to +140%
From 60 → +150% to +230%
Requirements:
Fundamentals keep strengthening
Strong flows into small/mid-cap tech
Sector re-rating of insurtech
Breakout of the upper channel → parabolic phase
5. Operational Plan
Entries
75–67 USD: Accumulate (25–30%)
67–60 USD: Main DCA (40–50%)
60–48 USD: High-conviction zone (20–30%)
Targets
TP1: 95 USD
TP2: 110–120 USD
Extended: 140 USD
Dream Case: 150–200 USD
Follow me here and on X @kleanfreezr for spontaneous analysis

2026 $ONDS 45% to +1,066% Playbook 2026 Scenarios & Probabilities
! If the fundamentals keep strengthening !
1. Trend Resumes Up (Base Case)
Probability: 45%
Target: 14–18 USD
Potential upside: +60% to +110%
2. Pullback → Then Rally (Typical Reaccumulation)
Probability: 40%
Target: 12–14 USD
Potential upside (if buying the dip): +75% to +120%
3. Breakdown Below MA200
Probability: 15%
Downside: 4.5–5.0 USD
Potential loss from current levels: –35% to –45%
4. Dream Case – Parabolic Expansion
Probability: 3% to 5%
Target: 50–70 USD
Potential upside:
From 8.69 → +475% to +705%
From 6.00 (Strong Buy Zone) → +733% to +1,066%
Buy Zone Probabilities (Revisit Likelihood)
Accumulate Zone (8.5–7.8)
40% chance of retest.
Buy Zone (7.2–6.8)
55% chance of retest.
Strong Buy Zone (6.3–5.8)
20–25% chance of retest.
Follow me here and on X @kleanfreezr for spontaneous analysis

$UPS WyCkoff updatePrice is following the spring → test → markup sequence beautifully.
We got the spring, we got the test, and now we’re seeing the early signs of the expected shift toward the next resistance zone.
Staying patient — Wyckoff takes time, but the structure is playing out step-by-step.
#UPS #Wyckoff #WyckoffMethod #Spring #Markup #StocksToWatch #PriceAction #TechnicalAnalysis #TA #TradingView #MarketAnalysis #SwingTrading #Investing #CockpitTrader

Gold Analysis & Trading Strategy | December 11-12✅ 4H Chart (H4) Trend Analysis
1️⃣ A strong bullish candle breaks multiple resistance levels
Gold surged out of the previous consolidation range with a powerful bullish candle, breaking through the 4247–4250 resistance zone and reaching a high of 4281.
This shows strong participation from major buyers and clearly strengthened bullish momentum.
2️⃣ Moving averages in full bullish alignment
Short-term MAs (MA5/MA10) are sharply turning upward, with price holding firmly above them.
MA20 (around 4210) now acts as an important pullback support.
As long as price stays above MA5/MA10, the structure remains strongly bullish.
3️⃣ Bollinger Bands expanding upward, indicating a trending market
Price broke above the upper band and is riding along it — a typical signal of a strong continuation trend.
→ Upside momentum still has room to extend.
📌 H4 Conclusion:
Gold has broken key resistance and shifted into a strong uptrend.
Pullbacks toward 4250–4260 are normal corrections; if support holds, the bullish trend is expected to continue.
📊 1H Chart (H1) Trend Analysis
1️⃣ Multiple strong bullish candles followed by high-level consolidation
After breaking resistance, price is consolidating within 4270–4280, forming a high-level range.
This consolidation is considered a bullish continuation pattern, not a topping signal.
2️⃣ Strong short-term support from MA5/MA10
The moving averages form a clear bullish staircase structure:
MA5 support near 4268
MA10 support near 4258
As long as price stays above MA10, the short-term trend remains intact.
3️⃣ Bollinger upper band rising — bullish momentum intact
The upper band continues to move higher, showing that momentum has not weakened.
A break above 4281 may trigger another upward extension.
📌 H1 Conclusion:
The short-term structure is strongly bullish.
Key support sits at 4260–4250; holding this zone keeps the trend intact.
🔴 Resistance Levels
4281 (recent high)
4290–4300 (psychological + structural resistance)
4315 (extension target)
🟢 Support Levels
4268–4260 (MA5/MA10 on the 1H chart)
4250 (previous resistance turned support)
4210–4205 (H4 key structural support)
📌 Trading Strategy Suggestion
🔰 1. Buy on Pullback (Main Strategy)
📍 Consider buying near 4260–4250
🎯 Targets: 4281 / 4290 / 4300
⛔ Stop-loss: below 4244
Why:
Strong uptrend intact
Pullback to support offers a better entry
MAs + Bollinger Bands both support bullish continuation
🔰 2. Breakout Buying (Secondary Strategy)
📍 If price breaks above 4281, you may consider a light breakout entry
🎯 Targets: 4295 / 4310
⛔ Stop-loss: below 4270
Why:
High-level consolidation → bullish accumulation
Breakout often leads to a momentum-driven extension
📌 Summary
Gold is currently in a strong bullish trend:
H4: Breakout of major resistance → uptrend confirmed
H1: High-level consolidation → preparing for another push upward
As long as 4250–4260 holds,
the short-term outlook remains bullish, with buy-the-dip as the preferred strategy.

Gold Short-Term Correction vs. Long-Term Bullish Thesis
Key Structural Analysis
The "Big Triangle" (or Consolidation): Price has been consolidating for a long period, forming a large symmetrical or ascending triangle pattern. This pattern represents a period of quiet accumulation and decreasing volatility—the "calm before the storm."
The Final Correction: The recent price action (the Double Top/Neckline break on your 1H chart) is the final, sharp correction that occurred above the triangle's key support trendline. This move is designed to:
the Breakout Level: Re-test the top boundary of the previous triangle/consolidation range, turning old resistance into new, strong support.
Shake Out Weak Buyers: Force short-term traders out of their long positions before the major move.
Breakout Imminent: With the correction completed (or nearing its completion), the price is now coiled and positioned for the final bullish breakout above the most recent peak.
Trade Thesis: Patience for the Big Move
Risk Area: The current weakness is simply the market testing the patience of traders. Shorts are capitalizing on the Double Top, but their upside is structurally limited by the Big Triangle's support.
The Target : Once the price confirms the breakout from the current correction's high, the measured move will be based on the height of the entire Big Triangle, projecting a massive, long-term target in line with the major bullish fundamentals (rate cuts).

XAUUSD Short Update Target SMASHED! XAUUSD Short Update Target SMASHED!
From 4,240–4,250 entry → hit full target zone at 4,215–4,210
+300 pips banked on the move, runners still active toward 4,190 Beautiful rejection from the red supply zone as planned! This is for educational purposes only – NOT financial advice. Trade responsibly. #XAUUSD #Gold #300Pips #TargetHit #ShortSetup #Forex #Trading #NotFinancialAdvice


Review and plan for 12th December 2025 Nifty future and banknifty future analysis and intraday plan.
This video is for information/education purpose only. you are 100% responsible for any actions you take by reading/viewing this post.
please consult your financial advisor before taking any action.
----Vinaykumar hiremath, CMT

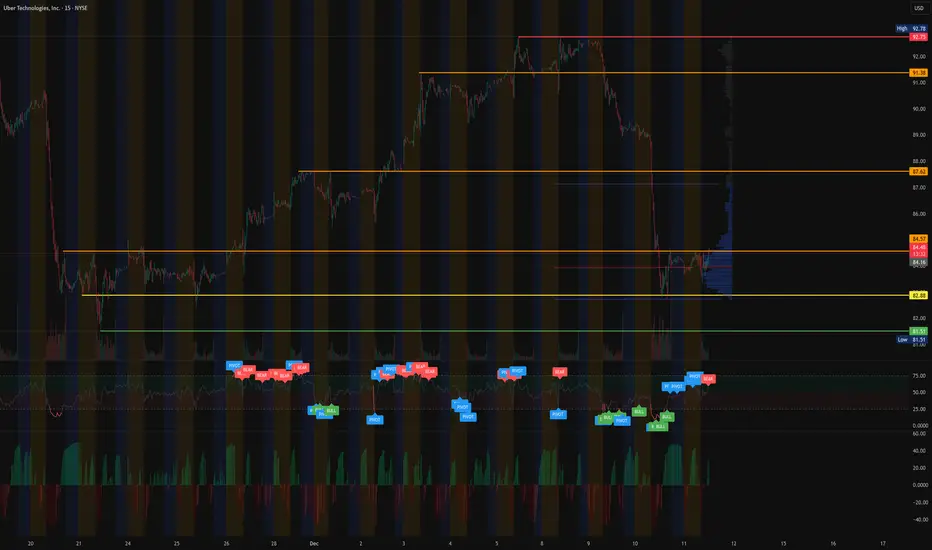
$UBER - Pullback To Key Support After Multi Week RallyUBER has pulled back into a major support zone at 82.88 after a strong run toward the recent highs near 92.75. Price is now consolidating at the lower end of this micro-range, holding above value-area support and attempting to stabilize after heavy selling pressure.
The chart shows a clear liquidity sweep below support followed by buyers stepping back in, which can be a constructive sign if momentum continues to shift upward.
We prefer the long setup closer to 82.88, where both structure and volume support align.
Technical Overview
Support Levels:
82.88 (primary support, ideal buy zone)
82.40 (local low)
81.51 (momentum failure level)
Resistance Levels:
84.57 (current ceiling and VWAP zone)
87.62 (value-area boundary)
91.38 (major supply zone)
92.75 (recent high)
Structure:
Strong prior uptrend followed by retracement
Consolidation forming above 82.88
Sideways corrective range with declining volume
Price trading inside high-volume node on VPVR
Momentum:
MACD histogram shifting toward neutral
RSI stabilizing after the flush
Buyers defending support consistently
Trend Bias:
Bullish as long as price holds above 82.88
Strongly bullish above 84.57
As long as UBER holds above 82.88, bulls maintain control over this retracement setup.
A reclaim and hold above 84.57 opens the door to 87.62, 91.38, and a potential retest of 92.75.
A breakdown below 81.51 signals failed momentum for this setup.
My Plan
Entry Zone: 82.88 to 83.25
Targets: 84.57, 87.62, 91.38
Stretch Target: 92.75
Invalidation: Close below 81.51
UBER remains in a bullish macro structure, and this pullback may offer one of the cleaner continuation entries if support holds.
Share your thoughts, and I will post an update if we confirm a breakout over 84.57.
#UBER #Stocks #MyMIWallet #TradeAlerts NASDAQ:LYFT NASDAQ:AMZN NASDAQ:GOOG
XAUUSD Analysis todayHello traders, this is a complete multiple timeframe analysis of this pair. We see could find significant trading opportunities as per analysis upon price action confirmation we may take this trade. Smash the like button if you find value in this analysis and drop a comment if you have any questions or let me know which pair to cover in my next analysis.

$95 IncomingLooks like this bear flag just broke below. Without a close back in the flag and if the the price confirms on a back test, the measured move is to $95.
