DXY Bears finally coming inDXY took out the buy-side liquidity sweep and closed below the POC, showing me sell-side acceptance.
Bearish
UCAD
UCHF
UJPY
Bullish
AU
EU
GU
NU
X-indicator

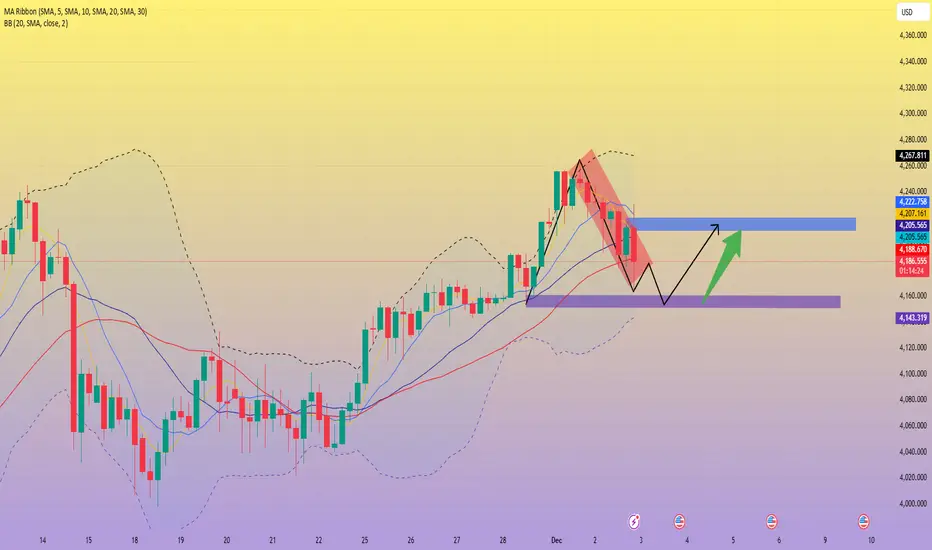
Support after price pullback. Watch for the rebound high.Gold has rebounded after hitting a low of around 4164. Currently, it's experiencing a slight rebound and is now consolidating within a large range. This consolidation, coupled with uncertainty surrounding upcoming news, has left both bulls and bears hesitant, awaiting further market developments.
Looking at the 4-hour chart, after encountering resistance at 4264, the price has been declining, but the downward momentum has been weak, with occasional rebounds from lower levels. Currently, the short-term moving averages have formed a death cross, coupled with the MACD data showing a death cross, indicating a downward pressure in the market, and the Bollinger Band's middle line has also been broken.
Looking at the 1-hour chart, the price continued to decline in the Asian and European markets on Tuesday, reaching support around 4200, but without effective support. At this point, the key support level to watch in the US session is the 4150-4160 range.
In summary, Quaid recommends a short-selling strategy as the primary approach, with buying on dips as a secondary strategy. The key resistance level to watch in the short term is 4215-4220. Traders must follow the trend closely, manage their position size carefully, and strictly set stop-loss orders.
Trading Strategy:
Short in batches between 4210-4220, stop loss at 4230, profit target 4160-4170. If it breaks below 4160 again, watch for a move towards 4140.
Go long between 4150-4160, stop loss at 4140, profit target above 4200.
I will adjust my strategies flexibly based on market fluctuations and update the channel accordingly.
TURBO USDT LONGTURBOUSDT – Daily Bullish Engulfing Setup
Today’s daily candle on TURBOUSDT is showing strong bullish momentum: it has engulfed the previous three candles, which indicates aggressive buying after a short-term pullback. There is about one hour left until the daily close; if the candle closes near the current levels or higher, this pattern will confirm a potential bullish reversal on the 1D timeframe.
My plan for this setup:
I am watching this zone for a long entry if the daily close confirms the bullish engulfing structure.
The invalidaton for this idea is a clean break below today’s low – if price closes or trades convincingly below that level, the setup is no longer valid.
On a successful entry, I see room for a 40–50% upside move toward the next daily resistance levels, where I will look to secure partial profits and trail the remaining position.
As always, this is not financial advice – just my personal trading plan based on price action and risk management.

BTC Bullish Divergence: Eyeing 97,365 After 1h Break Above 91,58Bullish RSI divergence formed. BTC closed a 1h candle above the previous resistance at 91,580 and may move toward the 50% retracement at 94,283, with potential extension to 97,365 depending on price behavior. Trading involves risk, so manage positions carefully and be prepared for volatility

VETUSDT 12H#VET is moving inside a falling wedge pattern on the 12H timeframe chart. In case of a breakout above the wedge resistance and the 12H SMA50, the potential targets are:
🎯 $0.01457
🎯 $0.01603
🎯 $0.01722
🎯 $0.01840
🎯 $0.02008
🎯 $0.02223
⚠️ Always remember to protect your capital with a proper stop-loss and disciplined risk management.

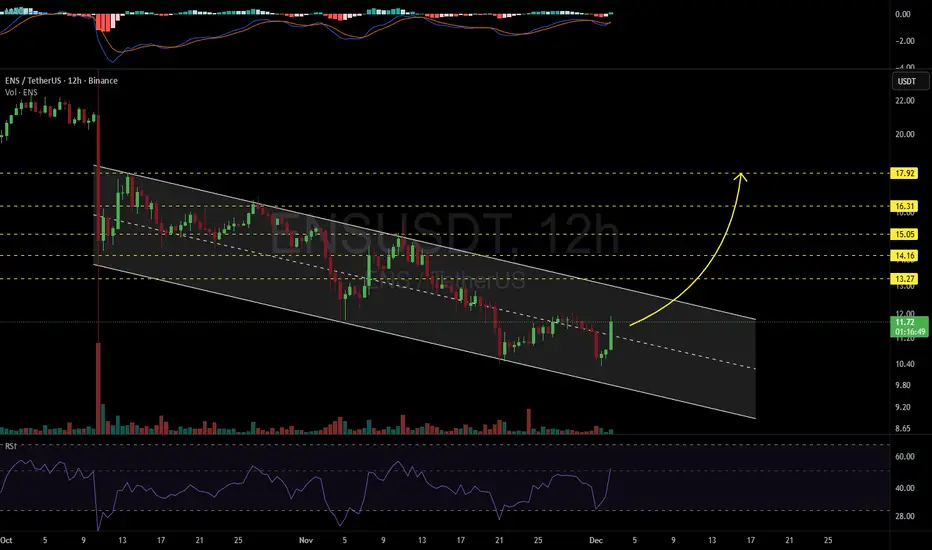
ENSUSDT 12H#ENS is moving inside a descending channel on the 12H timeframe. In case of a breakout above the channel, the potential targets are:
🎯 $13.27
🎯 $14.16
🎯 $15.05
🎯 $16.31
🎯 $17.92
⚠️ Always remember to protect your capital with a proper stop-loss and disciplined risk management.
AIH AnalysisOk, as predicted before long ago, i gave you a good entry at 0.46, but i think there still good chance to make some money in here. Iam very much looking to take this trade, that's why i did some fundamental analysis on this stock which turned out to be a low cap stock.
Ok, lets run quickly through some facts:
1- Economy is doing great in Egypt in general, and its expected a rate cut by Q4 2025.
2- The company previous FY of 2024 ended with a total loss of almost 24 million. Q1 2025 was at loss of almost 1 million
3- There will be Q2 statement and if the company in profit it will be a plus (which is actually very hard to expect, but if its in red with 1 or 2 million EGP i still think it will not be a problem), which might offer an entry point.
To sum it up: 2024 in total loss of 24 million, now Q1 is only 1 million in loss, with expectations that the economy as a whole will do better, so this company also is expected to be in profit later down the road, which explains the surge in price.
Technically,
- This chart took more than 2 hours to understand what is going on and how we should proceed from here.
So there are two case scenarios in here, as iam technically expecting this surge to continue until at least 0.96 to 1 Egp. But of course on the technical level it will never be a straight line to 1 EGP.
So from where the price is at right now.
- Broke a huge down trendline (bullish)
- We are above weekly upper VAH (bullish)
- VWAP is reversing upwards (bullish)
- Recent liquidity has been taken (bullish)
!! Worrying, there are some huge liquidity areas under the trendline, but if whales crashing the stock to reach those areas, i would be amazed.
Now to go deep into details,
we will assume that the price closed above A1 (orange line, on the Daily and Weekly, early sign will be daily), also didn't stretch much or even beyond that zone 1, or the yellow box and will start correcting, there are three areas of interest
1- The black area, this area is not very important as the price could always ignore it (even though its Value area high VAH) and heads to an area which is more liquid and have much higher volume, however, it cant be ignored, so i would put very small amount of money into this zone.
2- The Orange area, now that's an important area as it is the 0.5-0.618 Fib level, break out of a micro trendline and this area has the potential to become a Resistance turned into Support, Additionally iam anticipating VWAP to reach that Orange area by the time price reaches this area. Further, This area has some volume, but not major.
(entry will be discussed later but if you want use the VWAP on the weekly TF as a guide along with volume, then volume spikes and increasing in volume in this area on lower tf once the price touches the VWAP on the weekly have very good hit rate)
3- The Blue area, now thats an interesting area because thats the High Volume Node on the Weekly timeframe, which means bears will face a fierce resistance to break it to the downside also 0.78 Fib level.
Now we assume that the price closed above the A1 on the weekly, and preferably above the yellow area.
then we shift our thinking into longing from this yellow zone and we will have our stoploss under the Orange area. And if you want to snipe the entry, there is a purple line in the middle of the yellow box, now confirm on lower tf once price touch this line, and look for a stoploss below this black box.
Iam very confident that the bears will take some control in the red box marked above and we will have some reaction here, but iam not sure if i should be selling everything in this level, maybe we can take some profit and rotate back during correction, will update when the time comes.

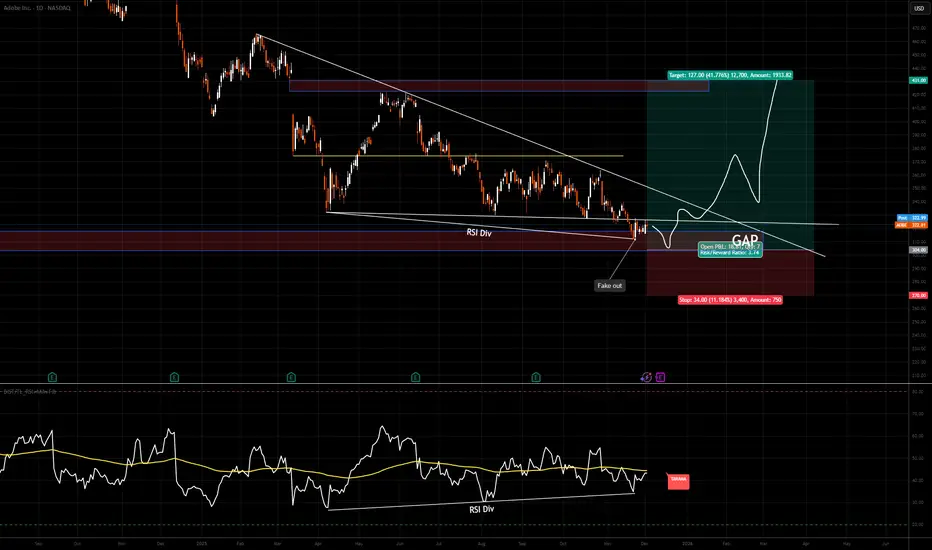
ADBE Fake Out Fill the Gap Descending Wedge PatternI want to start buy from here.
When AI trend end, ADBE will be one of the first stocks that rise.
I'll wait till fill the GAP.
If I'll see "Day Close" above bottom line of the "Descending Wedge Pattern", I'll buy again
My first targe will be GAP at top but I'm expecting more than that.
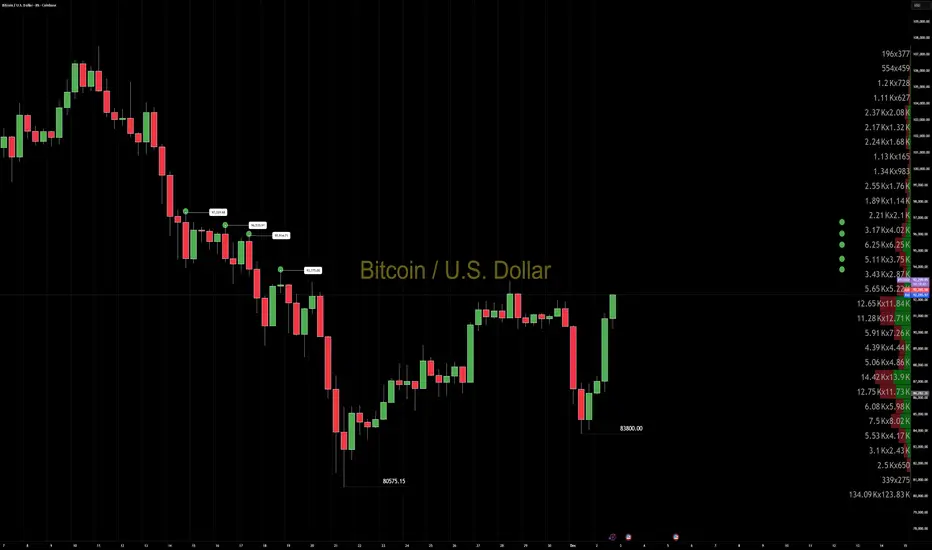
BTCUSD: Clean Higher Low and Orderflow Drive Toward MidrangeBTCUSD confirmed a new higher low at 83,800.
Today’s session delivered a strong orderflow boost that cleared the daily highs and pushed price back toward midrange.
From a CORE5 lens — using Order Flow Dynamics and Volume Flow Analytics — the tape shows sustained buyer aggression after the higher low formed.
Key upside levels ahead:
93,775
95,914
96,535
97,329
As long as the 83,800 higher low holds, BTCUSD maintains a clean intraday bullish behavior profile into midrange rotation.
Trade the behavior, not the story.
— CORE5DAN
Institutional Logic. Modern Technology. Real Freedom.
XAUUSD -SETUP Last week, I issued a buy signal, and the market moved exactly as anticipated, delivering a profitable bullish run.
Price has since pulled back into a key support zone, aligning perfectly with the structure and maintaining the overall bullish trend.
At the moment, price is reacting around two major support levels, and as long as these zones continue to hold, I expect the bullish momentum to resume.
🔍 Outlook:
Holding above support keeps the uptrend intact
Looking for bullish continuation towards the next resistance levels
Invalidated if price breaks and closes below the secondary support zone
📈 Summary:
The bullish bias remains strong while structure is respected. Look for confirmation before re-entering long positions on the two supports zones

QDMICriterion Rating / Comment
ROIC > 10% ✅ Yes — ROIC ~ 59.8%
StockAnalysis
ROE > 15% ✅ Yes — ROE ~ 87.9%
StockAnalysis
FCF yield > 6-8% ❓ No public, stable data on free cash flow, and there are quarters with losses
StockAnalysis
+1
Debt/EBITDA < 3 ✅ Yes — almost no debt to EBITDA
StockAnalysis
Growth of FCF + EPS + Revenue ⚠️ Results are rising sharply — there is growth, but also high volatility
TradingView
+2
stocktitan.net
+2
Moat / competitive advantage ❌ No — brokerage/intermediary model, no sustainable moat
Good management 🔶 Unclear — there is insider buying, but governance & dependency risk are high
Investing.com
+2
Simply Wall St
+2
You are buying below fair value (margin of safety) ❓ Too speculative — valuation metrics (EV/EBITDA, EV/Sales) are very high in previous good periods; even in a good year it is risky

Gold Technical Analysis: High-Level Doji Indicates Resistance, BGold Technical Analysis: High-Level Doji Indicates Resistance, Beware of Short-Term Correction Risk
I. Market Review
Yesterday, the gold market initially rose before falling, with prices encountering significant resistance around 4264 and subsequently retreating, largely in line with earlier analysis. Although the price didn't break the inner support line during the decline, experiencing a brief rebound to 4245 near 4215, it faced renewed pressure and fell back in the late session, ultimately closing with a doji. This high-level doji indicates intense competition between bulls and bears, with significant resistance above.
II. Technical Analysis
1. Daily Chart Analysis
Pattern Signal: A doji forming at a high level after a continuous rebound is a typical sign of stalling momentum, suggesting weakening upward momentum and increased short-term downward pressure.
Two Potential Developments:
**Piercing Pattern:** If the subsequent candlestick body covers the high and low of the doji, a reversal signal will be confirmed.
**Direct Decline:** Even after a slight rebound, the downtrend may continue. Even if a new high is reached in the short term, the rebound is expected to be limited, and the market will likely return to a downward trend.
2. 4-Hour Chart Analysis
Structural Characteristics: A weak bearish pattern has formed at a high level. The price has fallen below the short-term moving average system, and the moving averages are starting to diverge downwards, indicating a weakening short-term trend.
Key Support: The inner sloping support line is currently providing some support, but a decisive break below this level would open up further downside potential.
3. Hourly Chart and Key Price Levels
Support Breakdown Situation: The 4200 psychological support level has been broken. Yesterday, the price tested this area multiple times, but the rebound strength and sustainability were insufficient. A slight break below this level could trigger a sustained decline.
Top Confirmation Conditions: If the support around 4200 is decisively broken, it will essentially confirm that this round of rebound has peaked. Conversely, if the price finds support at this level and rebounds, the market may repeatedly test previous highs, forming a consolidation pattern.
III. Trading Strategy and Key Levels
Resistance and Support
Upside Resistance: Pay close attention to the 4255-4265 area, which is a key resistance zone that has been tested multiple times recently.
Support Levels: Short-term focus is on the 4173-4180 area. A break below this area could lead to further downward movement.
Trading Strategy: Primarily shorting on rallies, with long positions on pullbacks as a secondary strategy. Strict position sizing and risk management are crucial. Set strict stop-loss orders and avoid holding losing positions.
Short Position Strategy: Entry Area: Consider shorting in batches around 4225-4230, with a recommended position size of 10%-20%.
Stop-Loss: 8 points.
Target Area: Initial target 4200-4185, with a further target around 4175 if this level breaks.
Long Position Strategy: Entry Condition: Consider long positions in batches after a pullback to and stabilization around 4170-4175, with a recommended position size of 10%-20%.
Stop-Loss: 8 points.
Target Area: 4200-4210, with a further target around 4220 if this level breaks.
IV. Risk Warning Market trends are uncertain, and all strategies must be adjusted flexibly based on actual market conditions.
Please ensure proper position management, keeping the risk of each trade within a reasonable range.
Breakthroughs of key price levels may trigger accelerated price movements; close monitoring of market momentum is essential.

AMZN long-term TAAmazon is consolidating, the indicators do not support recent short-term runs which resulted in pullbacks but the trend is neither bearish, more neutral-bullish and also it supports SMA50 along the way, yes there were news about new AI chip from Amazon to rival Nvidia and so on and it has a chance to rally yet following the AI hype trend ride, but the volumes didn't react that much either, we just have to give it a little bit more time to finish the consolidation and project the approximate outcome.

Dow Jones Attempts to Reach New HighsThe index has managed to maintain a gain of more than 2% over the past six trading sessions, attempting once again to approach its historical highs as the market holds a consistent short-term bullish bias. For now, buying pressure has remained supported by a temporary rebound in market confidence, driven by expectations of lower interest rates from the Federal Reserve next week. If this improvement in confidence continues, current buying pressure could remain dominant in the sessions ahead.
Uptrend Line Remains Relevant
The long-term upward trendline visible in the Dow Jones has continued to hold despite recent fluctuations, and so far, no meaningful bearish correction has emerged to threaten its structure in the short term. As a result, it remains the most important technical factor to watch, especially if price manages to reach the previous high zone again, which would confirm a dominant bullish bias heading into year-end.
RSI
The RSI continues to fluctuate slightly above the neutral 50 level, suggesting that average buying momentum over the last 14 sessions remains dominant. If the RSI line continues to show steady growth, buying pressure could strengthen further.
MACD
The MACD remains very close to the neutral zero line, reflecting a sense of neutrality in the strength of short-term moving averages. Although there is buying pressure in the Dow Jones, the lack of a clear recovery in the histogram may lead to a period of consistent indecision, producing narrow-range candles and signaling a possible pause in the bullish momentum.
Key Levels to Watch:
48,248 points – Major resistance
This level corresponds to the historical highs and remains the most important bullish barrier. Buying movements approaching this zone could reactivate a strong bullish bias and extend the current upward trendline.
46,821 points – Nearby barrier
A level aligned with the 50-period simple moving average. It may serve as a key area to monitor in case of potential short-term bearish corrections.
45,677 points – Primary support
This level corresponds to the recent lows. If price approaches this zone again through bearish movements, it could signal the end of the current uptrend and open the door to a more meaningful bearish bias in the short term.
Written by Julian Pineda, CFA, CMT – Market Analyst

Gold Update: From Turtle Soup Win to NY Breakout PlanYesterday was a challenging session with two breakeven stop-losses:
Long from 4256: Expected bullish continuation, but London session gave a fakeout and price retraced from yesterday’s top at 4265.
Short from 4225: Price action failed to break the Asian low, and breakeven was hit again.
Later in the New York session, I spotted a trustworthy Turtle Soup pattern on the daily chart and entered short at 4240. The Tokyo session delivered an excellent TP hit at 4200, providing a solid foundation for today’s strategy.
Today’s Technical Outlook
Asian low: 4193 – I doubt we revisit this level soon, so I’ll avoid shorts unless a 4H candle closes below it.
Bullish scenario:
Wait for New York session and a break of previous week high at 4230.
From there, go long with:
TP1: 4245
TP2: 4265
Fundamental View
Gold remains supported by strong expectations of a Fed rate cut in December, with markets pricing an 87% probability of easing. Lower rates reduce the opportunity cost of holding gold, reinforcing bullish sentiment.
Additional drivers:
US Dollar weakness near two-week lows makes gold more attractive globally.
Geopolitical tensions and safe-haven demand continue to underpin prices.
Structural demand remains strong, with central banks and ETFs adding significant reserves.
However, traders should watch for key US data releases and Fed commentary this week, as any hawkish surprise could trigger a pullback toward Asian low (4193) or deeper supports near 4155


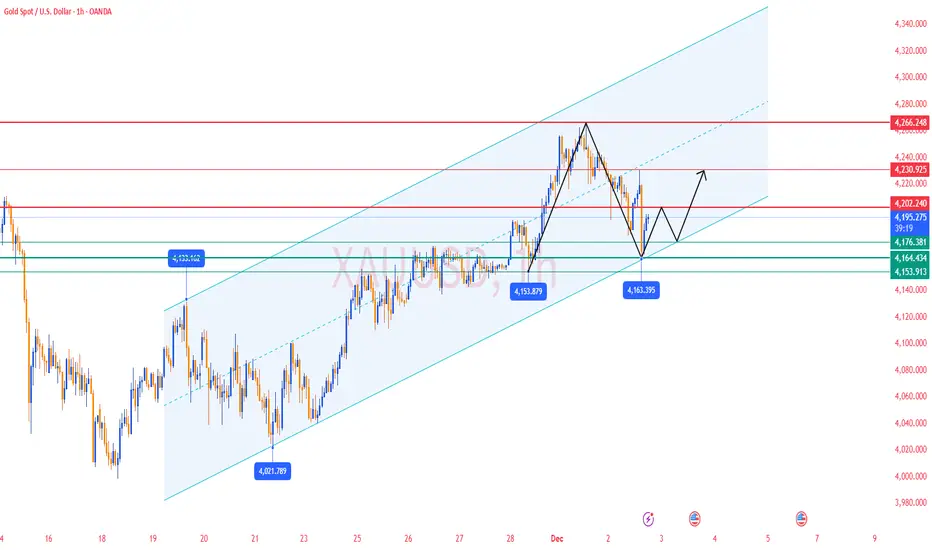
Gold Analysis & Trading Strategy | December 2–3✅ During today’s U.S. session, gold dipped to a low of 4163 and then strongly rebounded to around 4195.
➡️ This indicates two key points:
1️⃣ 4163 has been confirmed as the short-term bottom of this downward move (strong support validated)
2️⃣ Buyers absorbed positions near the key support zone → rebound momentum is recovering
Gold has shifted from a “sharp decline / weak structure” into a “bottoming rebound pattern.”
✅ 4H Chart (H4) Trend Analysis
1️⃣ Signs of the high-level correction coming to an end
Gold corrected down from the 4264 high and reached a low of 4163.
The latest H4 candle shows a long lower wick, reflecting strong buying pressure and indicating that bulls have begun to defend.
2️⃣ Bollinger Bands Structure
Price has rebounded from below the middle band back above it → short-term bearish pressure is easing
Lower band at 4143 was not touched
Middle band (≈4202) is currently the key resistance & reversal level
➡️ If gold reclaims the Bollinger middle band at 4202, H4 will return to a strong bullish rhythm.
3️⃣ Moving Averages
MA5 and MA10 are pointing downward → short-term correction continues
But MA20 (≈4200–4202) is still sloping upward → the medium-term bullish structure remains intact
Current price is right under the MA20 resistance zone
➡️ 4200–4202 = the key reversal confirmation level for H4.
✅ 1H Chart (H1) Trend Analysis
1️⃣ Downtrend channel interrupted by a “strong lower wick”
Gold printed a significant lower shadow at 4163, signaling a classic “bottoming rejection.”
2️⃣ Moving Averages
Price has moved back above MA5 and MA10 → bearish momentum weakening
MA20 (≈4210) is still capping the rebound
➡️ A break above MA20 would flip H1 back into a bullish short-term structure.
3️⃣ Bollinger Bands Structure
Lower band (≈4176) was tested and price bounced sharply → strong support
Middle band (≈4210) is the short-term bullish breakout level
🔴 Resistance Levels: 4200–4202 / 4230–4234 / 4250–4256
🟢 Support Levels: 4185–4180 / 4175 / 4163
✅ Trading Strategy Reference
🔰 Main Strategy: Buy on Pullbacks (Trend intact, buy dips)
Current price around 4195 is part of the early rebound phase.
“Steady buyers” should watch two signals:
🔍 Signal 1: Ability to hold above 4202 (H4 reversal level)
🔍 Signal 2: Break above 4210 (H1 middle band)
🟠First Buy Zone: 4185–4180 (short-term support)
If price retests and holds, consider light long positions
🎯 Targets: 4205 / 4215 / 4234
⛔ Stop-loss: below 4170
🟠Second Buy Zone: 4175–4165 (strong support zone)
This area is the “institutional absorption zone.”
If tested again and holds, it becomes an excellent medium-term long entry.
🎯 Targets: 4205 / 4234 / 4250
⛔ Stop-loss: below 4155
🔰 Secondary Strategy: Short on Rejections (short-term only)
Even though price has rebounded, key resistance has not yet been broken, so shorting rejections remains a short-term strategy:
🟠First Sell Zone: 4202–4210
Short lightly if any of the following appear:
▪ Long upper wick
▪ Bearish 1H candle
▪ Weak breakout with low volume
🎯 Targets: 4185 / 4175
⛔ Stop-loss: above 4220
🟠Second Sell Zone: 4234–4250
(strong resistance, suitable for high-level shorts)
🎯 Targets: 4205 / 4180
⛔ Stop-loss: above 4262
✅ Trend Summary
1️⃣ 4163 = confirmed short-term bottom of this correction
2️⃣ Gold is currently in a bottoming rebound structure
3️⃣ 4202–4210 = must-break resistance zone for short-term bulls
4️⃣ Break above 4210 → gold turns strong again, targeting 4234 / 4250
5️⃣ Break below 4175 → gold may retest 4163, or even drop toward 4150
6️⃣ Medium-term bullish structure remains intact; the market has only completed a necessary technical correction
SLV long-term TASilver is going parabolic as well as gold, sure there are many who wonder when is the correction, and yet it's bullish on weekly time frame yes, but there's a negative divergence in the process on daily that started after the recent distribution, which means mid-term will correct eventually and you can't ignore the gap between the price and SMA50 on weekly which is getting huge, so you have to be prepared for the correction in the near future. In general, even after the correction it has plenty of cash flow on weekly trend yet and it will take time to absorb and distribute all the supply and likely the uptrend will continue through 2026.

$BB Squeeze Incoming?✔️ What I see:
- Declining resistance is being tested right now.
- Falling wedge pattern forming since early November — bullish structure.
- Price is sitting ABOVE the lower green channel → strength.
- Recent candles show higher lows, even during weak volume → buyers present.
- 1H RSI = ~56 → neutral but leaning bullish.
- Squeeze histogram is turning green → momentum is shifting.
⭐ Interpretation:
- BB is attempting to break out of the 1H wedge.
- If it clears $4.13–4.15, it confirms.
✔️ Massive daily falling wedge
- Lower green support
- Upper orange downtrend
- This wedge started mid-September → long consolidation → now tightening.
- This is the exact pattern where stocks pop 10–25% IF volume enters.
✔️ Weekly RSI = 51
- Neutral and rising → bullish tilt.
✔️ Weekly trendline (your blue line) is flattening
-Flattening = trend exhaustion.
-This often precedes a reversal.
✔️ Weekly volume is LOW
-Low volume during a downtrend = sellers are done.
-This is typically where whales begin loading quietly.
🔥 Price Targets if BB Breaks Out:
4.15 → breakout trigger
4.33 → fib + supply zone
4.48–4.55 → big target
4.72
5.00

DG $107 Call 12/12I identified a double bottom pattern, drew my target then waited for confirmation to enter a call option.
The target was met and continued towards the upside.

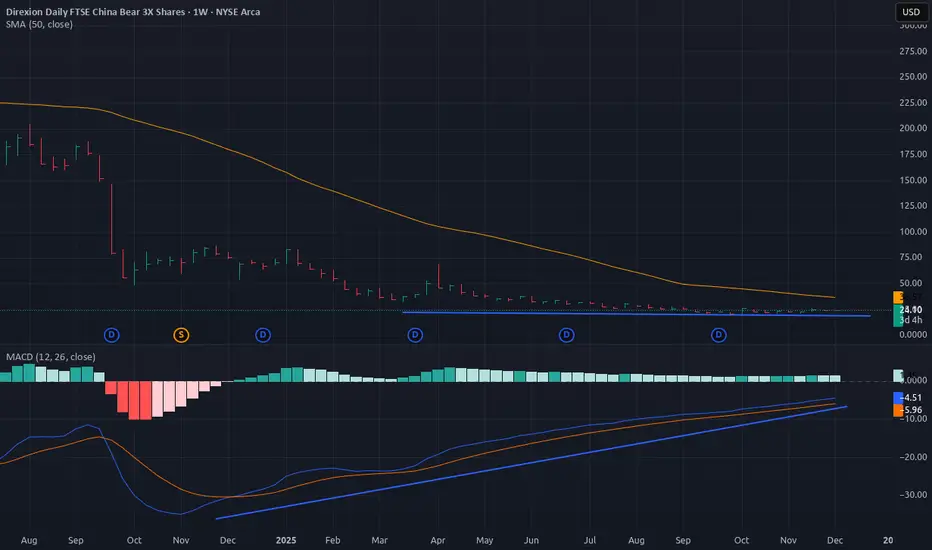
YANG long-term TABeware of China Bear long run, this ETF has been steadily improving its cash flow since September, even from the beginning of the year if you use MACD, you can notice that on many indicators including MACD, you can clearly see that something is cooking, yes the volumes are still in bearish territory but they are really close to breakout. Keep an eye on YANG.
Inverted Head And 2 Shoulders BULLISHHello Traders,
i know it is something outside the box however we all looking now for the fresh winnings as you all know w e have reached all our targets and we closing all the positions now locking the profits in our group however i found this paper very interesting if you are looking in to it you will see the pattern and the increasing of buying pressure the only thing missing is the volume up once i get this its a green indication forthe price reaching all time high again
good luck boys

GBPAUDBased on Support and Resistance this trade was taken on GBPAUD. We just keep improving.
You don't want to miss what next year hold for us.
Stay consistent on the little pips.
Technical indications, chart patterns and trend analysis.
Just another day in the office.
DrElder_
